
[1] dataset
import pandas as pddrinks = pd.read_csv('http://bit.ly/drinksbycountry')drinks.head()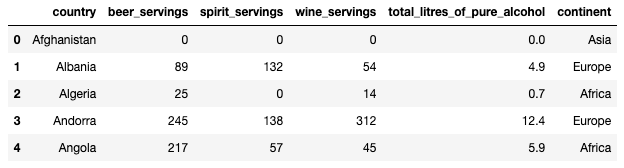
[2] .groupby()
drinks.beer_servings.mean()

<output>
106.16062176165804drinks.groupby('continent').beer_servings.mean()
<output>
continent
Africa 61.471698
Asia 37.045455
Europe 193.777778
North America 145.434783
Oceania 89.687500
South America 175.083333
Name: beer_servings, dtype: float64drinks[drinks.continent=='Africa'].beer_servings.mean()
<output>
61.471698113207545When should you use a groupby in general?
I would say that the role of groupby is anytime you want to analyze some pandas series by some category.
drinks.groupby('continent').beer_servings.max()

<output>
continent
Africa           376
Asia             247
Europe           361
North America    285
Oceania          306
South America    333
Name: beer_servings, dtype: int64
In this case, the category is continent and I want to analyze beer servings by category.
drinks.groupby('continent').beer_servings.min()

<output>
continent
Africa            0
Asia              0
Europe            0
North America     1
Oceania           0
South America    93
Name: beer_servings, dtype: int64
Mean is not the only aggregation function you can use.
For example, you can use the function max, min, etc instead and this is showing me the min 'beer servings by continent'.
That is pretty cool I think but even more powerful than that is there is this function called dot AGG.
Dot AGG allows us to spectify multiple aggregation functions at once.
So we can say for instance count, min, max, and mean.
[3] .agg()
drinks.groupby('continent').beer_servings.agg(['count','min','max','mean'])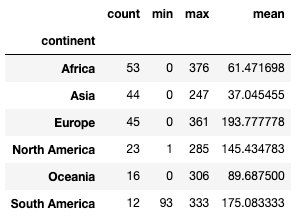
drinks.groupby('continent').mean()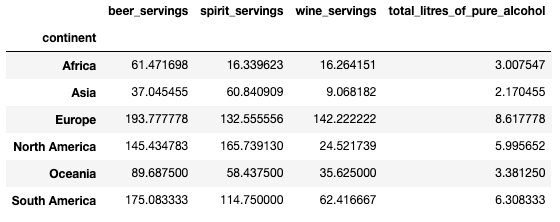 You do not actually have to specify a column like beer servings.
You can just not specify it at all and it will calculrate on the mean in this case across all of the numeric columns.
Now this is a great idea if you have a lot of numeric columns, but if you have only four numeric columns this works quite well.
And we can actually really easily disply this in visual form like..
"""
if you are in the ipython notebook
I just need you to run "%matplotlib inline" first.
"""

%matplotlib inline
drinks.groupby('continent').mean().plot(kind='bar');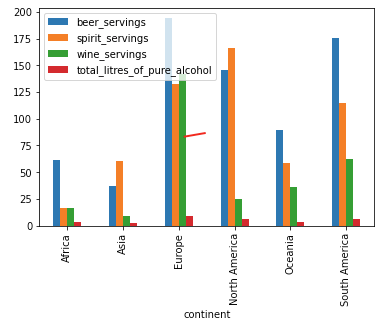
bonne journée.