※ CDN 방식 사용
1. chart.js
2. data label을 사용하기 위한 플러그인
<head>
	<script src="https://cdn.jsdelivr.net/npm/chart.js"></script>
	<script src="https://cdn.jsdelivr.net/npm/chartjs-plugin-datalabels@2.0.0"></script>
</head>
x축 label 줄바꿈 : 이중배열
data : {
  labels: [['Extremely','unhappy'], '', '', 'Neutral', '', '',['Extremely','happy']],
  ...
}
option 부가 설명
( max , y축 , chart.js 크기 조절 등 )
const ctx = document.getElementById('myChart1').getContext('2d');
const data = {} // 사용자 임의 값
const option = {
	type: 'bar',
    data: data,
    showTooltips: false,
    options : {
    	responsive:false, // 자동 크기조정 끄기 ( canvas 사이즈 크기로 하려면 false )
        scales: {
            y: {
              beginAtZero: true,
              max:11, // max 값 조정
              ticks:{ // y축 줄당 표시 값
                stepSize:1
              }
            },
            x: {
              beginAtZero: true,
              type: 'category',
            }
        }

    }
}


const myChart = new Chart(ctx,option)
그래프에서 라벨 사용
1. 플러그인 cdn 스크립트 붙여넣기
const ctx = document.getElementById('myChart1').getContext('2d');
const data = {
label : [,,,,],
datasets : [
{
...
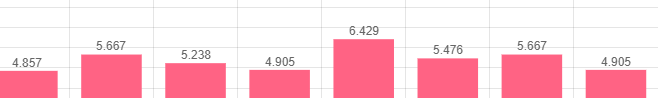
datalabels : {
anchor: 'end', // 표시 위치
align: 'top', // 표시위치에서 어디쪽으로 배치할지
} //라벨 위치 지정 필요
} // data 1
]
} // 사용자 임의 값
const option = {
type: 'bar',
data: data,
plugins:[ChartDataLabels], // 이것 필요
...
}
const myChart = new Chart(ctx,option)

Hy