Matplotlib 불러오기
import matplotlib.pyplot as plt간단한 데이터로 라인그래프 그려보기
x = [1, 2, 3, 4, 5]
y = [2, 4, 6, 8, 10]

plt.plot(x, y)
plt.xlabel('X-axis')
plt.ylabel('Y-label')
plt.title('Example')
plt.show()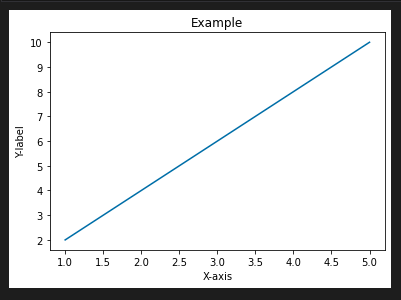

데이터프레임 시각화
데이터프레임 정의
import pandas as pd

df = pd.DataFrame({
    'A': [1, 2, 3, 4, 5],
    'B': [5, 4, 3, 2, 1]
})
plot()
df.plot(x = 'A', y = 'B')
plt.show()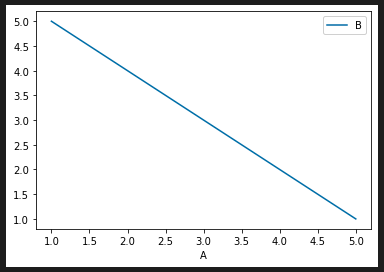
스타일 설정하기
color, linestyle, marker
df.plot(x = 'A', y = 'B', color = 'green', linestyle = '--', marker = 'o')
plt.show()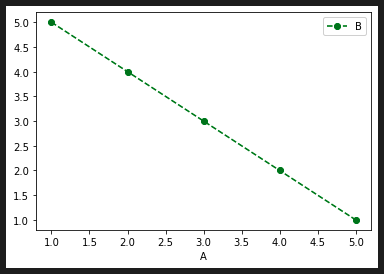
color
- 'blue', 'green', 'red', 'cyan', 'magenta', 'yellow', 'black', 'white'와 같은 기본 색상 이름
- RGB 값을 직접 지정할 수 있음
linestyle
- '-'(실선), '--'(대시선), ':'(점선), '-.'(점-대시선) 등
marker
- 'o'(원), '^'(삼각형), 's'(사각형), '+'(플러스), 'x'(엑스) 등
LineAPI - matplotlib 공식 문서
MarkerAPI - matplotlib 공식 문서
Line styles - matplotlib 공식 문서
범례 추가하기
방법 1
df.plot(x = 'A', y = 'B', color = 'red',
		linestyle = '--', marker = 'o', label = 'Data Series')
plt.show()
방법 2
ax = df.plot(x = 'A', y = 'B', color = 'red', linestyle = '--', marker = 'o')
ax.legend(['Data Series'])
축 제목 입력하기
ax = df.plot(x = 'A', y = 'B', color = 'red', linestyle = '--', marker = 'o')
ax.legend(['Data Series'])
ax.set_xlabel('X-axis')
ax.set_ylabel('Y-label')
ax.set_title('Title')
plt.show()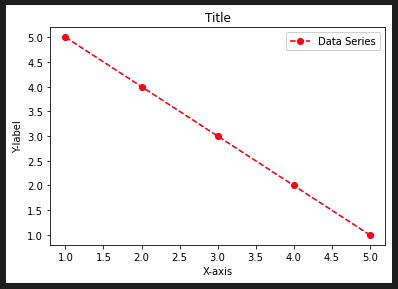
텍스트 추가하기
- ax.text(x축 좌표, y축 좌표, '텍스트 내용', fontsize = N)
ax = df.plot(x = 'A', y = 'B', color = 'red', linestyle = '--', marker = 'o')
ax.legend(['Data Series'])
ax.set_xlabel('X-axis')
ax.set_ylabel('Y-label')
ax.set_title('Title')
ax.text(4, 3, 'Some Text', fontsize = 12)
ax.text(2, 2, 'Some Text', fontsize = 10)
plt.show()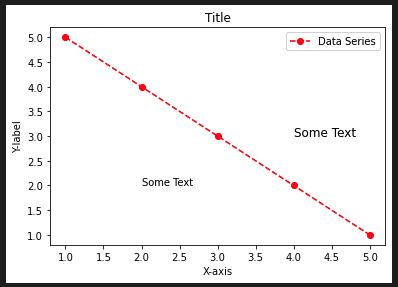
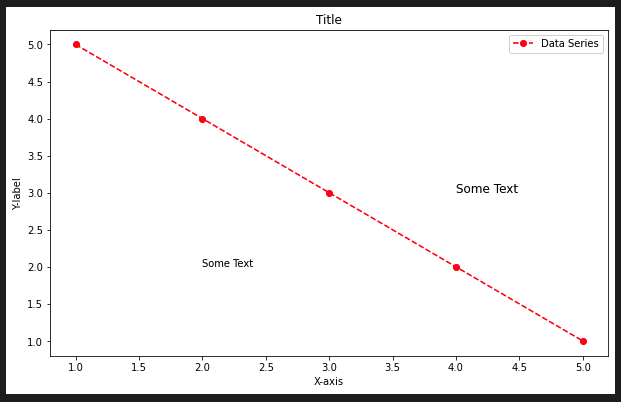
그래프 사이즈 변경
방법 1
plt.figure(figsize = (5, 3))

x = [1, 2, 3, 4, 5]
y = [2, 4, 6, 8, 10]

plt.plot(x, y)
plt.show()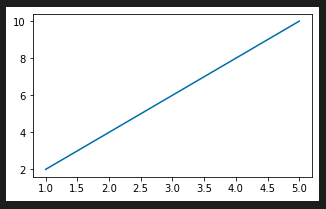
방법 2
fig, ax = plt.subplots(figsize = (10, 6))
ax = df.plot(x = 'A', y = 'B', color = 'red', linestyle = '--', marker = 'o', ax = ax)
ax.legend(['Data Series'])
ax.set_xlabel('X-axis')
ax.set_ylabel('Y-label')
ax.set_title('Title')
ax.text(4, 3, 'Some Text', fontsize = 12)
ax.text(2, 2, 'Some Text', fontsize = 10)
plt.show()

To Dare is To Do