matplotlib 11.03
scatterplot 시각화
sns.set_context("talk")
plt.scatter(x, y, alpha=0.5)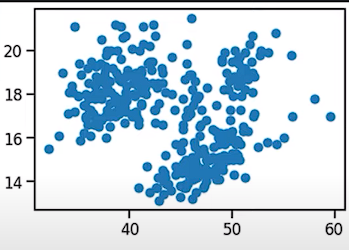
sns.set_palette("Set2")
sns.set_style("whitegrid")
seaborn 시각화 환경 설정 (배색, 스타일)
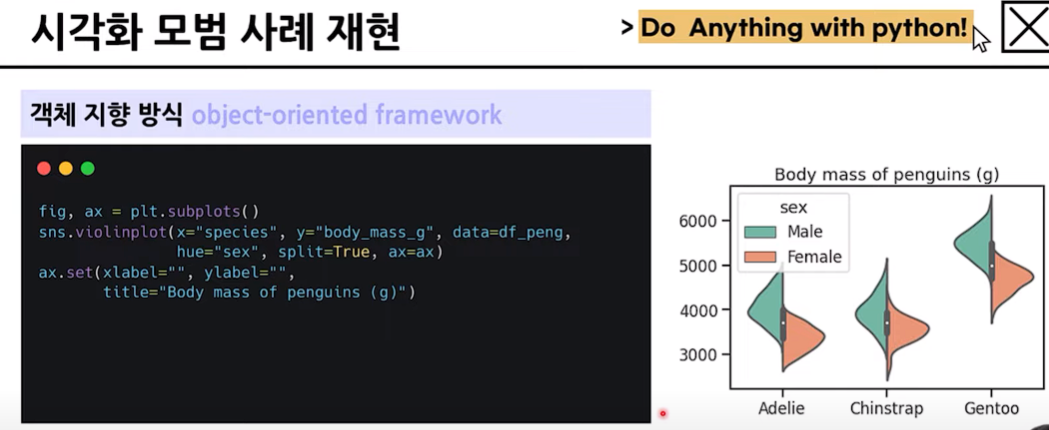
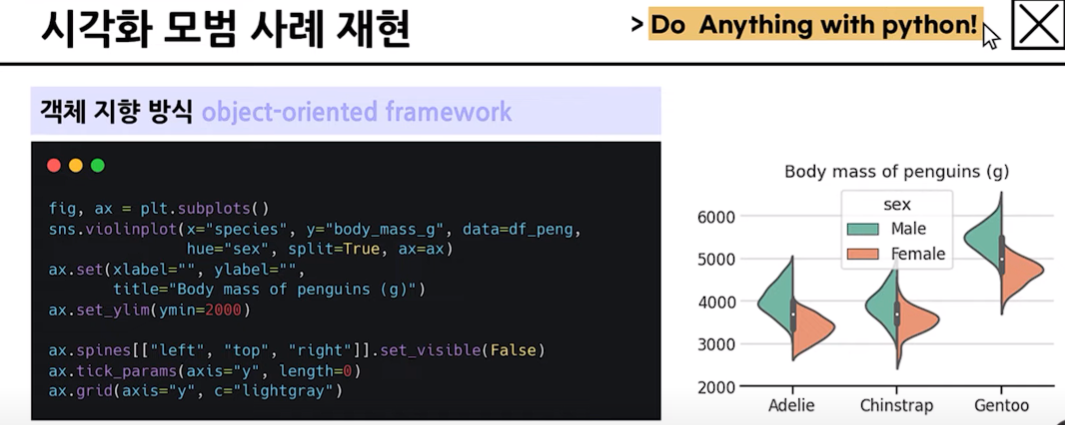
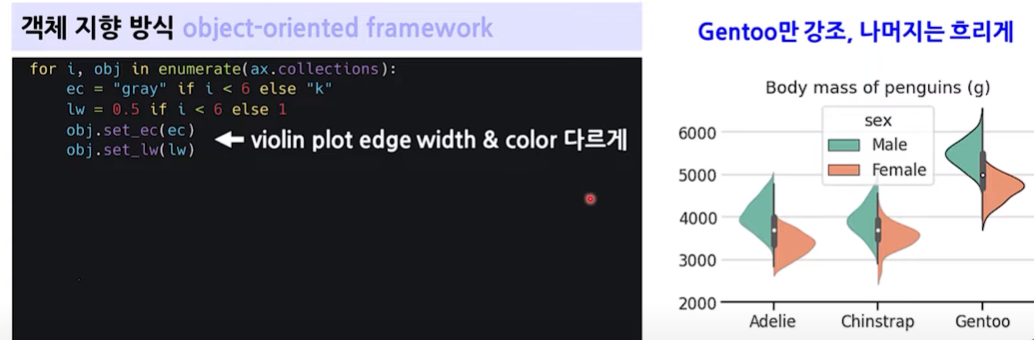
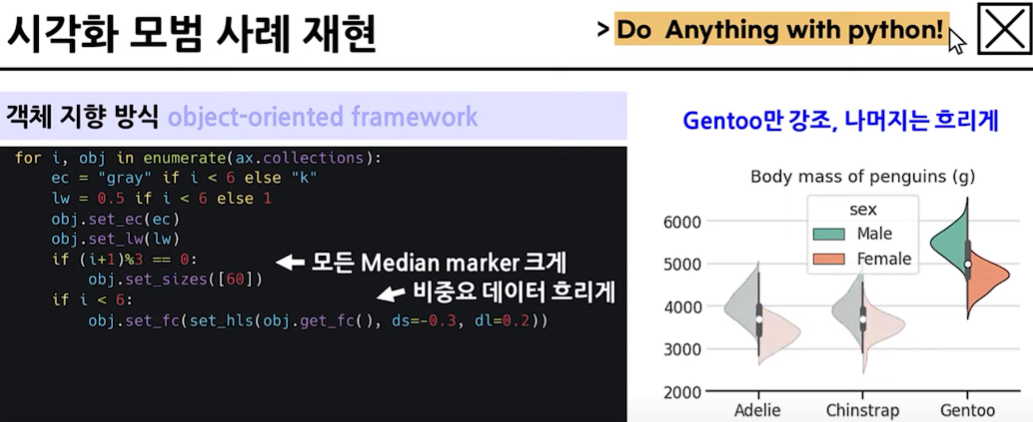
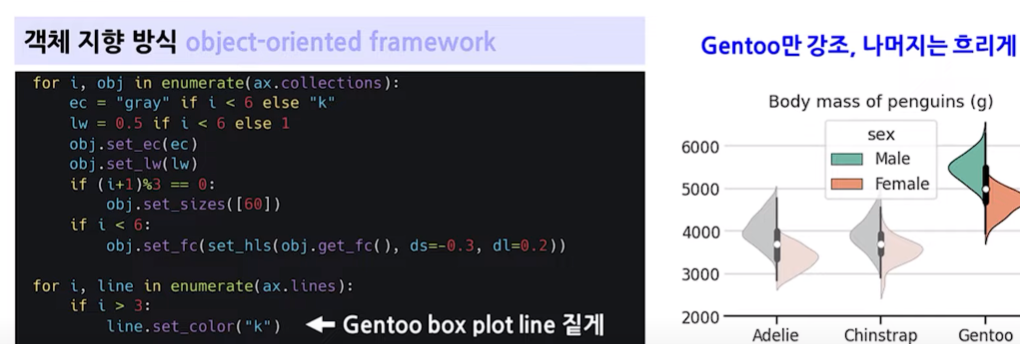
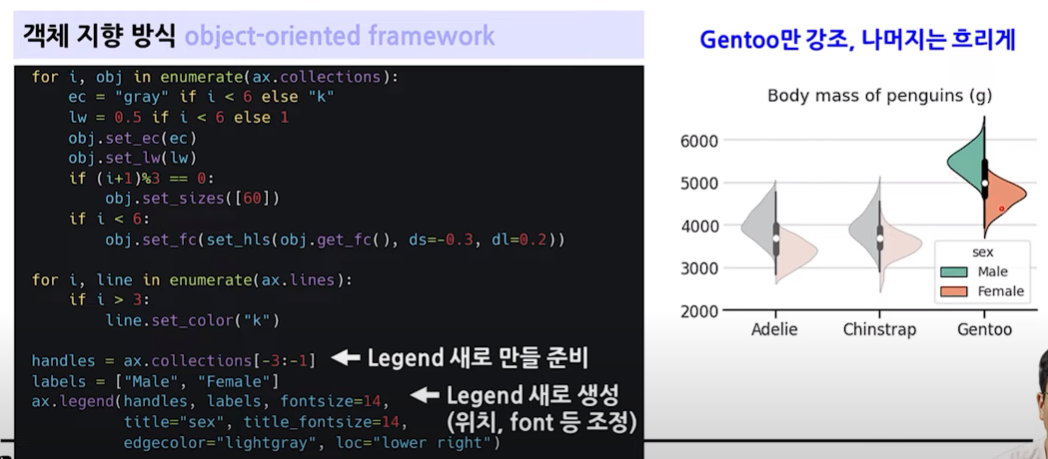
matplotlib - 객체 지향방식
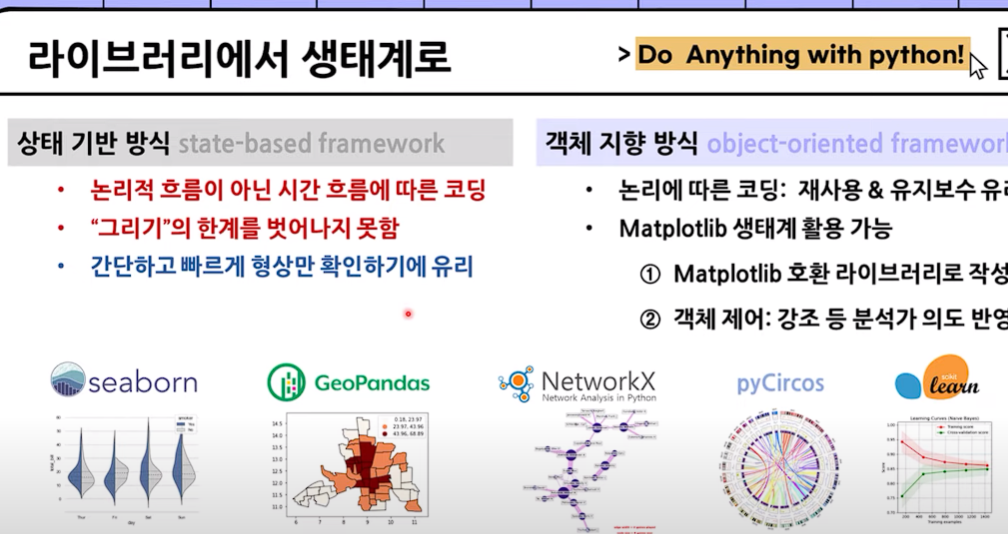
상태기반 방식
- 시간순서에 의하기때문에 초급자전용
- 수정이 불필요하게 번거로움
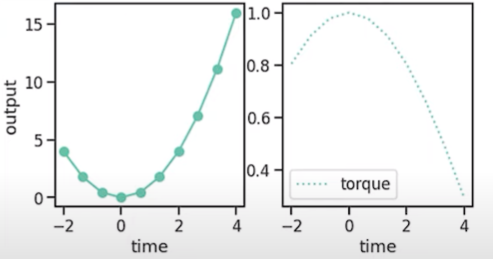
plt.figure(figsize=(8,4))
plt.subplot(121)
plt.plot(x, power, marker="o", ms=10, label="power")
plt.xlabel("time")
plt.ylabel("output")


plt.subplot(122)
plt.plot(x, torque, ls=":", label="torque")
plt.xlabel("time")
plt.legend()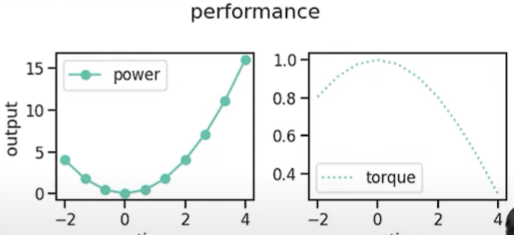
plt.suptitle("performance")
plt.subplots_adjust(wspace=0.1)
plt.tight_layout()
객체지향 방식
- 반복적인 작업에 효율성을 보임
- 배포 후에도 수정과 그래프를 변형하기 용이
fig, axs = plt.subplots(ncol=2, figsize(8,4),
				gridspec_kw={"wspace":0.1},
                constrained_layout=True)

axs[0].plot(x, power, marker="o", ms=10, label="power"
axs[1].plot(x, torque, ls=":", label="torque")

for ax in axs:
	ax.set_xlabel("time")
    ax.legend()
axs[0].set_ylabel("output")

fig.suptitle("performance")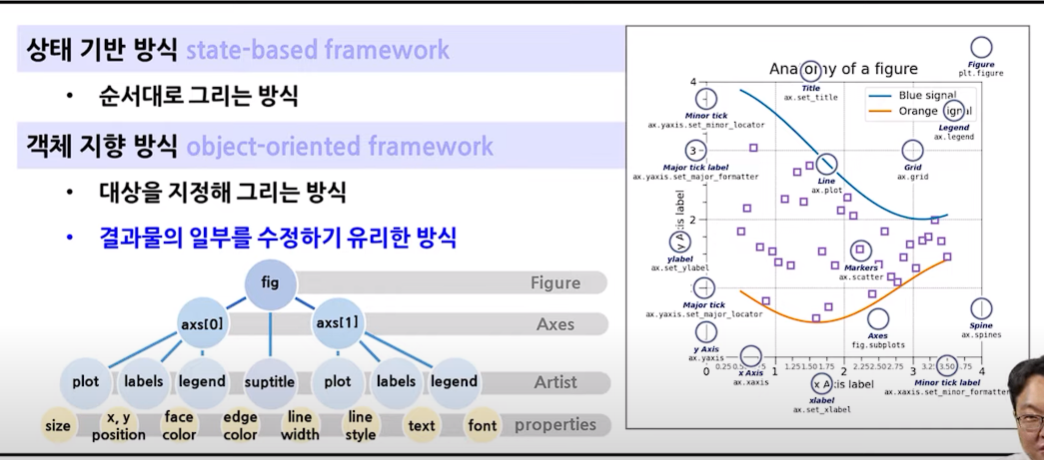
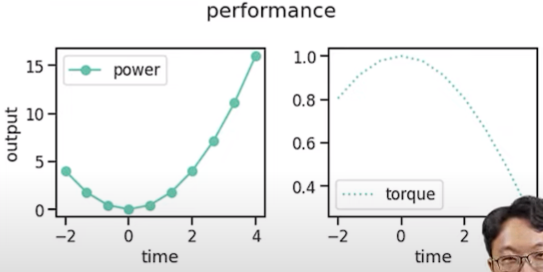
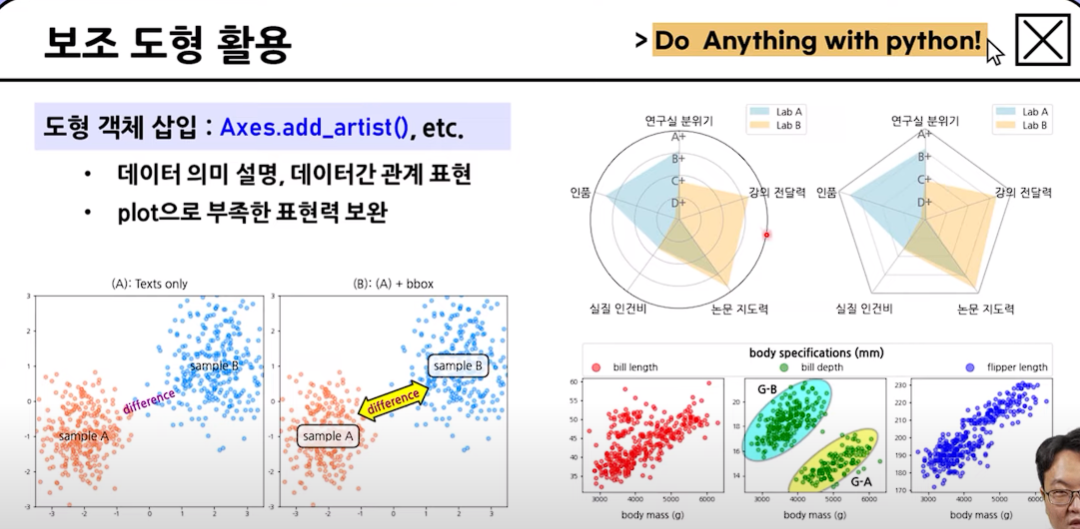
보조도형 활용
- 나중에 코드 참고할 것
- 다양한 시각화

팀장이재모