1)개요
- 시스템을 구축하고 운영을 할 때 일반적으로 초기 단계인 구축 작업(요건 정의, 설계, 구축, 테스트)에 집중하는 경향이 있음
- 구축이후 시스템을 관리하고 운영하는 시간이 압도적으로 김
- 완벽하게 설계를 하더라도 반드시 장애는 발생함
- 클러스터나 애플리케이션이 지금 어떤 상태인지 파악하는 것은 중요한 작업 중 하나
2)클러스터 상태 파악
- EKS Control Plane은 AWS에서 운영되는 관리형 서비스
- Data Plane(Worker Node)을 EC2로 구축하는 경우는 노드를 스스로 관리
- AWS 오토스케일링 기능을 사용해서 Data Plane을 구축하기 때문에 최소 숫자의 서버가 동작하도록 되어 있고 그 대수 아래로 떨어지지 않도록 AWS에서 자동으로 관리를 수행합니다.
3)CloudWatch 의 Container Insights 로 애플리케이션 상태 파악
- CloudWatch 의 Container Insights를 이용하면 클러스터 노드, 파드, 네임스페이스, 서비스 레벨의 메트릭을 참조할 수 있습니다.
Cluster를 Container Insights에서 확인 할 수 있도록 등록
- CloudWatch Agent를 DaemonSet으로 배치를 해서 필요한 메트릭을 CloudWatch로 전송하도록 합니다.
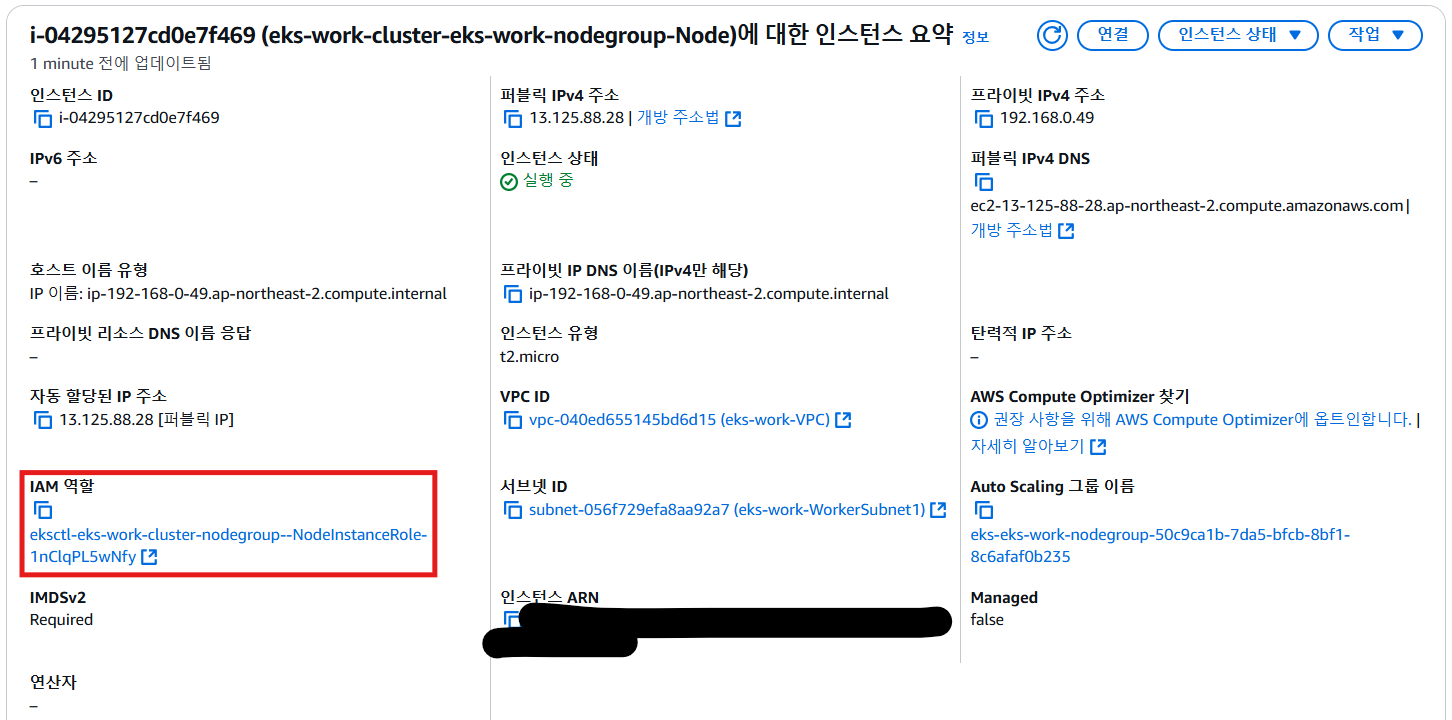
- 데이터 노드에서 IAM 역할에
CloudWatchAgentServerPolicy정책을 추가- EC2 서비스로 이동을 해서 Worker Node로 사용되는 인스턴스를 클릭
- [IAM 역할] - [권한 추가] - [정책 연결]
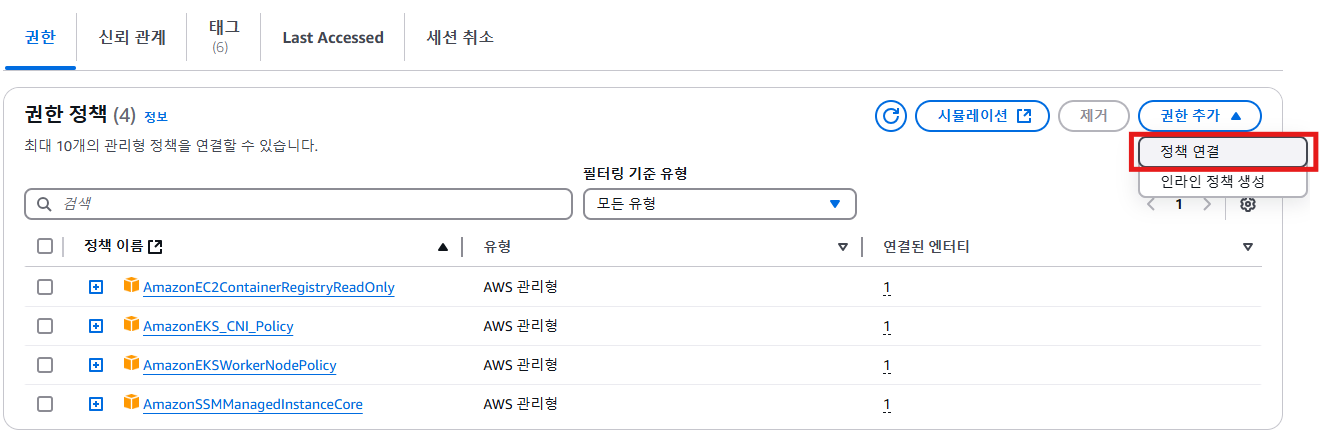
CloudWatchAgentServerPolicy정책을 추가
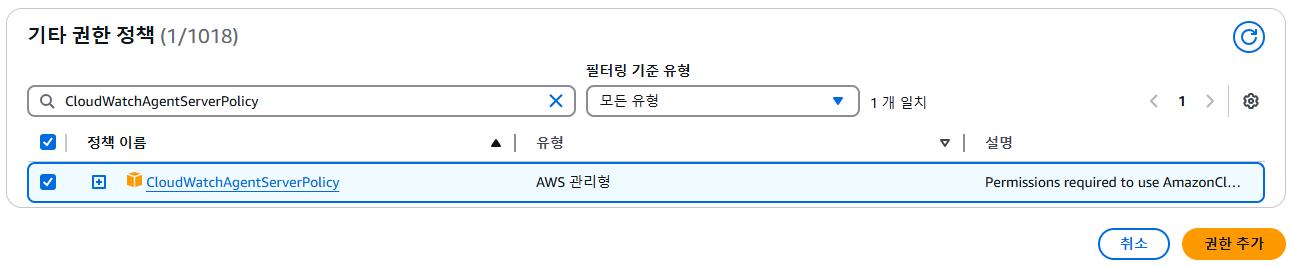
- EC2 서비스로 이동을 해서 Worker Node로 사용되는 인스턴스를 클릭
-
CloudWatch의 네임스페이스 생성
: amazon-cloudwatch라는 Kubernetes 네임스페이스를 생성kubectl apply -f https://raw.githubusercontent.com/aws-samples/amazon-cloudwatch-container-insights/latest/k8s-deployment-manifest-templates/deployment-mode/daemonset/container-insights-monitoring/cloudwatch-namespace.yaml
- kubectl을 사용하여 CloudWatch 에이전트의 서비스 계정을 생성
kubectl apply -f https://raw.githubusercontent.com/aws-samples/amazon-cloudwatch-container-insights/latest/k8s-deployment-manifest-templates/deployment-mode/daemonset/container-insights-monitoring/cwagent/cwagent-serviceaccount.yaml
- kubectl 클라이언트 호스트로 ConfigMap YAML을 다운로드
windows PowerShell 에서는curl -O https://raw.githubusercontent.com/aws-samples/amazon-cloudwatch-container-insights/latest/k8s-deployment-manifest-templates/deployment-mode/daemonset/container-insights-monitoring/cwagent/cwagent-configmap-enhanced.yamlcurl.exe로 수행
cwagent-configmap-enhanced.yaml파일의{{cluster_name}}부분을클러스터 이름으로 수정
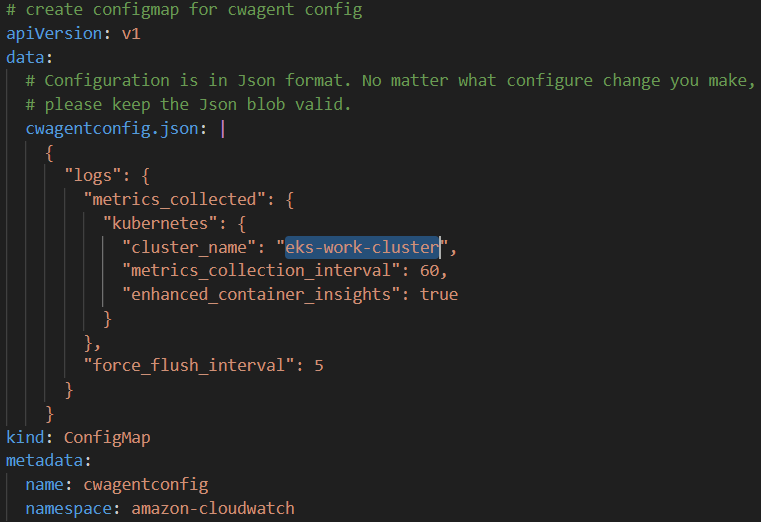
- 수정한 yaml 파일 적용하여 클러스터에서 ConfigMap을 생성
kubectl apply -f cwagent-configmap-enhanced.yaml
- CloudWatch 에이전트를 DaemonSet로 배포
kubectl apply -f https://raw.githubusercontent.com/aws-samples/amazon-cloudwatch-container-insights/latest/k8s-deployment-manifest-templates/deployment-mode/daemonset/container-insights-monitoring/cwagent/cwagent-daemonset.yaml
- 에이전트가 배포되었는지 확인, pod 가 노드의 개수만큼 생성되었는지 확인
kubectl get pods -n amazon-cloudwatch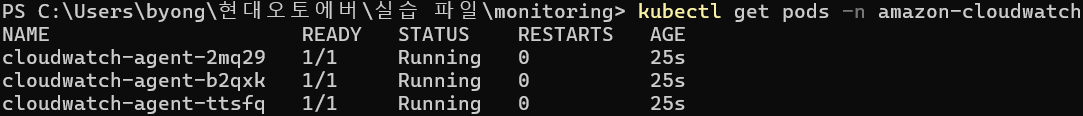
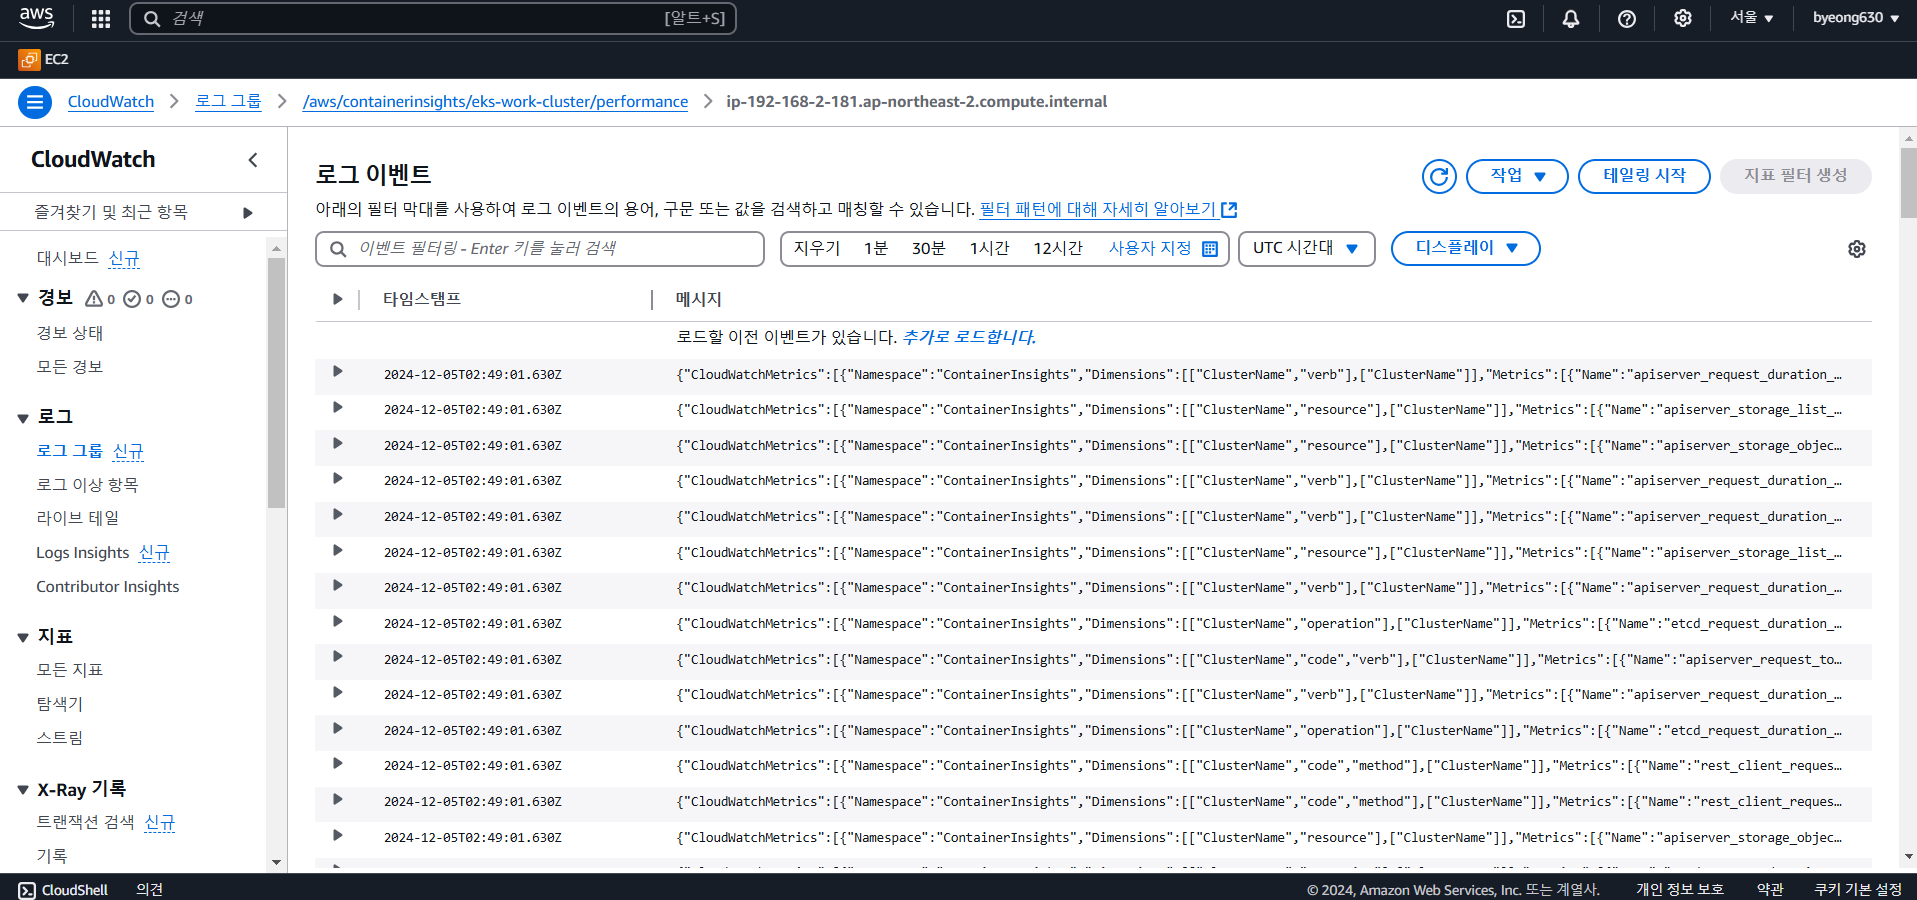
- CloudWatch 의 로그 탭의 로그 그룹에
/aws/containerinsights/eks-work-cluster/performance디렉토리가 생성되었는지 확인
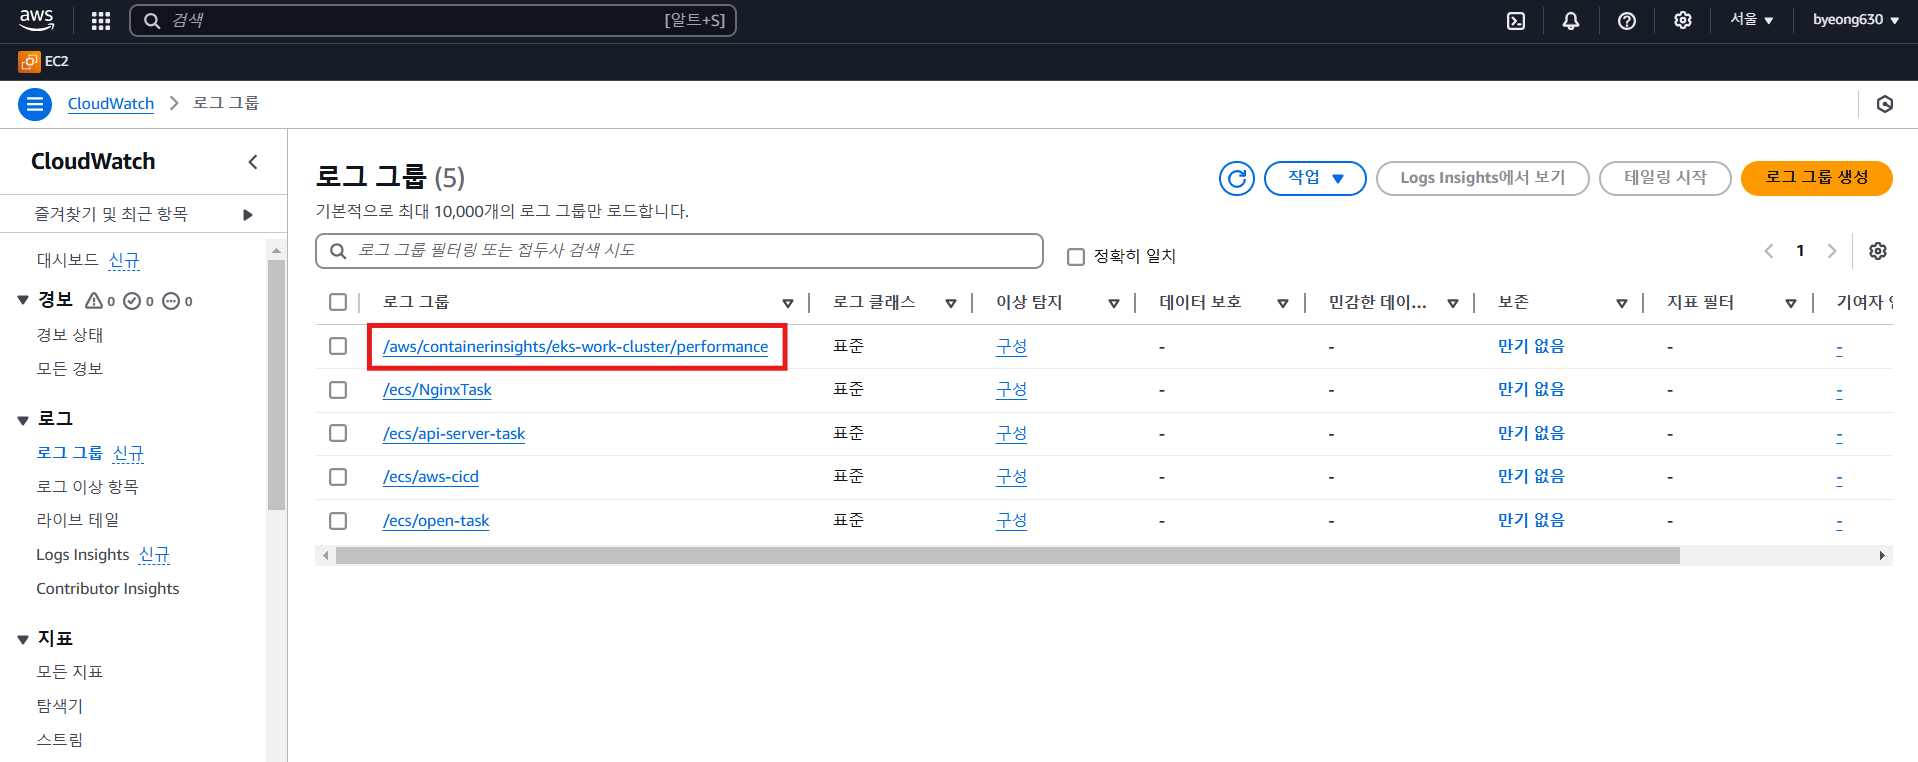
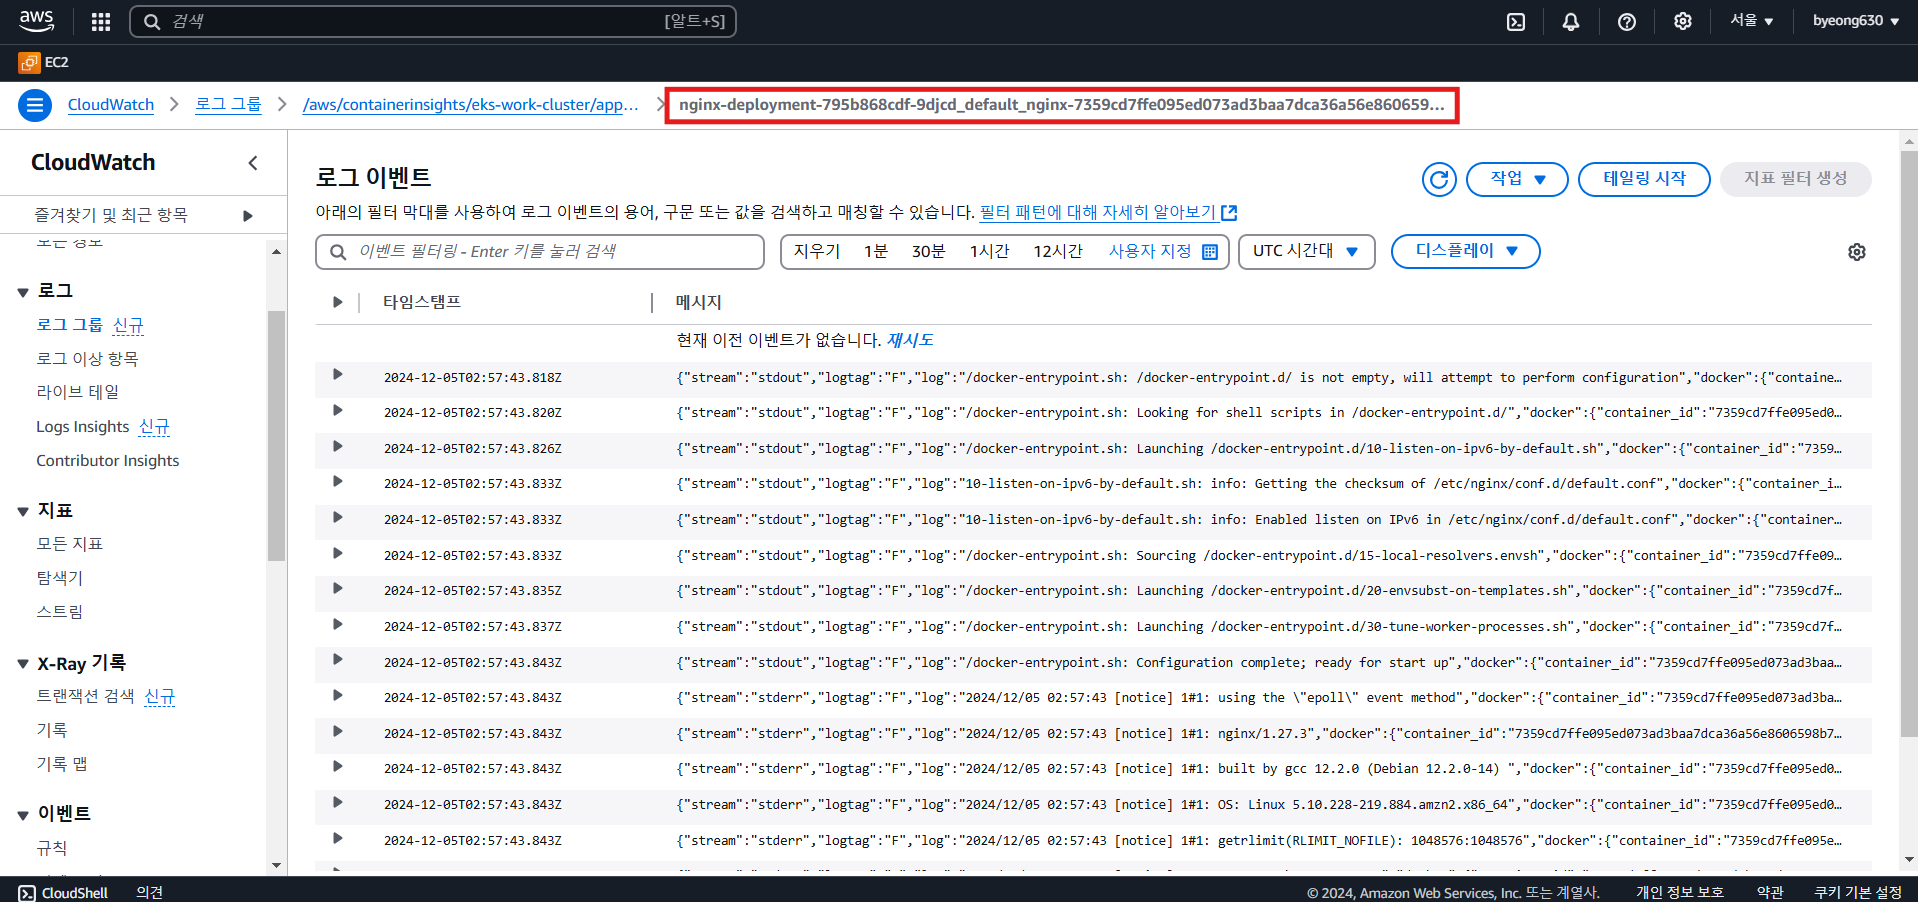
- 로그를 확인
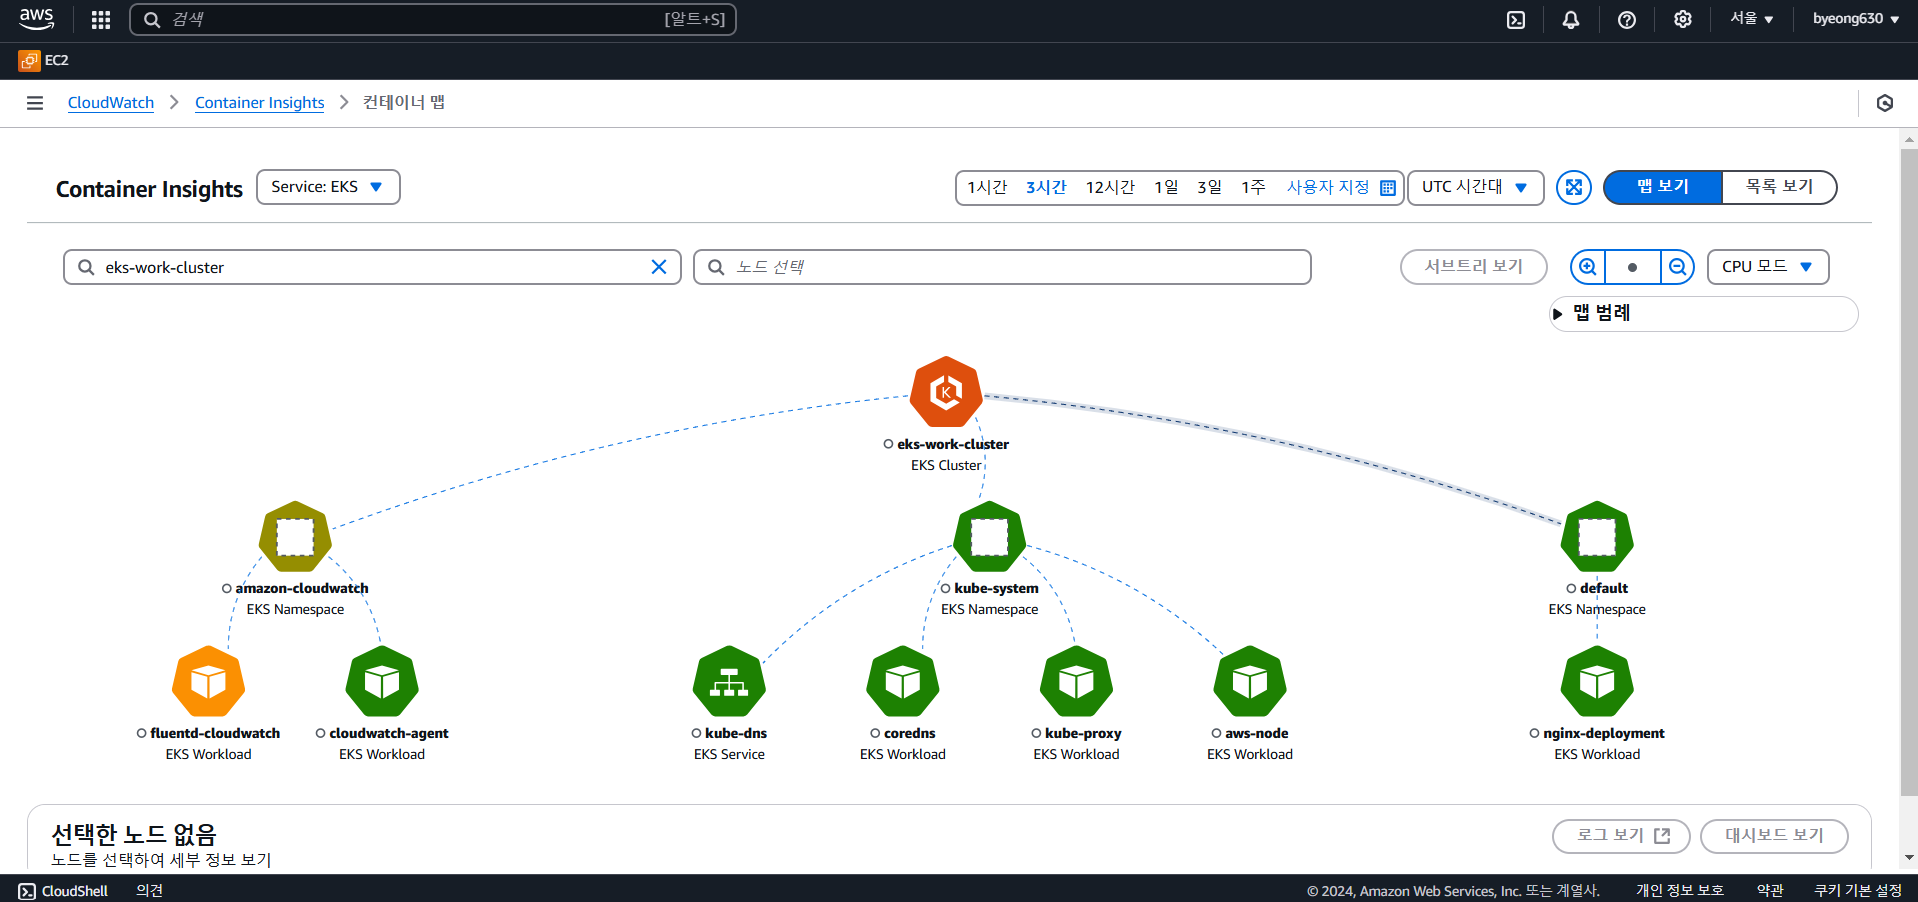
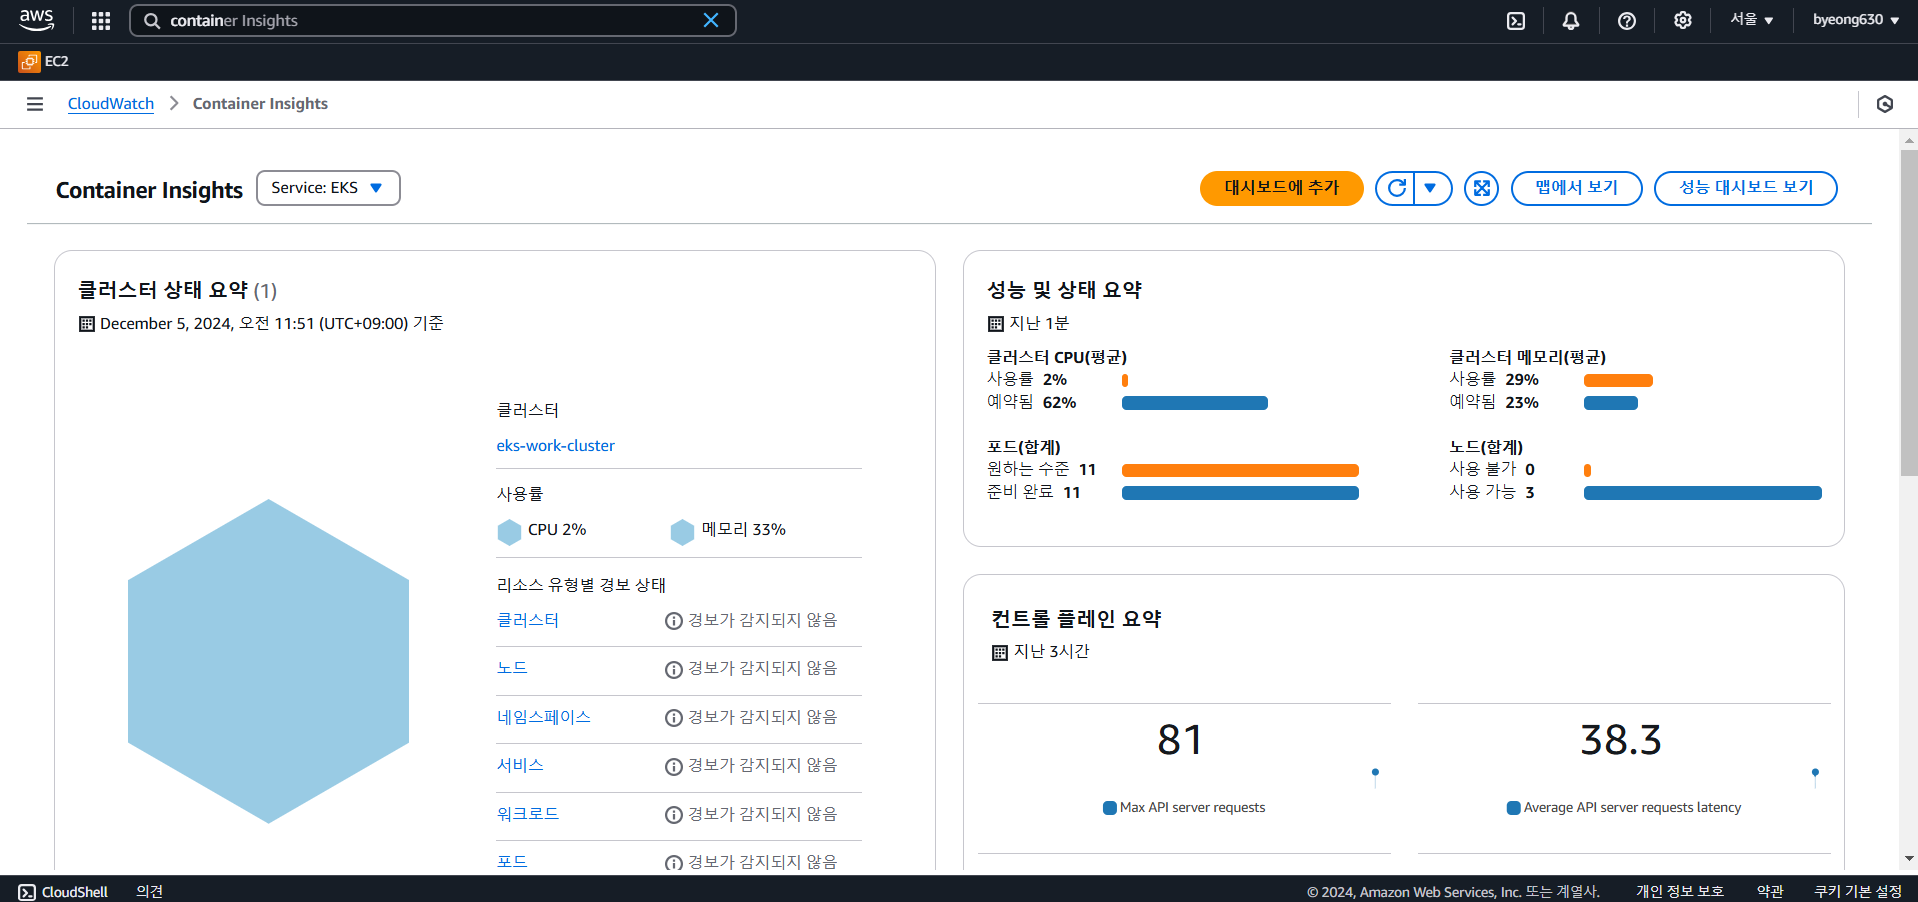
- Cluster를 Container Insights에서 여러 정보를 확인할 수 있다.
- 컨테이너 맵 확인

4)CloudWatch를 이용해서 로그 수집
-
EC2 인스턴스의 [IAM 역할] - [권한 추가] - [정책 연결] 을 눌러서
CloudWatchAgentServerPolicy정책을 연결
- CloudWatch의 네임스페이스를 생성
kubectl apply -f https://raw.githubusercontent.com/aws-samples/amazon-cloudwatch-container-insights/latest/k8s-deployment-manifest-templates/deployment-mode/daemonset/container-insights-monitoring/cloudwatch-namespace.yaml
- Fluentd를 설치를 위해
cluster-info이라는 ConfigMap을 생성kubectl create configmap cluster-info \ --from-literal=cluster.name=cluster_name \ --from-literal=logs.region=region_name -n amazon-cloudwatchkubectl create configmap cluster-info --from-literal=cluster.name=eks-work-cluster --from-literal=logs.region=ap-northeast-2 -n amazon-cloudwatch
- Fluentd DaemonSet를 다운로드한 후 클러스터에 배포
kubectl apply -f https://raw.githubusercontent.com/aws-samples/amazon-cloudwatch-container-insights/latest/k8s-deployment-manifest-templates/deployment-mode/daemonset/container-insights-monitoring/fluentd/fluentd.yaml
- 배포를 확인합니다. 각 노드에는 fluentd-cloudwatch-*라는 이름의 Pod가 하나 포함되어야 합니다.
kubectl get pods -n amazon-cloudwatch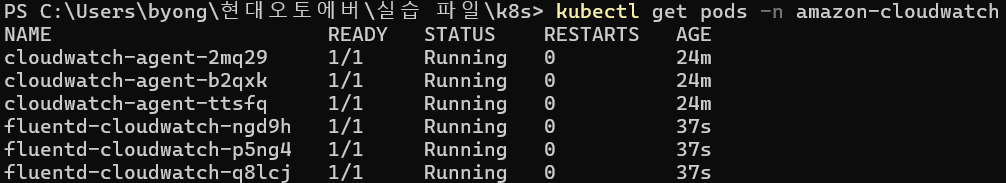
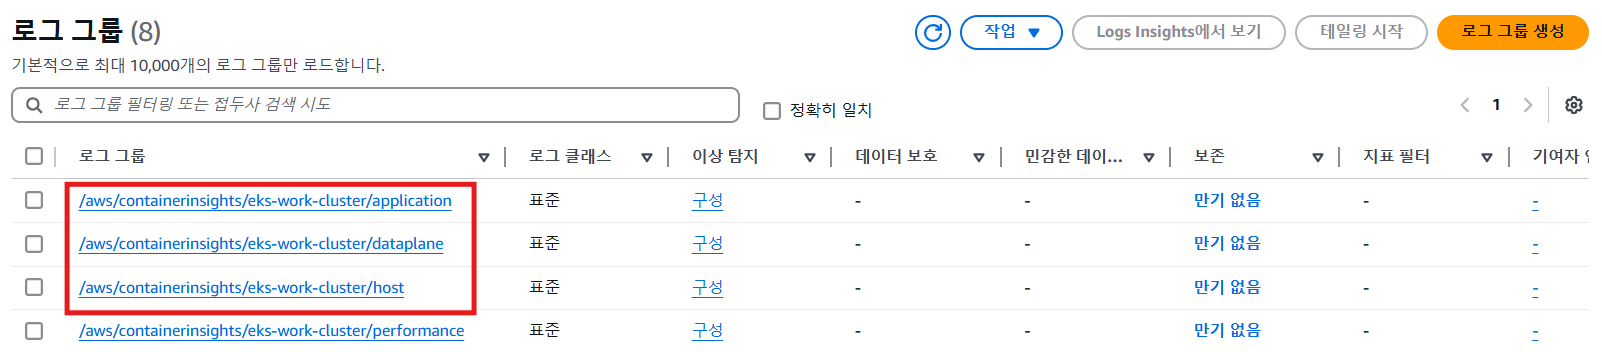
- CloudWatch 콘솔에서 로그 그룹 목록을 확인
- 특정 pod의 log를 확인할 수 있다.