AWS 리소스를 모니터링하는 솔루션으로 New Relic, Datadog, Splunk는 3가지 대표적인 APM(Application Performance Monitoring) 및 Observability 툴입니다.
그 중에, New Relic을 활용해서 AWS 클라우드 인프라, 애플리케이션, 네트워크 등을 단일 대시보드에서 관리 및 분석하는 방법을 설명합니다.
1) 개 요
-
관리콘솔 :
- https://one.newrelic.com/ -
License 체계
- Super User 당 과금
2) AWS 통합
<integration 방안 2가지>
- Metric Stream
- 이벤트가 발생하면 뉴렐릭한테 던져줌 , 수신 주기가 짧게 많이 받음
- 모든 데이터를 다 받음 - APi poling
- 수신 주기가 김
- 불필요한 서비스를 제외 가능
3) EKS 통합
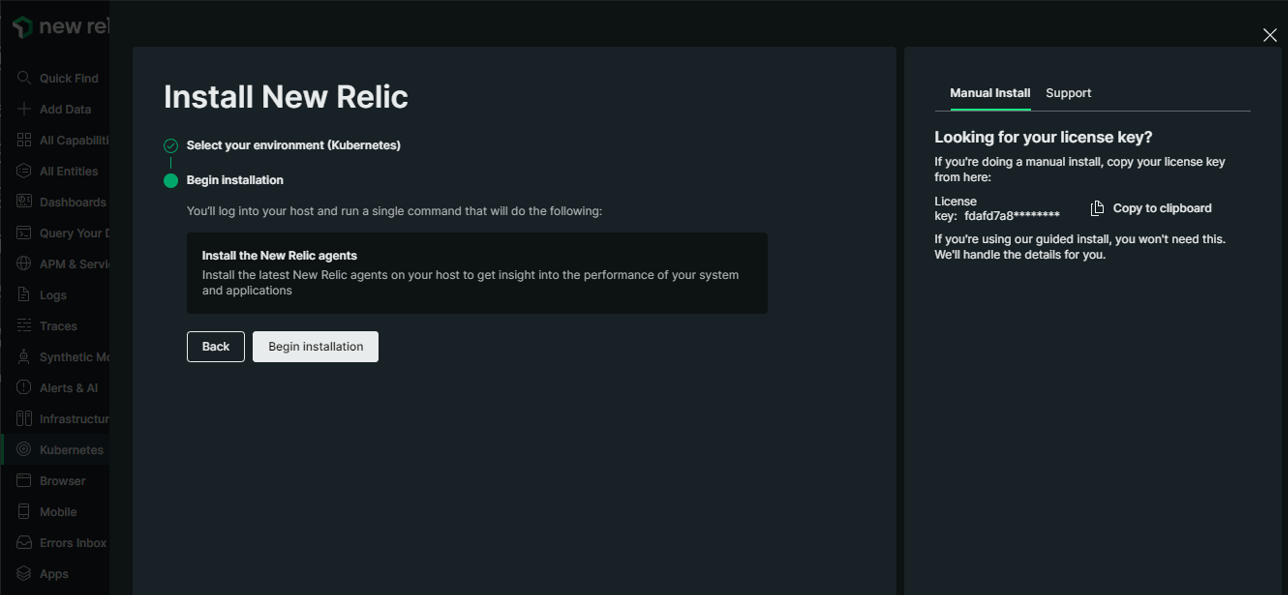
- License key
공통 액션으로써, NewRelic 콘솔 상에서 확인 가능한 License key를 확보합니다.
3-1) NodeGroup 환경일 때
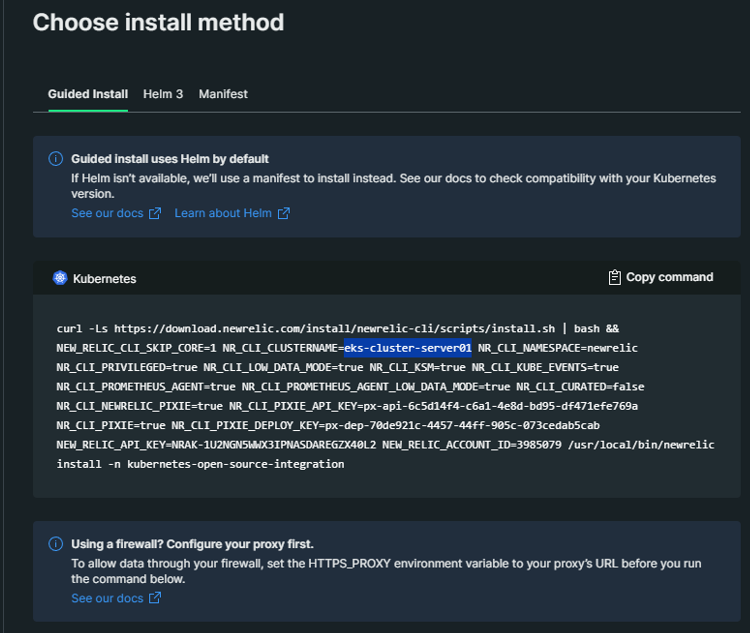
- NewRelic 콘솔 상의 Kubernetes 통합 마법사에서 제공하는 Helm 설치를 그대로 사용
<배포 절차>
1) Kubernetes 통합 마법사에 EKS cluster 이름을 기입
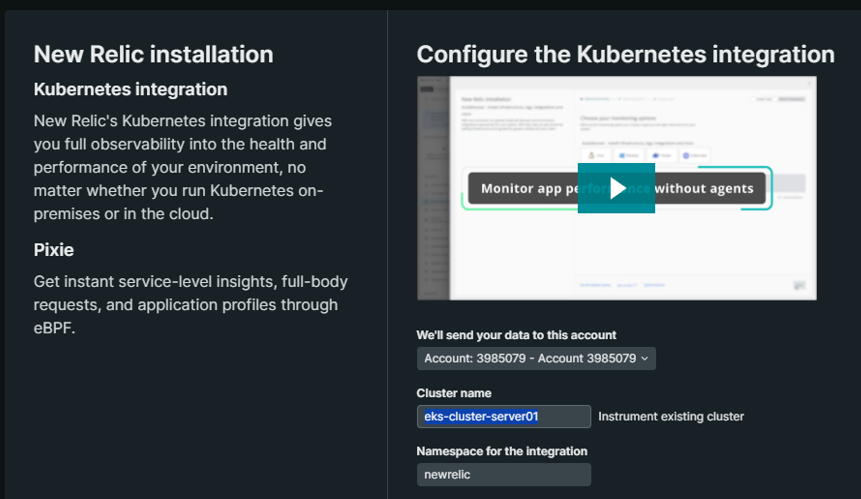
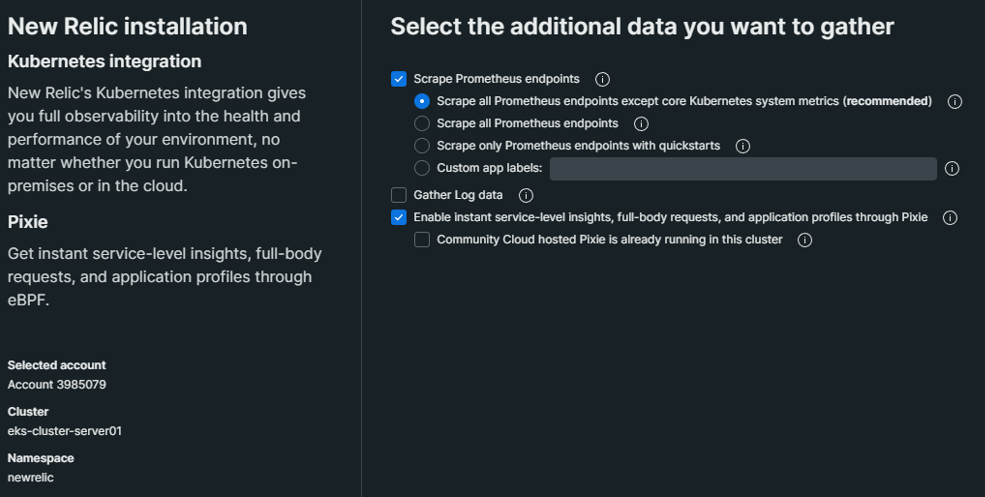
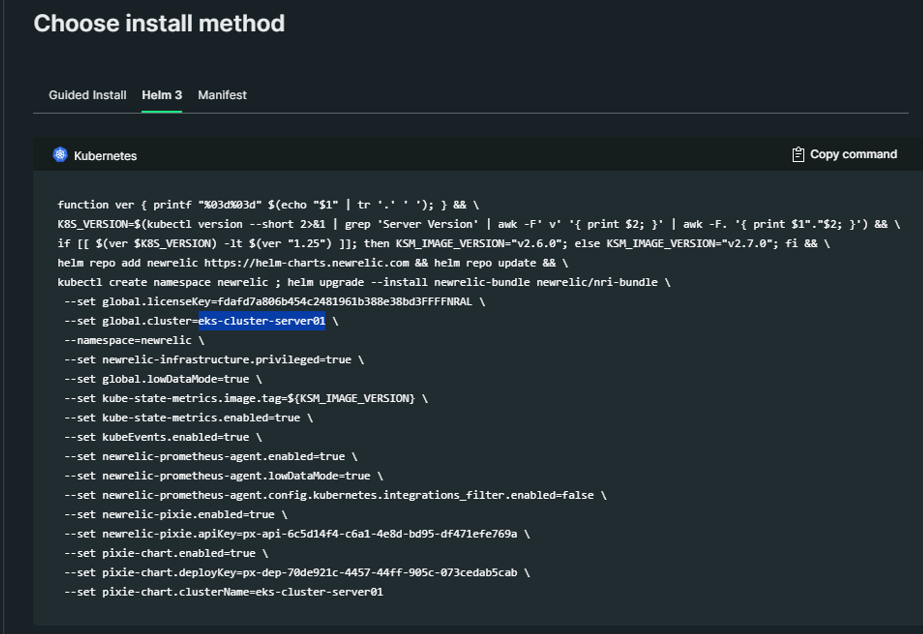
2) 제공되는 Helm 차트를 통해 배포
3) 데이터 수집은 1~3분 정도 소요됩니다.
3-2) Fargate 환경일 때
- Node가 Fargate 기반일 경우 아래 가이드와 같이 구성 절차가 다르게 진행된다
- [공식 가이드]
3-2-1) Auto injection
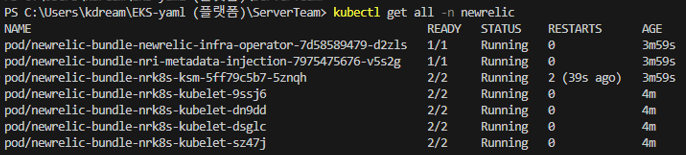
- NewRelic pod 구성 요소
newrelic-bundle-newrelic-infra-operator
newrelic-infra-operator- newrelic-bundle-nri-metadata-injection
- nri-metadata-injection
- newrelic-bundle-nrk8s-ksm
- ksm
- forwarder
- ksm
- newrelic-bundle-nrk8s-kubelet
- kubelet
- agent
- kubelet
- newrelic-bundle-nri-metadata-injection
< 배포 절차 >
helm repo add newrelic https://helm-charts.newrelic.com
helm repo update newrelic
- values.yaml 파일 생성
helm upgrade --install newrelic-bundle newrelic/nri-bundle -n newrelic --create-namespace -f values.yaml
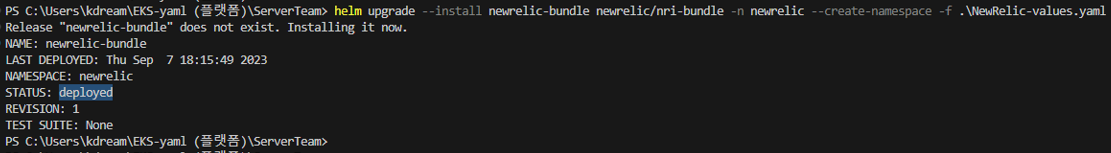
Helm 차트 배포 시, 참조되는 'values.yaml'
## Global values
global:
# -- The cluster name for the Kubernetes cluster.
cluster: "_YOUR_K8S_CLUSTER_NAME_"
# -- The license key for your New Relic Account. This will be preferred configuration option if both `licenseKey` and `customSecret` are specified.
licenseKey: "_YOUR_NEW_RELIC_LICENSE_KEY_"
# -- (bool) In each integration it has different behavior. Enables operating system metric collection on each EC2 K8s node. Not applicable to Fargate nodes.
# @default -- false
# privileged: true
# -- (bool) Must be set to `true` when deploying in an EKS Fargate environment
# @default -- false
fargate: true
## Enable nri-bundle sub-charts
newrelic-infra-operator:
# Deploys the infrastructure operator, which injects the monitoring sidecar into Fargate pods
enabled: true
tolerations:
- key: "eks.amazonaws.com/compute-type"
operator: "Equal"
value: "fargate"
effect: "NoSchedule"
config:
ignoreMutationErrors: true
infraAgentInjection:
# Injection policies can be defined here. See [values file](https://github.com/newrelic/newrelic-infra-operator/blob/main/charts/newrelic-infra-operator/values.yaml#L114-L125) for more detail.
policies:
- namespaceName: namespace-a
- namespaceName: namespace-b
newrelic-infrastructure:
# Deploys the Infrastructure Daemonset to EC2 nodes. Disable for Fargate-only clusters.
enabled: true
nri-metadata-injection:
# Deploy our mutating admission webhook to link APM and Kubernetes entities
enabled: true
kube-state-metrics:
# Deploys Kube State Metrics. Disable if you are already running KSM in your cluster.
enabled: true
nri-kube-events:
# Deploy the Kubernetes events integration.
enabled: true
newrelic-logging:
# Deploys the New Relic's Fluent Bit daemonset to EC2 nodes. Disable for Fargate-only clusters.
enabled: true
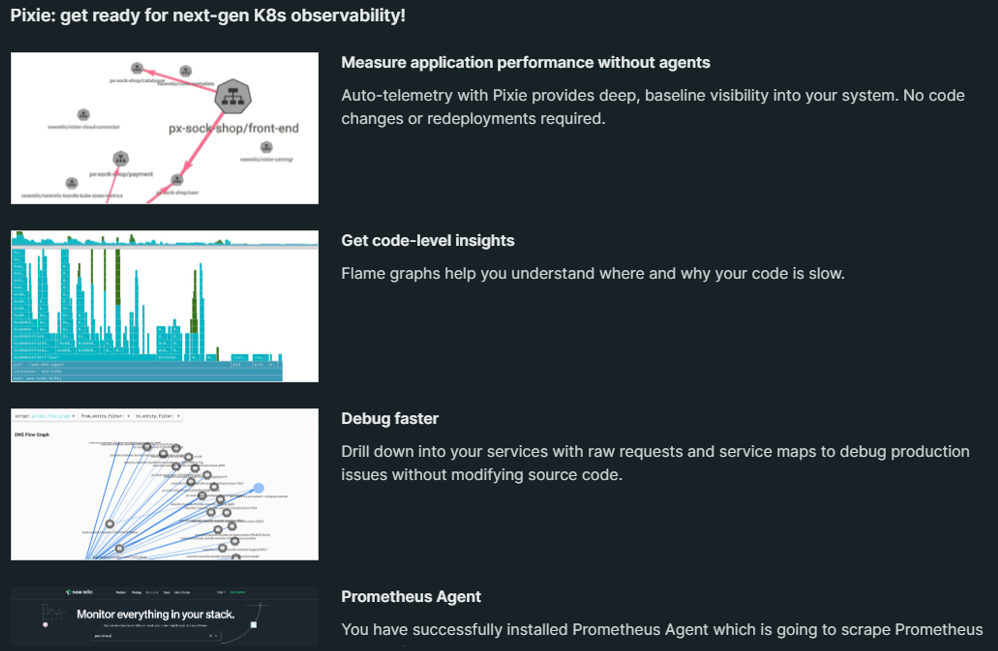
newrelic-prometheus-agent:
# Deploys the Prometheus agent for scraping Prometheus endpoints.
enabled: true
config:
kubernetes:
integrations_filter:
enabled: true
source_labels: ["app.kubernetes.io/name", "app.newrelic.io/name", "k8s-app"]
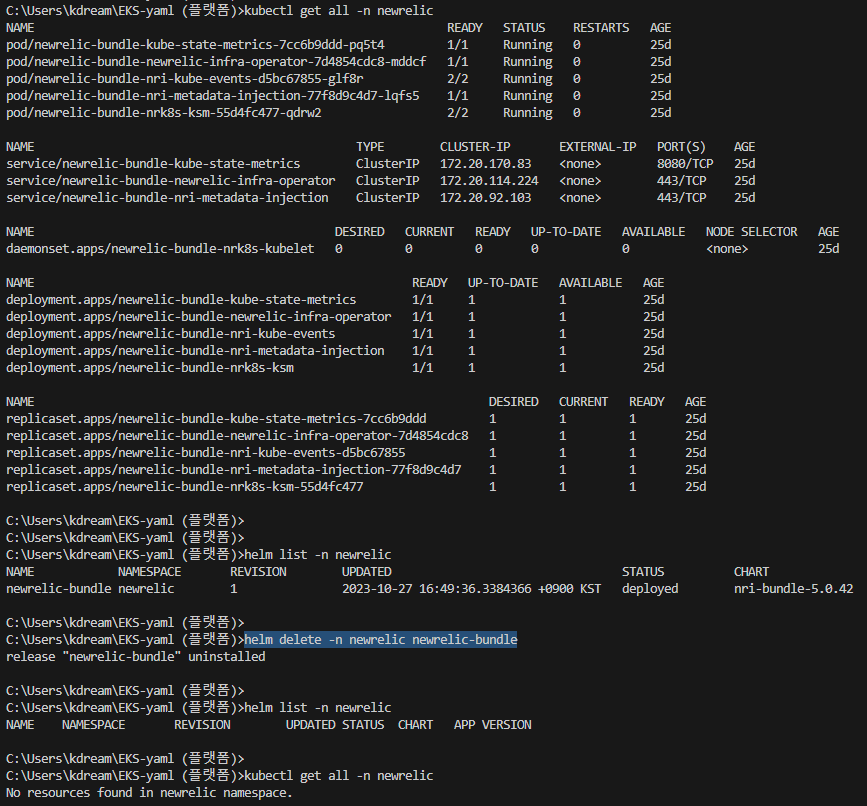
app_values: ["redis", "traefik", "calico", "nginx", "coredns", "kube-dns", "etcd", "cockroachdb", "velero", "harbor", "argocd", "istio"] ※ Helm 차트 삭제 절차
helm list -n newrelic // 차트 조회
helm delete -n newrelic newrelic-bundle // 릴리즈 이름 명시
3-2-2) Manual injection
- 주의 사항
- secret 파일에서 라이센스키를 base64로 변환하여 삽입
<배포 절차>
1) Cluster Role
- name : newrelic-newrelic-infrastructure-infra-agent
2) add an additional sidecar container for the newrelic/infrastructure-k8s image.
- 모니터링을 원하는 workload에 제공된 snipet을 yaml에 삽입해서 sidecar 컨테이너 배포
3) ClusterRoleBinding
- 모니터링하려는 Pod의 서비스 계정을 주체로 하는 ClusterRoleBinding을 생성
4) secret 생성
- New Relic license key 포함된
- Each namespace needs its own secret.
4) agent 방식 서버 등록
모니터링을 할 서버들의 각 OS(Windows, Linux)에 agent를 설치해서 메트릭 및 로그를 가져오는 방식입니다.
< Windows >
- Windows PowerShell에서 아래 명령어 실행
[Net.ServicePointManager]::SecurityProtocol = 'tls12, tls'; WebClient = New-Object System.Net.WebClient; $WebClient.DownloadFile("https://download.newrelic.com/install/newrelic-cli/scripts/install.ps1", "env:TEMP\install.ps1"); & PowerShell.exe -ExecutionPolicy Bypass -File $env:TEMP\install.ps1; $env:NEW_RELIC_API_KEY='NRAK-ZVOSZFFLO5UM6DD5ZZYXBOD7BH2'; $env:NEW_RELIC_ACCOUNT_ID='3985079'; & 'C:\Program Files\New Relic\New Relic CLI\newrelic.exe' install
< Linux >
- agent 설치
curl -Ls https://download.newrelic.com/install/newrelic-cli/scripts/install.sh | bash && sudo NEW_RELIC_API_KEY=NRAK-ZVOSZFFLO5UM6DD5ZZYXBOD7BH2 NEW_RELIC_ACCOUNT_ID=3985079 /usr/local/bin/newrelic install
- newrelic agent 재시작
service newrelic-infra status
service newrelic-infra start
5) Application agent
5-1) SQL
Windows에서 구동 중인 MSSQL의 메트릭을 가져오는 방법입니다.
<구성 절차>
0) Newrelic infra agent 설치
1) sql 접근 계정(newrelic) 생성
2) SQL Server Browser 서비스 시작
3) Newrelic SQL agent 설치
- https://download.newrelic.com/infrastructure_agent/windows/integrations/nri-mssql/nri-mssql-amd64.msi
- 다운로드 후, 설치 파일 더블클릭
4) mssql-config 수정
- C:\Program Files\New Relic\newrelic-infra\integrations.d\mssql-config.yml
5) newrelic infra 서비스 재 시작
--
<sql 접근 계정(newrelic) 생성>
USE master; CREATE LOGIN newrelic WITH PASSWORD = 'My Password'; GRANT CONNECT SQL TO newrelic; GRANT VIEW SERVER STATE TO newrelic; GRANT VIEW ANY DEFINITION TO newrelic;
-- Grant read access privileges section
DECLARE @name SYSNAME
    DECLARE db_cursor CURSOR
    READ_ONLY FORWARD_ONLY
    FOR
    SELECT NAME
    FROM master.sys.databases
    WHERE NAME NOT IN ('master','msdb','tempdb','model','rdsadmin','distribution') and state != 6
    OPEN db_cursor
    FETCH NEXT FROM db_cursor INTO @name WHILE @@FETCH_STATUS = 0
    BEGIN
        EXECUTE('USE "' + @name + '"; CREATE USER newrelic FOR LOGIN newrelic;' );
        FETCH next FROM db_cursor INTO @name
    END
    CLOSE db_cursor
    DEALLOCATE db_cursor
6) 운 영
6-1) 대시보드 변수
- 목 적
- 데이터 필터링을 위한 바로가기를 만들려면 Variable(변수)을 추가합니다.
- 변수를 정의한 후 필터링하려는 차트의 쿼리에 {{variable_name}}을 추가하면 됩니다.
<구성 절차>
1) Variable 선언
- Name to use in queries
- Display name (optional)
- Type
- Query
- List
- Text field - Default value
- Output format
2) Chart의 query 문에 적용
6-2) 대시보드 Query
- 접근 경로 : NewRelic 콘솔 -> Dashboards -> Chart 속성 -> View Query
- 기본 쿼리
SELECT average(cpuPercent) FROM SystemSample FACET
entityNamesince 1 day ago limit 20
SELECT average(memoryUsedBytes / memoryTotalBytes * 100) FROM SystemSample FACET
entityNamesince 1 day ago limit 20
-
특정 AWS Account ID만 출력
SELECT average(cpuPercent) FROM SystemSample where awsAccountId IN ('44444444444') FACET
entityNamesince 1 day ago limit 20* 'in' - where 절 내에서, 복수 개의 인자(위의 경우 'awsAccountId')를 명시할 때 사용
7) TroubleShooting
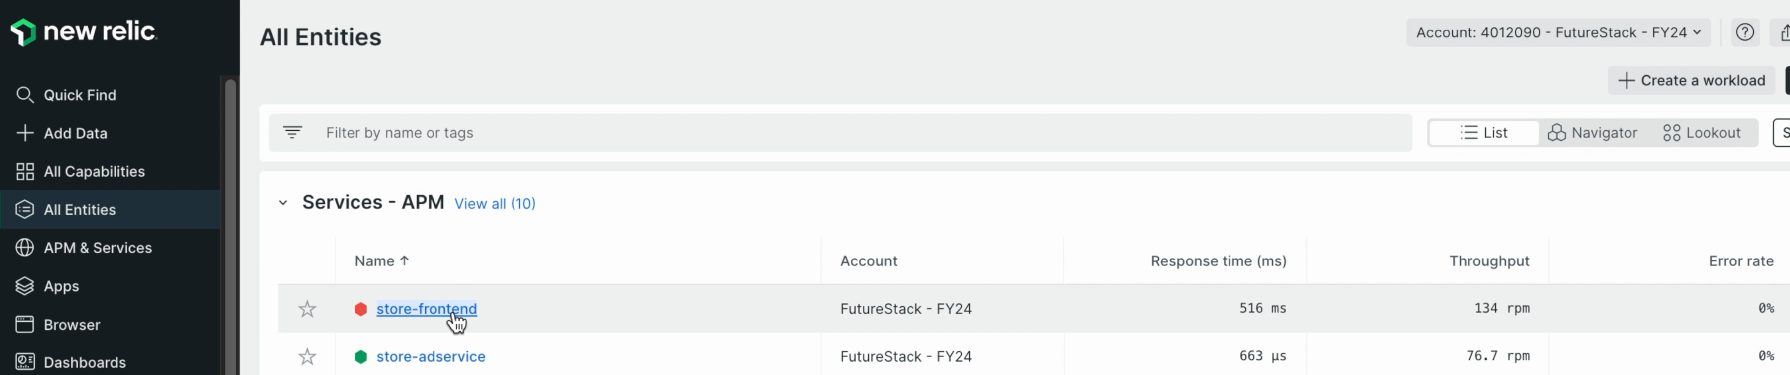
APM - high latency 원인 추적 사례
1) All Entities -> Services-APM -> 점등된 App 선택 -> Summary -> Service Level
-

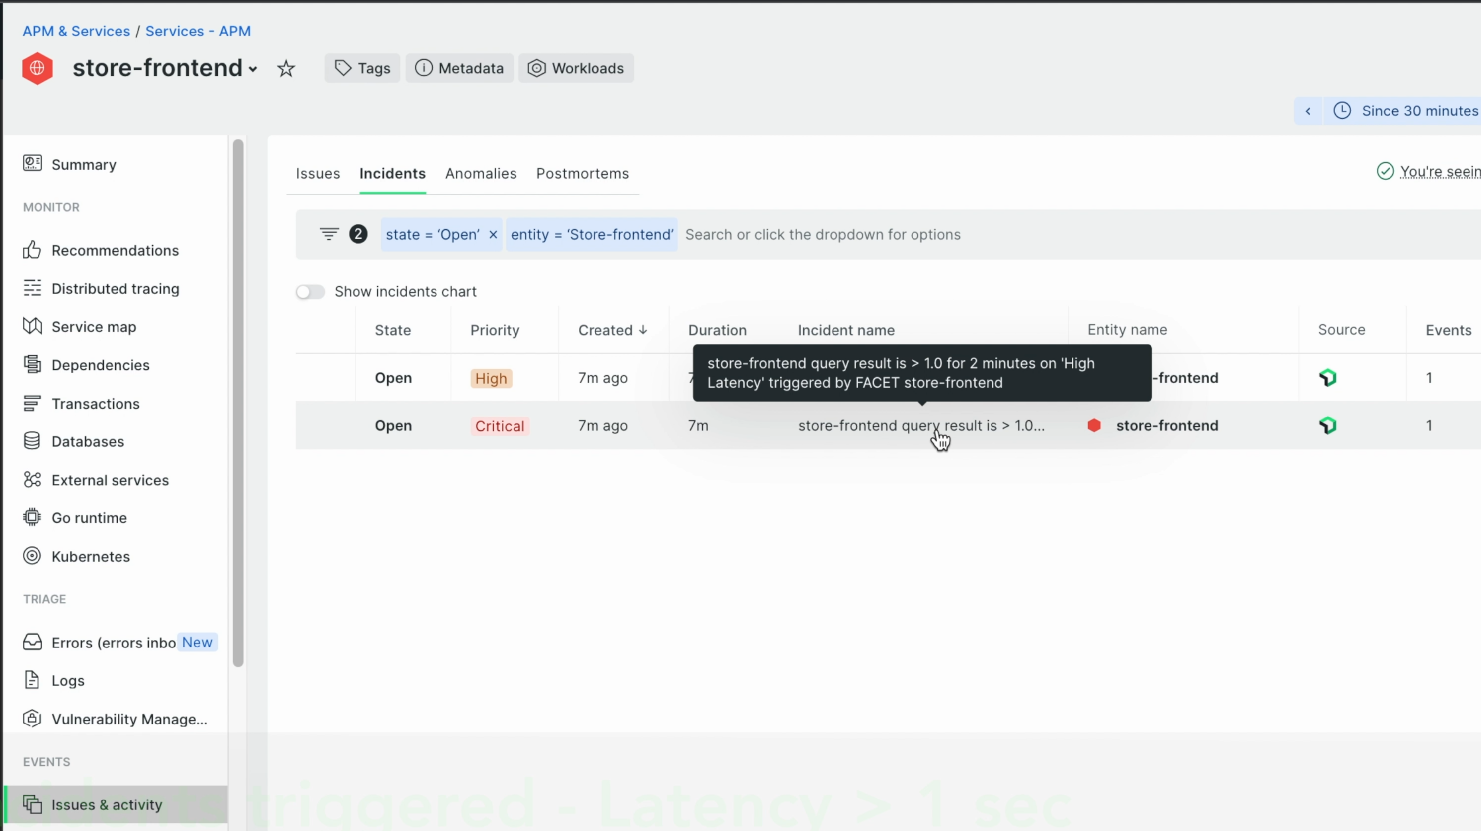
2) APM & Services -> Events -> Issue & Activity -> Incidents -> 트리거된 incident 확인
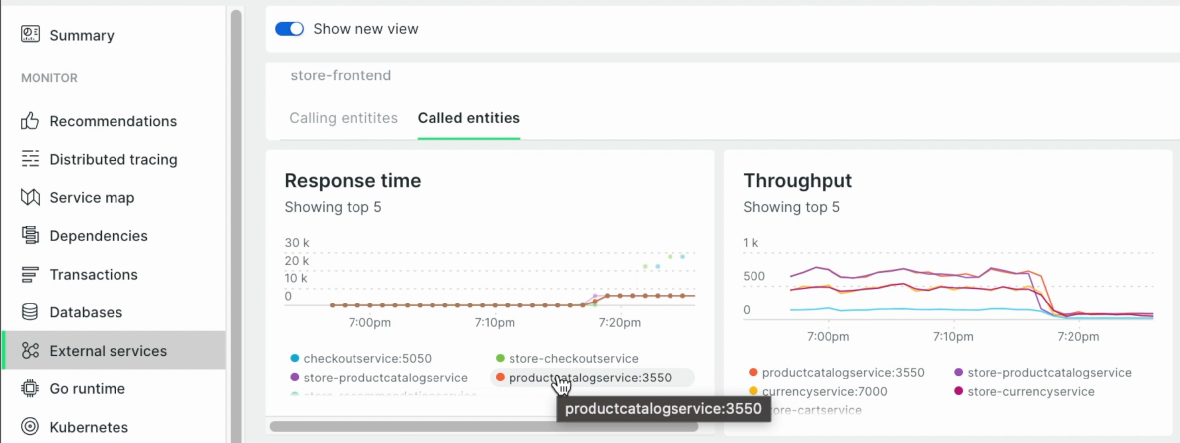
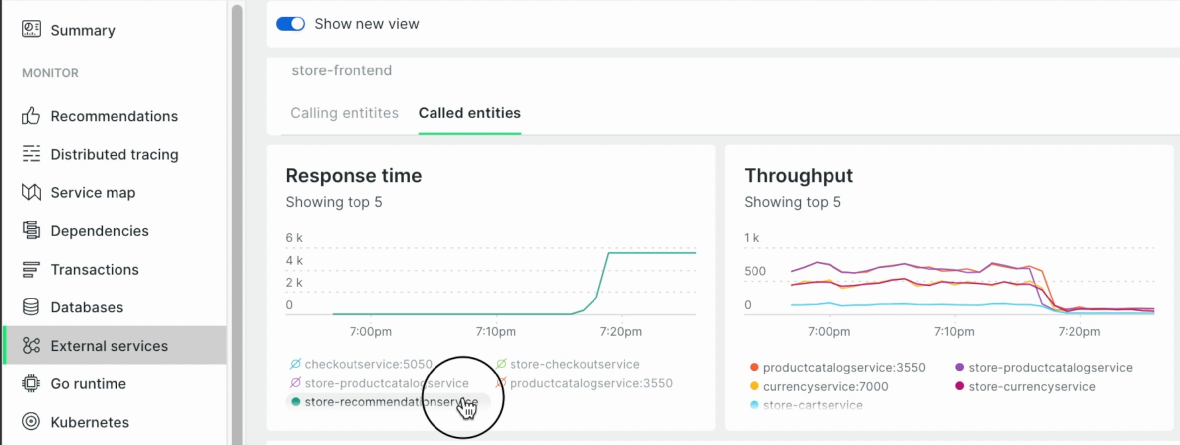
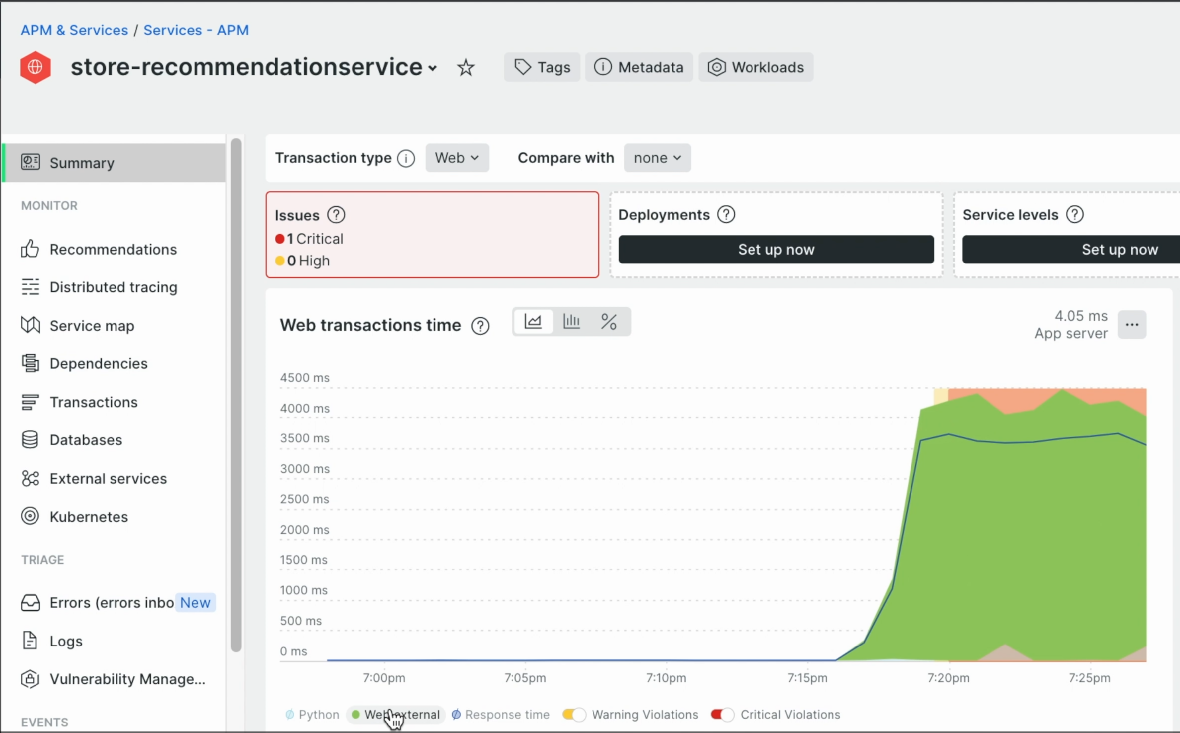
3) APM & Services -> Monitor -> External services -> Called entities -> Response time 차트에서 Latency가 spike 친 App이 있는지 체크
-
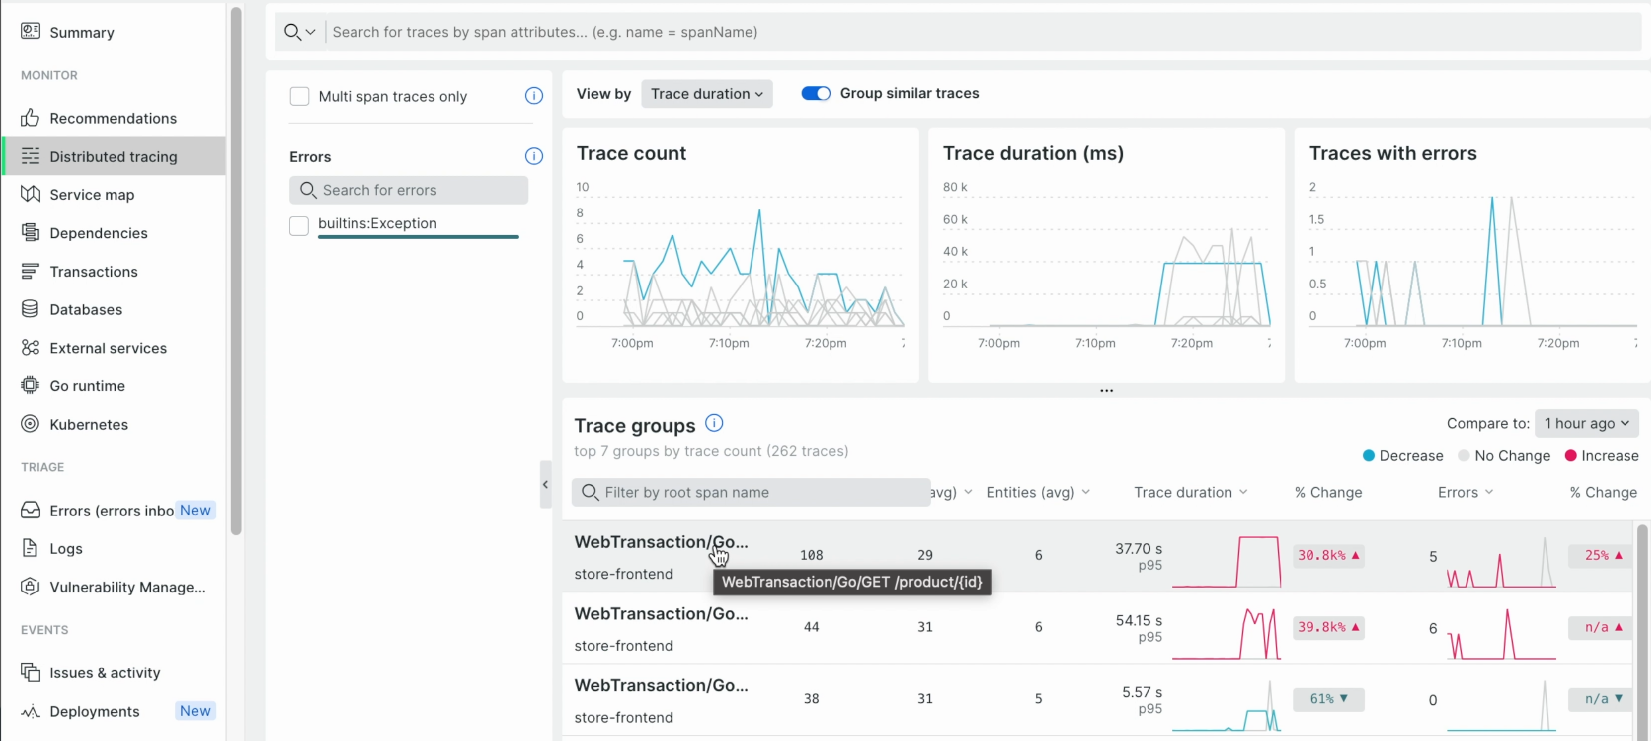
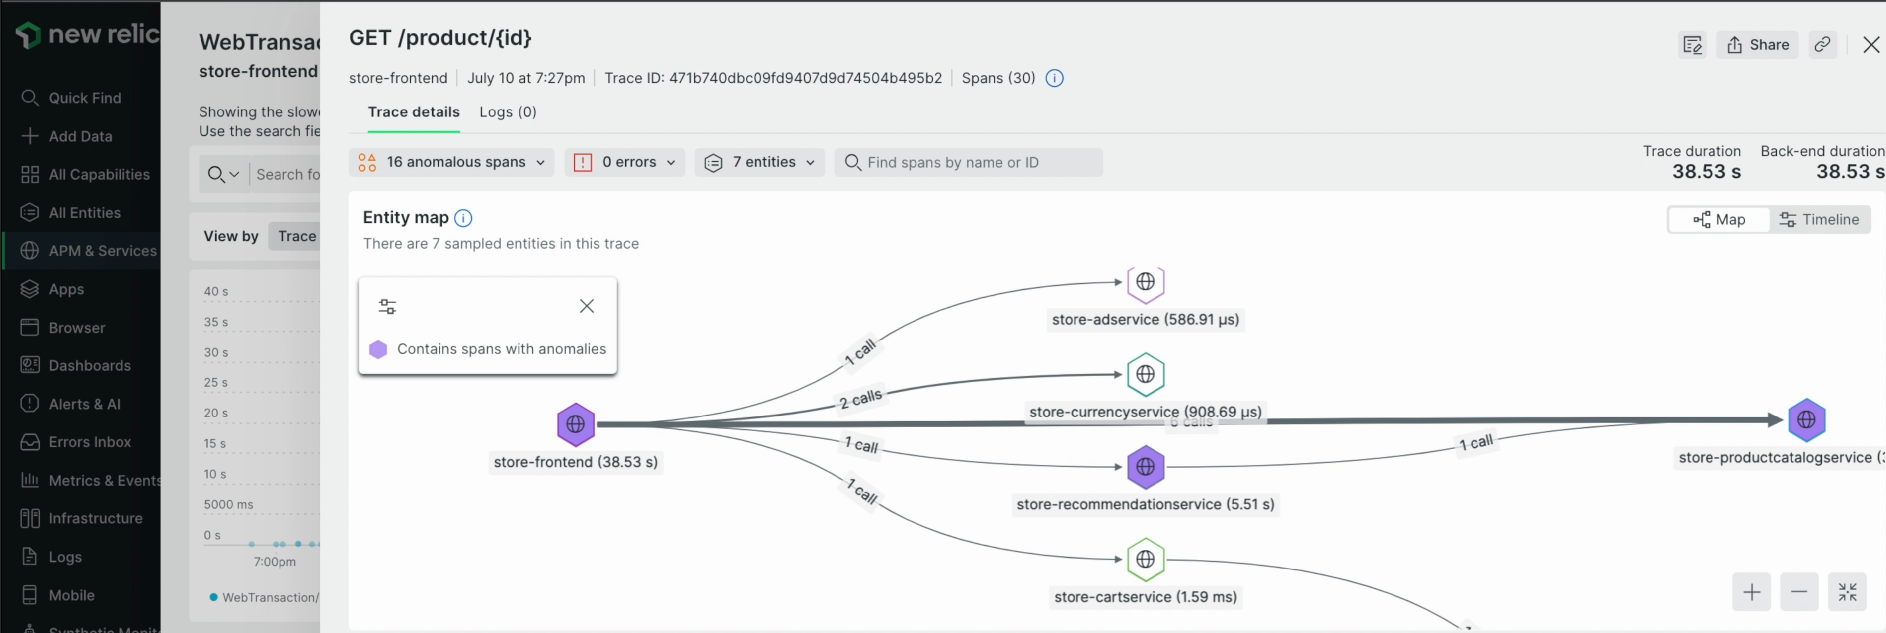
4) APM & Services -> Monitor -> Distributed tracing -> 상위 트랜잭션들의 trace 확인 -> latency 값이 높은 Service 추적
-
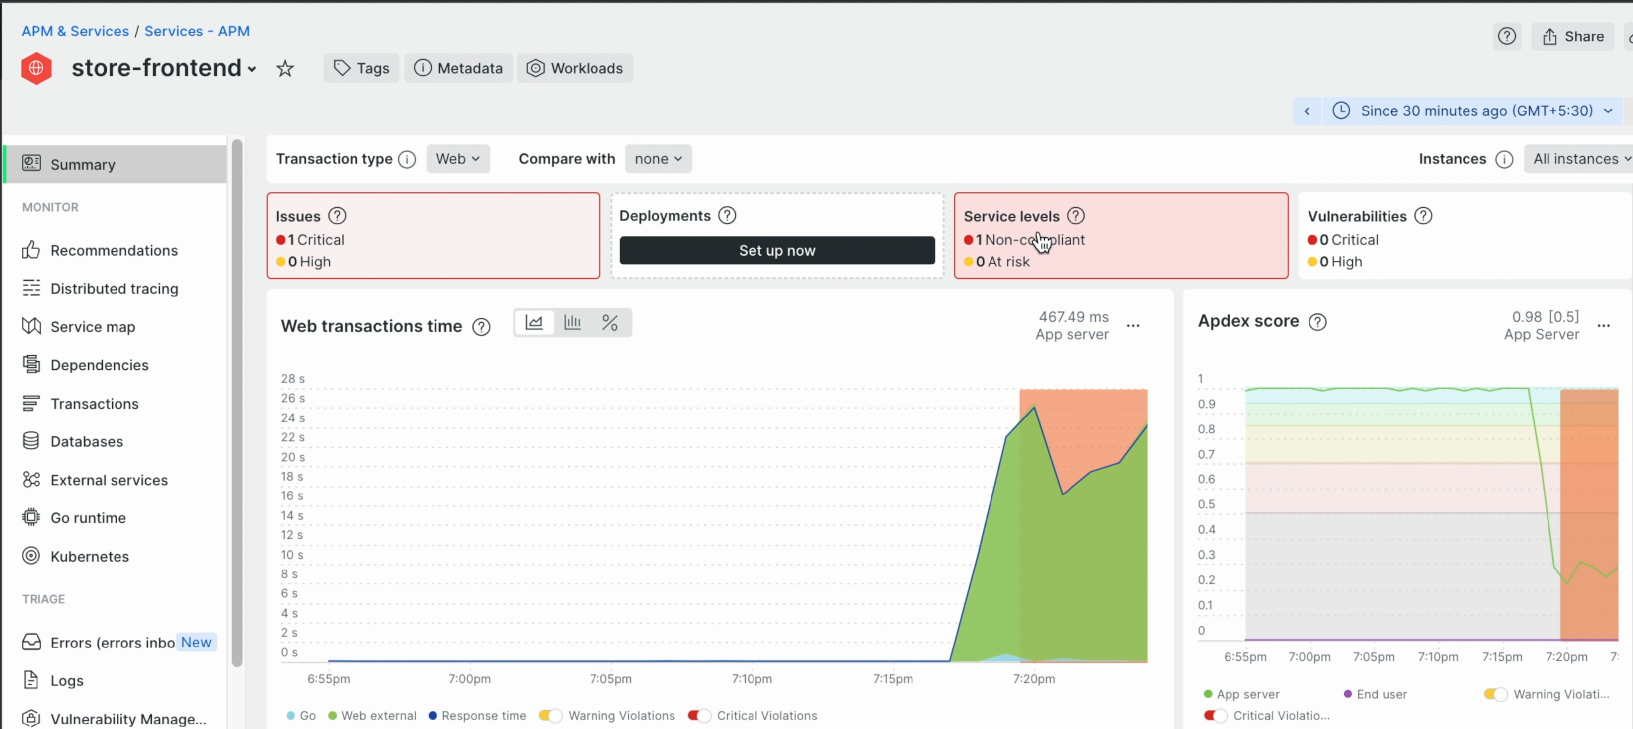
5) APM & Services -> Summary -> Web transactions time -> latency high에 contribution이 가장 높은 segment를 추적
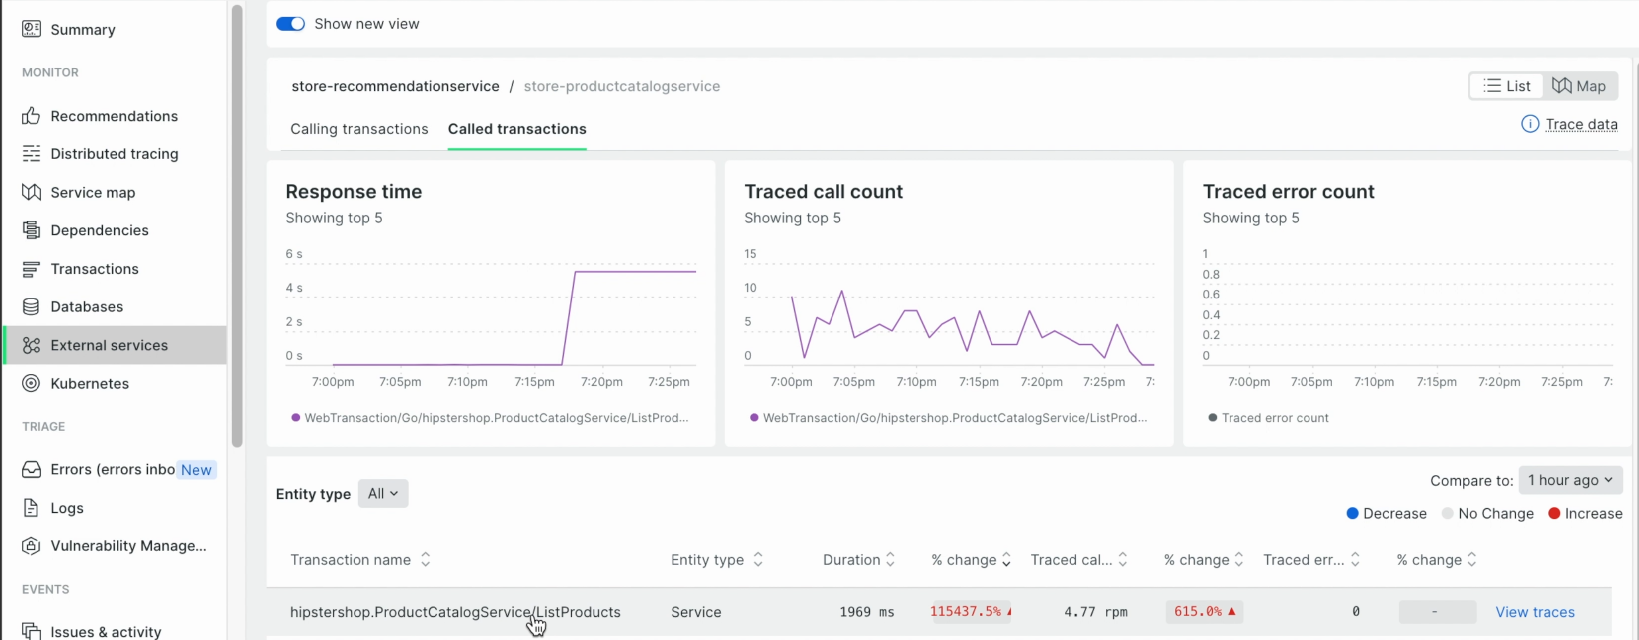
6) APM & Services -> Monitor -> External services -> Called entities -> Response time
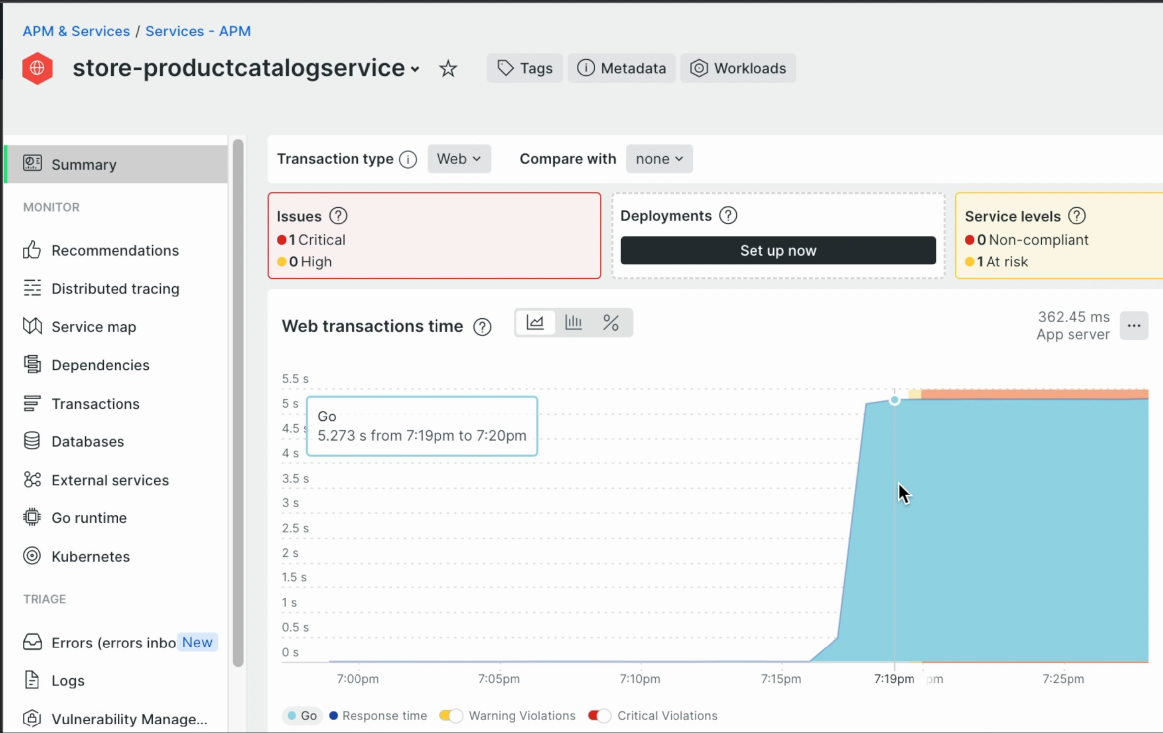
7) APM & Services -> Summary -> Web transactions time -> latency high에 contribution이 가장 높은 segment가 'Go' 임을 확인
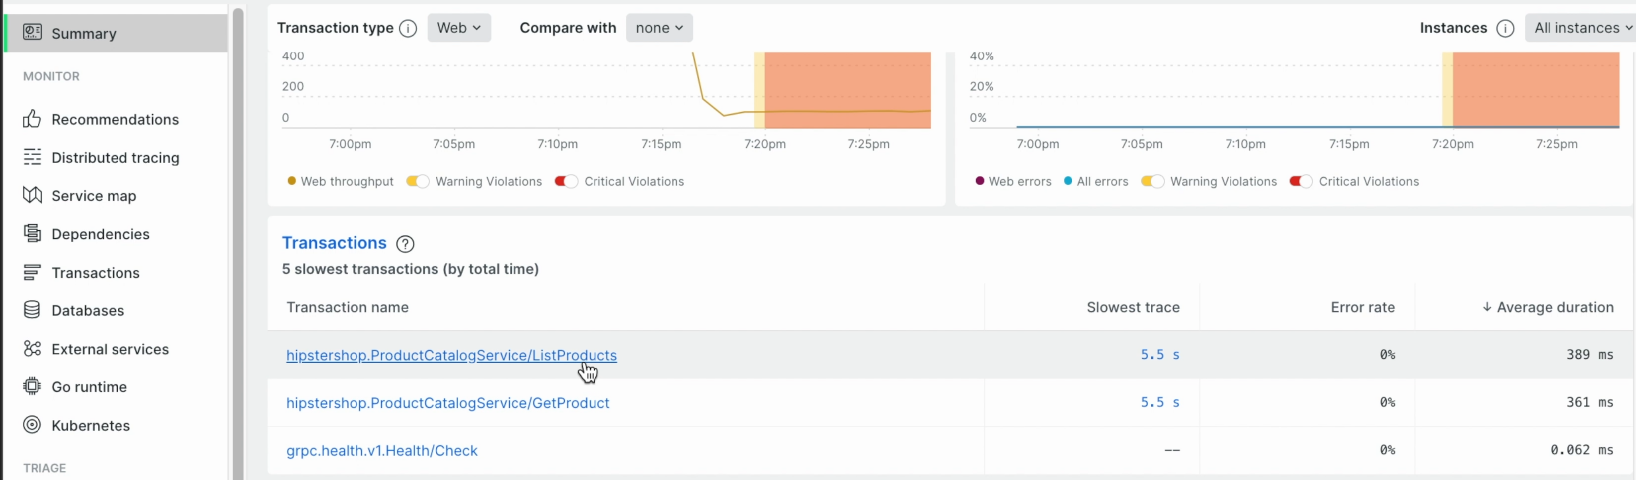
8) APM & Services -> Summary -> Transactions -> high latency에 기여 중인 top 트랜잭션 확인
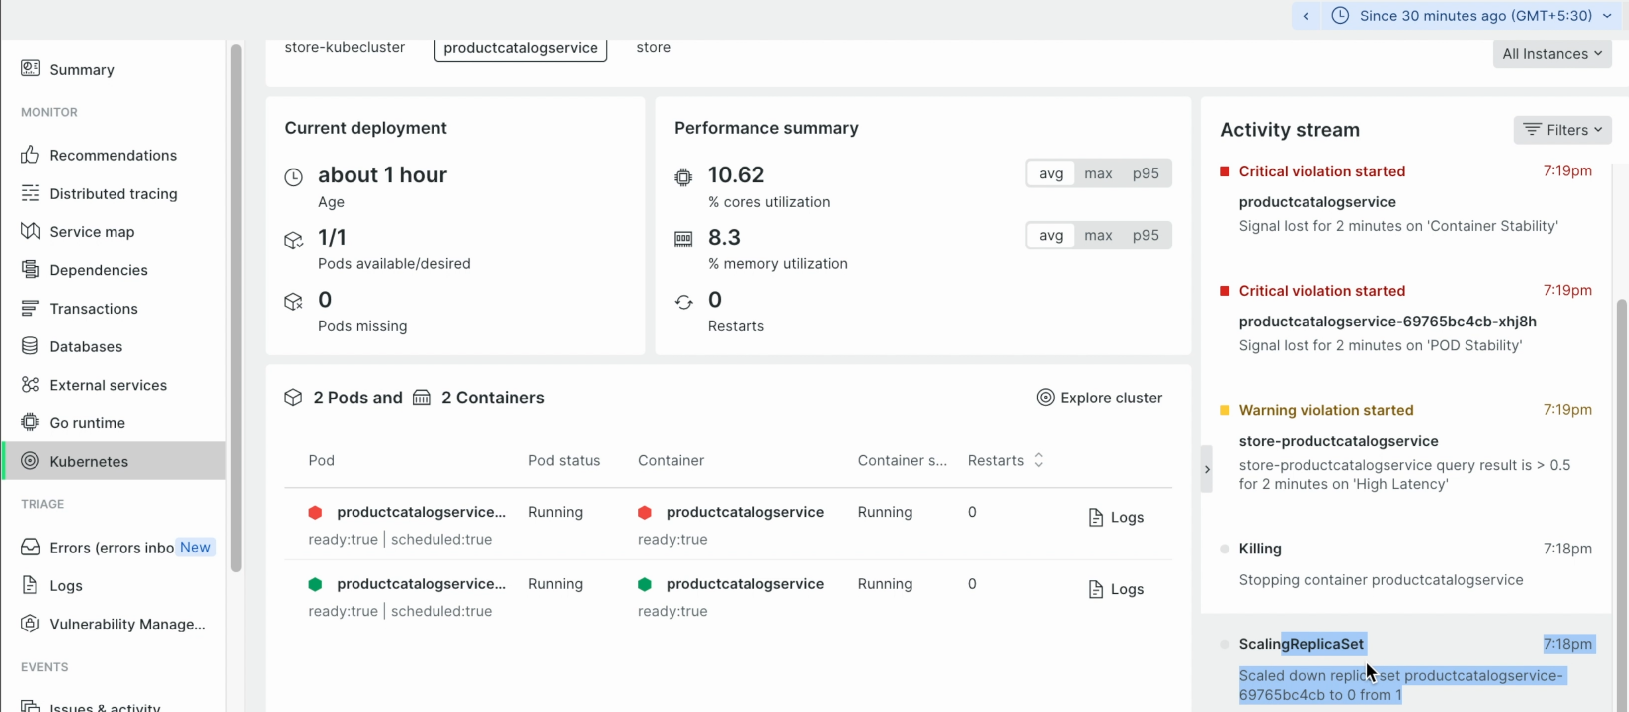
9) APM & Services -> Kubernetes -> Activity stream -> 누적된 event 확인 -> 해당 incident가 발생한 시각에 match되는 event를 확인