240102 Naver Cloud Platform (NCP) 실습 - Prometheus로 메트릭 수집 & Grafana로 메트릭 대쉬보드 생성 from NCP, Oracle Cloud
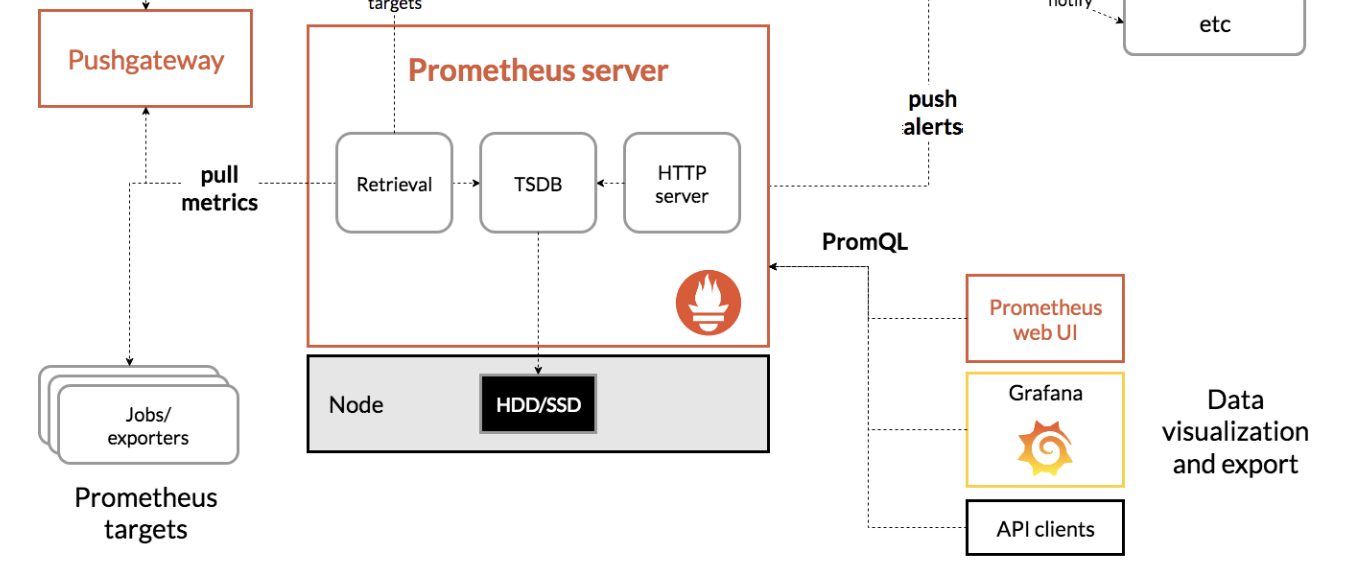
*그림이 짤린 이유는, 원본 아키텍처에는 k8s와의 연동까지 있지만 우리는 인스턴스 직접 열고 단순하게 진행했기 때문에...ㅠㅜ
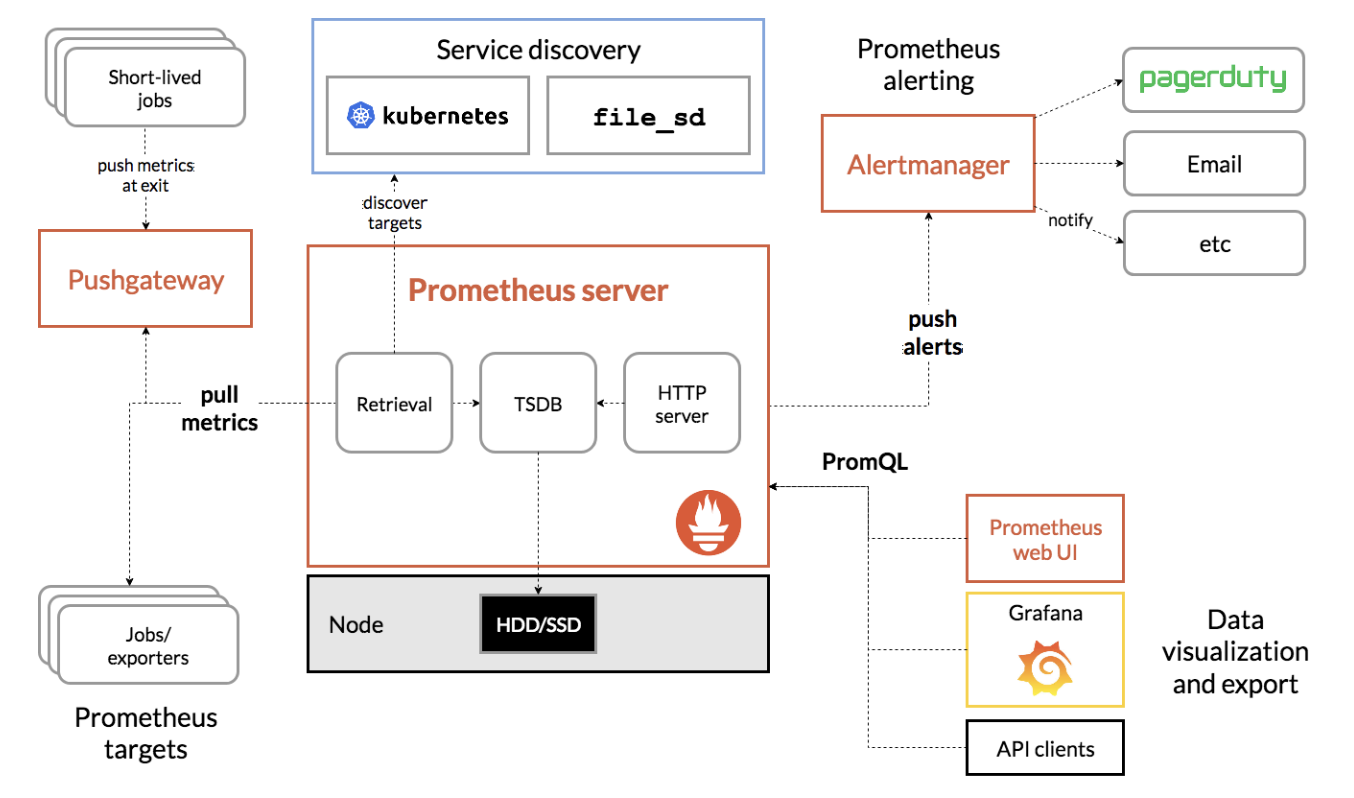
Prometheus
메트릭 기반의 오픈소스 모니터링 시스템
이벤트 모니터링 및 경고에 사용되는 무료 소프트웨어 응용 프로그램이다.
유연한 쿼리(PromQL) 및 실시간 경고가 가능하다.
구조가 간단해서 운영이 쉽고, 강력한 쿼리 기능을 가지고 있으며, 그라파나(Grafana)를 통한 시각화를 지원한다.
Grafana
그라파나는 프로메테우스 등 여러 데이터들을 시각화해주는 모니터링 툴
알람 기능을 무료로 사용할 수 있음
시계열 데이터를 시각화하기 위한 대시보드 제공
여러 데이터 소스들을 시각화할 수 있음
키바나와 호환성이 높음
준비물
1.NCP 퍼블릭 서브넷에 위치한 서버 (이하 1서버)
2.NCP 프라이빗 서브넷에 위치한 서버 (이하 2서버)
3.2서버의 외부통신 (for Prometheus-Node 설치)을 위한 NAT Gateway
4.Oracle Cloud에 위치한 퍼블릭 서버 (이하 3서버)
- 3서버의 경우, 이번 실습에서는 강사님이 프로비저닝해줬으며 이번 실습에서는 Prometheus-Node 설치만 진행함.
시나리오
1. 1서버에 Prometheus를 설치
2. 2서버, 3서버에 Prometheus-Node를 설치 & Firewalld 해제, SELinux를 disable
3. 1서버의 prometheus.yaml에서 메트릭 수집 대상인 타겟 (2,3서버) 등록 & Prometheus에서 메트릭 수집 확인
4. Grafana를 이용, Prometheus 메트릭을 시각화 (=Dashboard) 함.
1. 1서버에 Prometheus를 설치
1서버에 prometheus를 설치해주고, sysctl에 등록해준다.
추가적으로, ACG (aws로 치면 보안그룹)에서 9090번 포트에 대한 0.0.0.0/0 의 접근을 허용해야 한다. 이는 Prometheus가 사용하는 포트.
# 소스 파일 관리
mkdir /tmp/prometheus
cd /tmp/prometheus

# 프로메테우스 다운로드
wget https://github.com/prometheus/prometheus/releases/download/v2.43.0/prometheus-2.43.0.linux-amd64.tar.gz

# 프로메테우스 압축 해제
tar -zvxf prometheus-2.43.0.linux-amd64.tar.gz

# sysctl 에 등록
sudo vim /etc/systemd/system/prometheus.service

# 내용 추가

[Unit]
Description=Prometheus
After=network.target

[Service]
ExecStart=/tmp/prometheus/prometheus-2.43.0.linux-amd64/prometheus --config.file /tmp/prometheus/prometheus-2.43.0.linux-amd64/prometheus.yml
Restart=always
StartLimitBurst=0
Restart=on-failure

[Install]
WantedBy=default.target


# sysctl 서비스 등록

sudo systemctl daemon-reload
sudo systemctl enable prometheus
sudo systemctl start prometheus

# 프로메테우스 동작 확인

sudo systemctl status prometheus
터미널에서 할 작업은 위와 같고, 추가적으로 #내용 추가는 gpt를 통해 설명을 보충한다.
[Unit]: 이 섹션은 유닛에 대한 메타데이터와 종속성을 정의합니다.
Description=Prometheus: 유닛에 대한 사람이 읽을 수 있는 설명으로, 여기서는 "Prometheus"로 설정되어 있습니다.
After=network.target: Prometheus 서비스가 네트워크가 활성화된 후에 시작되도록 지정합니다. 이는 Prometheus에서 필요한 네트워크 리소스가 사용 가능한 상태여야 함을 보장하기 위한 것입니다.
[Service]: 이 섹션은 서비스에 대한 구성을 정의합니다.
ExecStart=/tmp/prometheus/prometheus-2.43.0.linux-amd64/prometheus --config.file /tmp/prometheus/prometheus-2.43.0.linux-amd64/prometheus.yml: 서비스를 시작하는 명령을 지정합니다. 여기서는 Prometheus 실행 파일과 설정 파일의 경로를 명시하고 있습니다.
Restart=always: 서비스가 실패하면 항상 재시작하도록 지정합니다.
StartLimitBurst=0: 재시작 횟수 제한을 설정합니다. 여기서는 무제한으로 설정되어 있습니다.
Restart=on-failure: 서비스가 실패한 경우에만 재시작하도록 지정합니다.
[Install]: 이 섹션은 유닛이 어떤 타겟에 속하는지를 정의합니다.
WantedBy=default.target: 유닛을 기본 타겟에 속하도록 지정합니다. 여기서는 default.target에 속하도록 설정되어 있습니다.
2. 2서버, 3서버에 Prometheus-Node를 설치 & Firewalld 해제, SELinux를 disable
2서버, 3서버의 ACG의 Inbound 정책에 Prometheus 메트릭 수집 요청을 수신하기 위해 9090포트를 열어줘야 한다.
또한, Node_exporter는 9100 port를 Prometheus는 9090 port를 사용하므로 반드시 해제해줘야 노드간 통신이 가능하다.
#firewalld 관련
# stop service
[root@localhost ~]# systemctl stop firewalld
# disable service
[root@localhost ~]# systemctl disable firewalld

#SELinux 관련
[root@localhost ~]# vi /etc/selinux/config
# This file controls the state of SELinux on the system.
# SELINUX= can take one of these three values:
#     enforcing - SELinux security policy is enforced.
#     permissive - SELinux prints warnings instead of enforcing.
#     disabled - No SELinux policy is loaded.
SELINUX=disabled   # disabled 로 변경
# SELINUXTYPE= can take one of these two values:
#     targeted - Targeted processes are protected,
#     minimum - Modification of targeted policy. Only selected processes are protected.
#     mls - Multi Level Security protection.
SELINUXTYPE=targeted

# 재부팅해서 설정을 유효화 해야한다
[root@localhost ~]# reboot
이후 각 서버에 접속하여 메트릭 수집 에이전트 역할을 하는 Prometheus-Node 설치
# 소스 파일 관리
mkdir /tmp/prometheus-node
cd /tmp/prometheus-node


# 프로메테우스 node-exporter 설치
wget https://github.com/prometheus/node_exporter/releases/download/v1.5.0/node_exporter-1.5.0.linux-amd64.tar.gz


# 압축해제
tar -zvxf node_exporter-1.5.0.linux-amd64.tar.gz


# sysctl 에 등록
sudo vim /etc/systemd/system/prometheus-node.service

# 내용 추가

[Unit]
Description=Prometheus-node
After=network.target

[Service]
ExecStart=/tmp/prometheus-node/node_exporter-1.5.0.linux-amd64/node_exporter
Restart=always
StartLimitBurst=0
Restart=on-failure

[Install]
WantedBy=default.target


# sysctl 서비스 등록

sudo systemctl daemon-reload
sudo systemctl enable prometheus-node
sudo systemctl start prometheus-node

# 프로메테우스 동작 확인

sudo systemctl status prometheus-node
3. 1서버의 prometheus.yaml에서 메트릭 수집 대상인 타겟 (2,3서버) 등록 & Prometheus에서 메트릭 수집 확인
# 설정 값 수정

cd /tmp/prometheus/prometheus-2.43.0.linux-amd64
vim prometheus.yml

# 설정 값 하기 수정

# my global config
global:
  scrape_interval: 15s # Set the scrape interval to every 15 seconds. Default is every 1 minute.
  evaluation_interval: 15s # Evaluate rules every 15 seconds. The default is every 1 minute.
  # scrape_timeout is set to the global default (10s).

# Alertmanager configuration
alerting:
  alertmanagers:
    - static_configs:
        - targets:
          # - alertmanager:9093

# Load rules once and periodically evaluate them according to the global 'evaluation_interval'.
rule_files:
  # - "first_rules.yml"
  # - "second_rules.yml"

# A scrape configuration containing exactly one endpoint to scrape:
# Here it's Prometheus itself.
scrape_configs:
  # The job name is added as a label `job=<job_name>` to any timeseries scraped from this config.
  - job_name: 'prometheus'
    static_configs:
      - targets: ['localhost:9090']

  - job_name: 'node_exporter'
    scrape_interval: 1s
    static_configs:
      - targets: ['10.105.10.6:9100']

  - job_name: 'oci_exporter'
    scrape_interval: 1s
    static_configs:
      - targets: ['OCI서버 공인IP:9100']

# 프로메테우스 재시작
sudo systemctl restart prometheus-node
여기서, job_name : 들이 메트릭을 수집할 대상들이다.
차례대로 prometheus - 1서버, node_exporter - 2서버, oci_exporter - 3서버 순이다.
이후 'http://1서버공인IP:9090/targets' 로 접속했을 때 아래와 같은 결과를 얻었다.
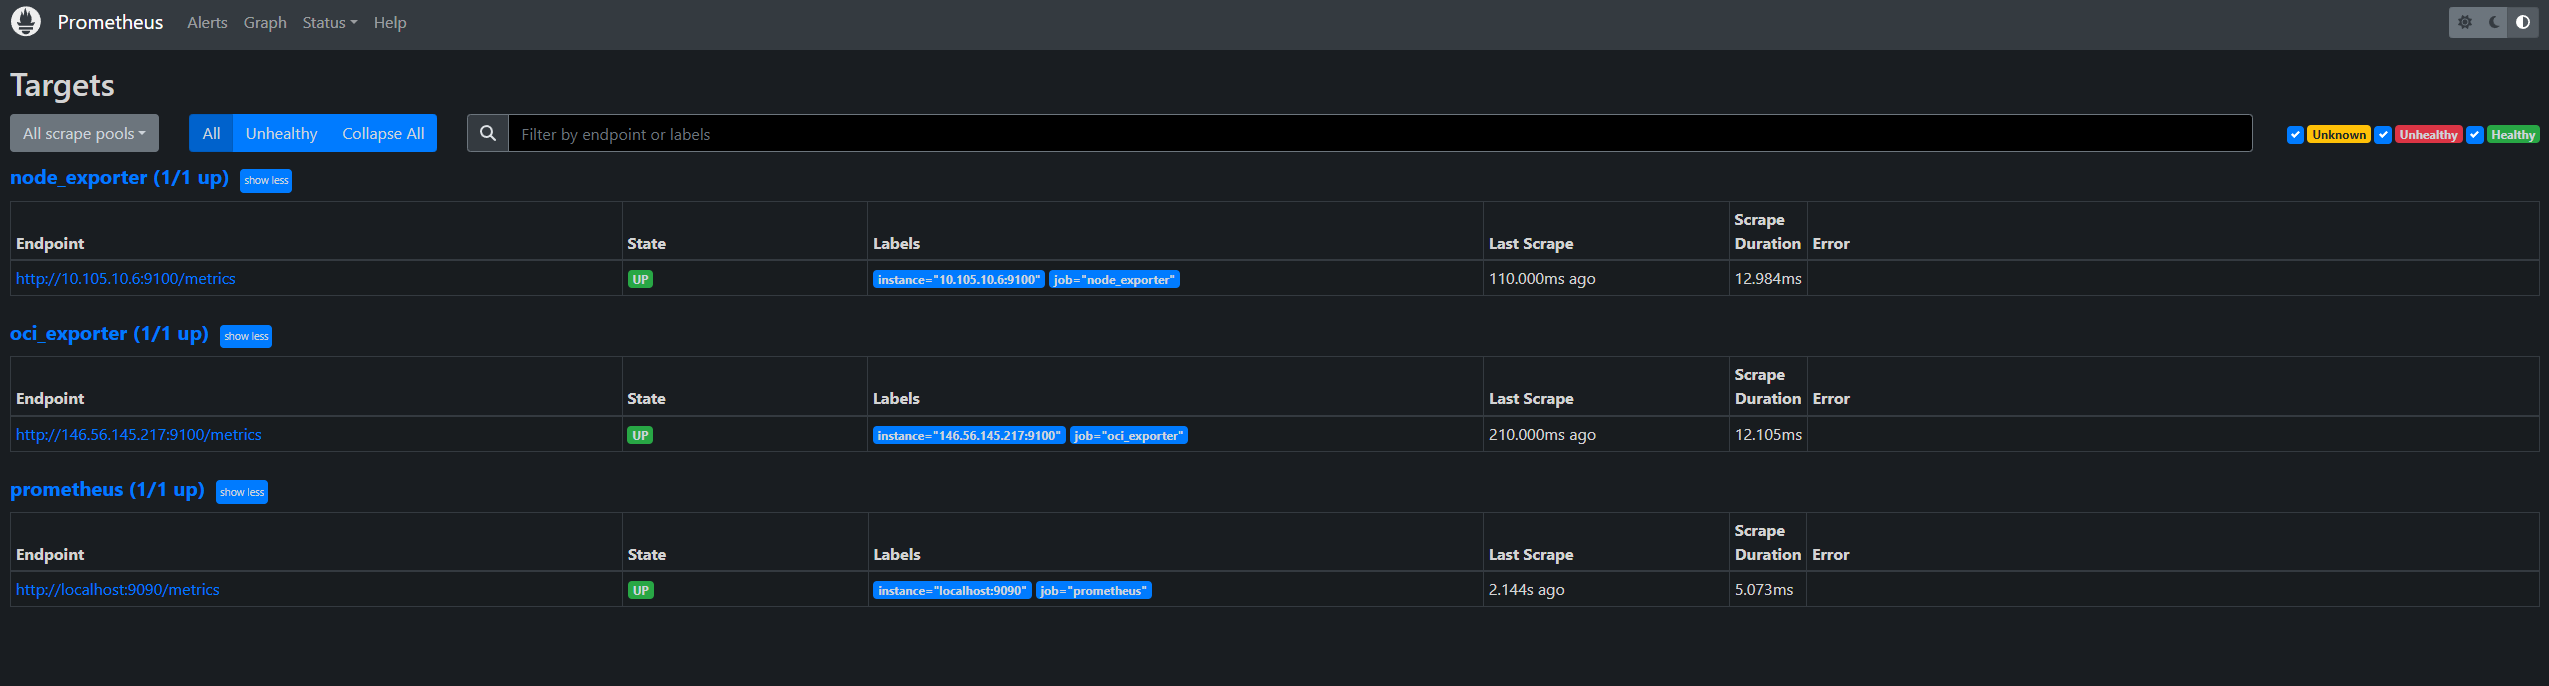
up 으로 뜬건, 2서버와 3서버가 1서버로 메트릭을 주고받는 상태가 완료됨을 뜻한다.
4. Grafana를 이용, Prometheus 메트릭을 시각화 (=Dashboard) 함.
1서버의 ACG의 Inbound 정책에 Grafana를 위해 1860포트를 열어줘야 한다.
mkdir /tmp/grafana
cd /tmp/grafana

# Grafana 설치
sudo yum install -y https://dl.grafana.com/enterprise/release/grafana-enterprise-10.2.3-1.x86_64.rpm

# Grafana 실행
systemctl start grafana-server.service
systemctl enable grafana-server.service
이후 Grafana 접속 ('http://공인IP:1860')후 Dashboard 활성화시켜준다.
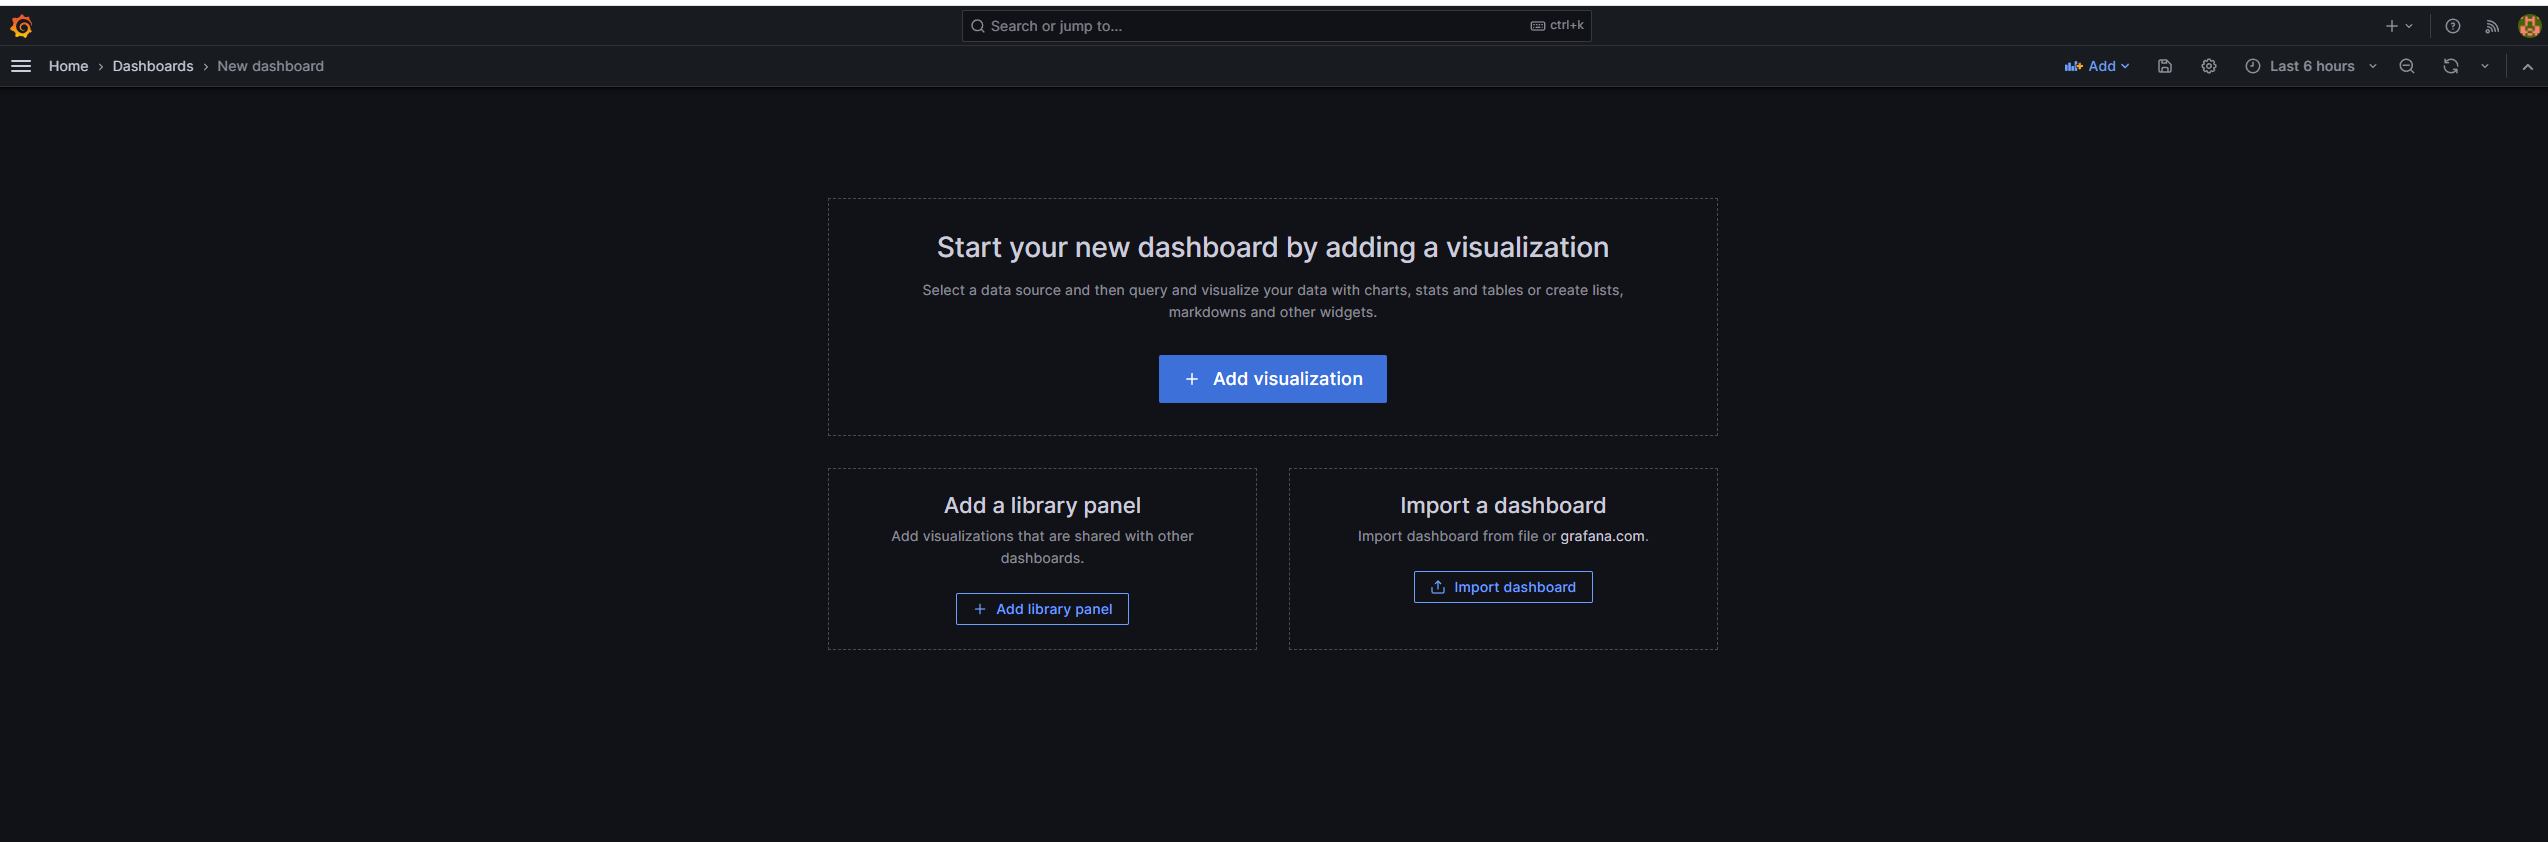
Import dashboard -> Prometheus 연동.
결과는
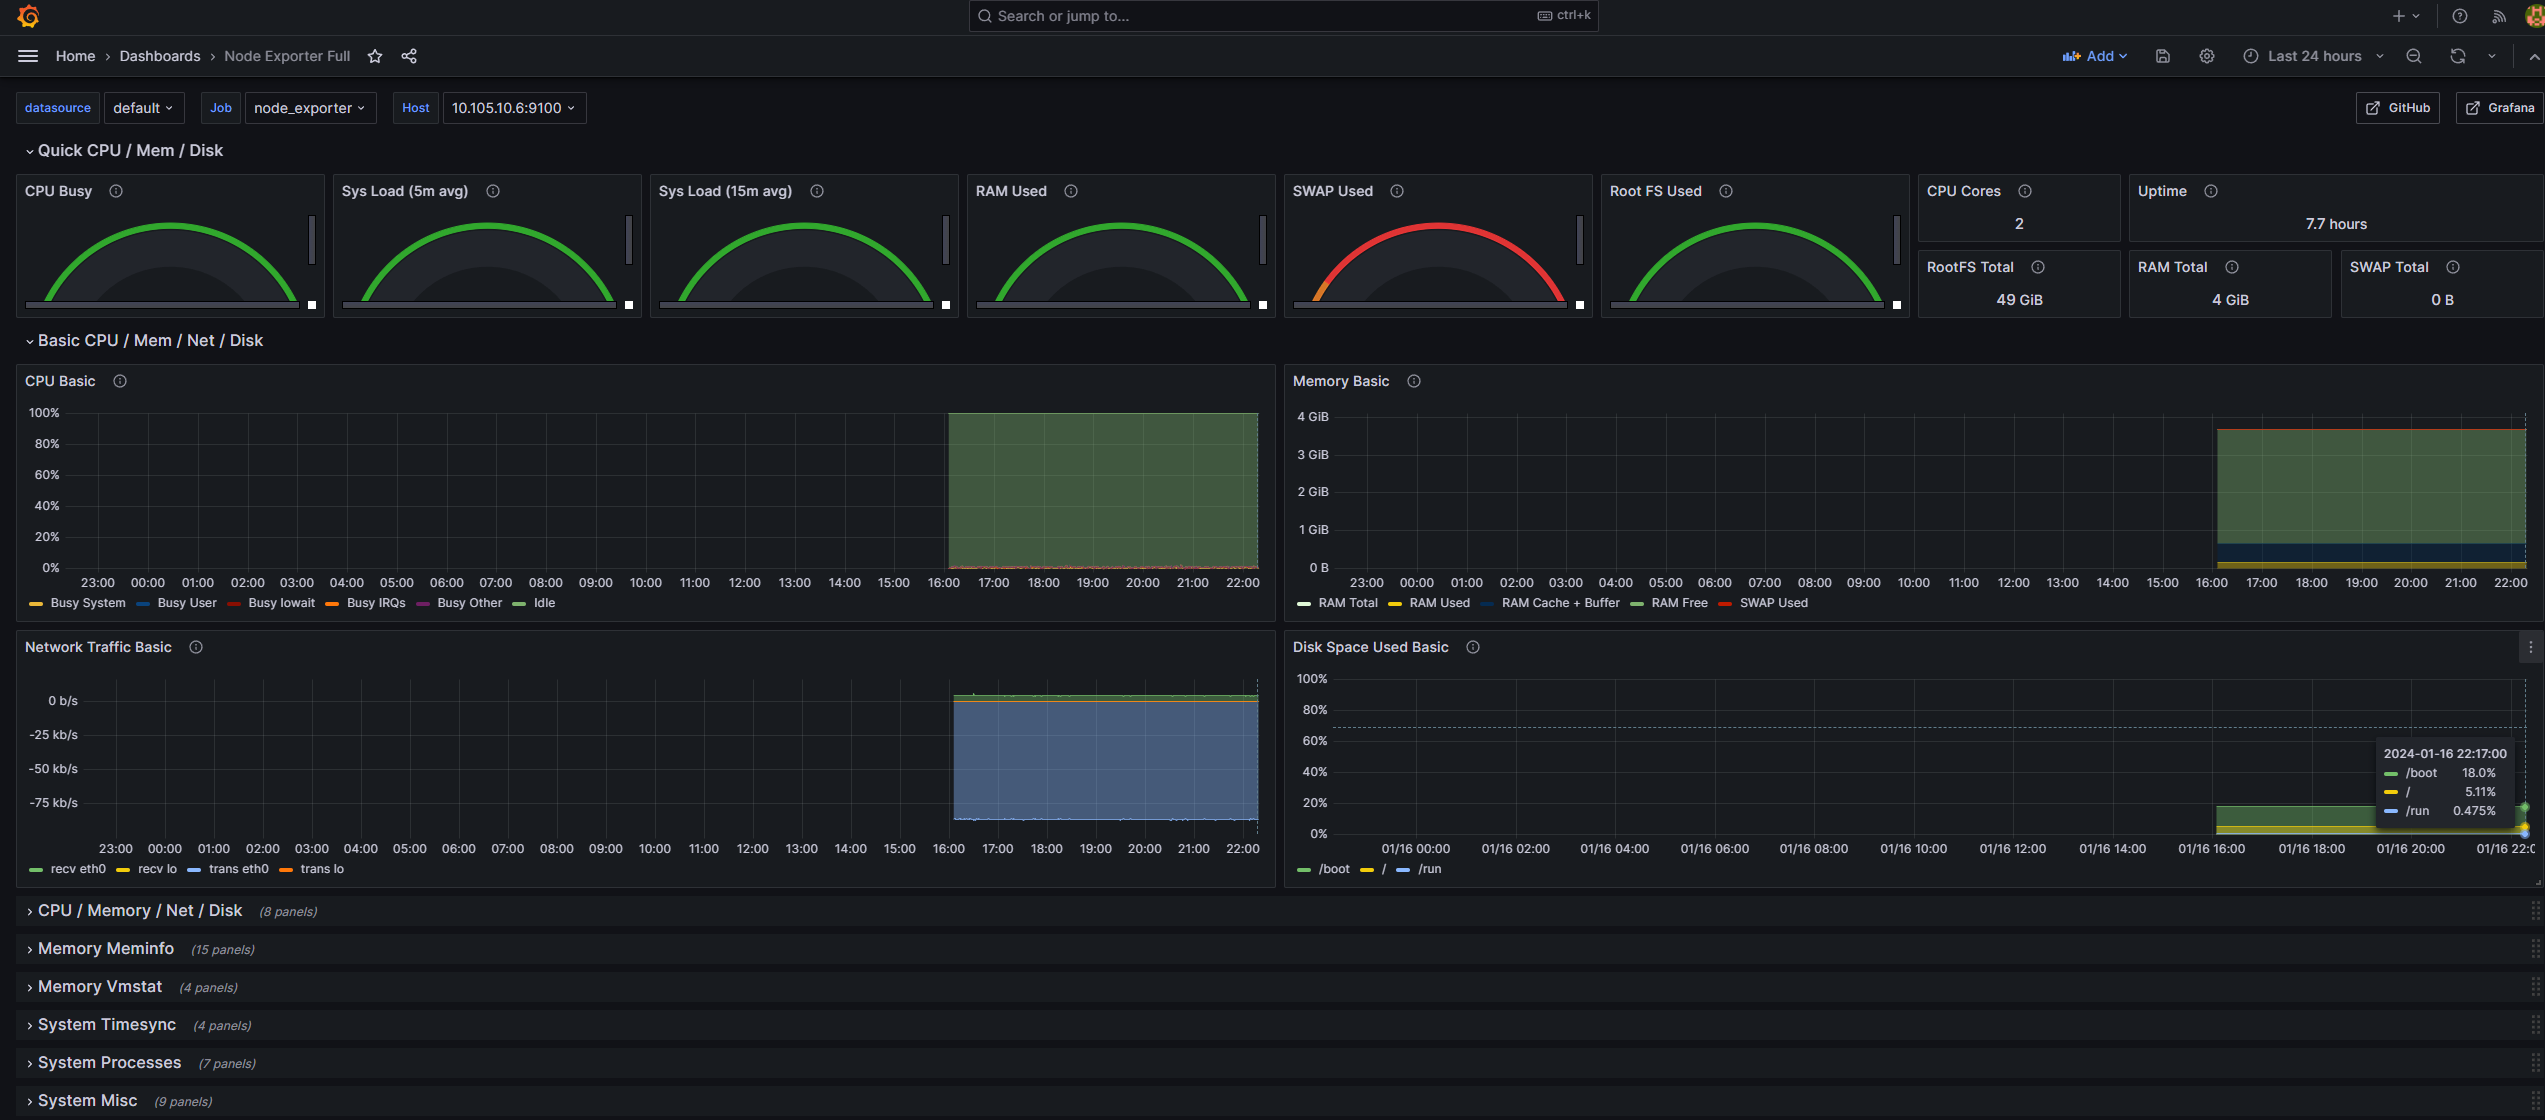
Success

안녕하세요, 네이버 클라우드 플랫폼입니다.
네이버클라우드의 기술 콘텐츠 리워드 프로그램 '이달의 Nclouder(1월)' 도전자로 초대합니다 :)
네이버 클라우드 플랫폼 서비스와 관련된 모든 주제로 2/1(목) 23시까지 신청 가능합니다. (*1월 작성 콘텐츠 한정 신청 가능)
Ncloud 크레딧을 포함한 다양한 리워드가 준비되어 있으니 많은 관심 부탁드립니다!
자세한 내용은 아래 링크에서 확인부탁드립니다.
https://blog.naver.com/n_cloudplatform/223315900468
신청 링크
https://navercloud.typeform.com/to/lF8NUaCF