[기본 숙제]
p.134의 손코딩(맷플롯립에서 bar()함수로 막대 그래프 그리기)을 코랩에서 그래프 출력하고 화면 캡쳐하기
code
import gdown
gdown.download('https://bit.ly/3pK7iuu', 'ns_book7.csv', quiet=False)

import pandas as pd
ns_book7 = pd.read_csv('ns_book7.csv', low_memory=False)
ns_book7.head()

import numpy as np
def kdc_1st_char(no):
    if no is np.nan:
        return '-1'
    else:
        return no[0]
count_by_subject = ns_book7['주제분류번호'].apply(kdc_1st_char).value_counts()
count_by_subject

import matplotlib.pyplot as plt

plt.bar(count_by_subject.index, count_by_subject.values)
plt.title('Books by subject')
plt.xlabel('subject')
plt.ylabel('number of books')
for idx, val in count_by_subject.items():
    plt.annotate(val, (idx, val), xytext=(0, 2), textcoords='offset points')
plt.show()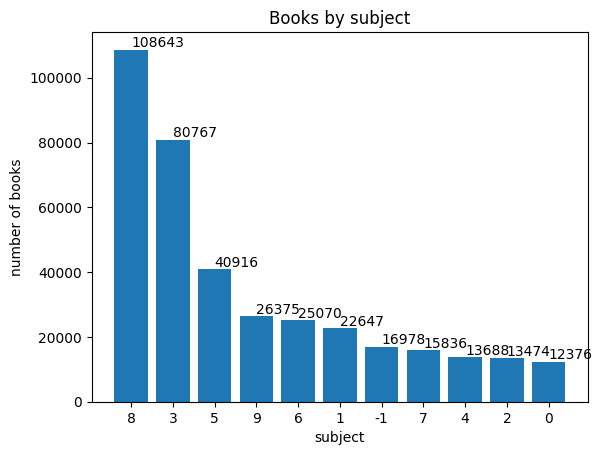
[추가 숙제]
p.316의 손코딩(텍스트 정렬, 막대 조절 및 색상 바꾸기)을 코랩에서 출력하고 화면 캡처하기
code
plt.bar(count_by_subject.index, count_by_subject.values, width=0.7, color='blue')
plt.title('Books by subject')
plt.xlabel('subject')
plt.ylabel('number of books')
for idx, val in count_by_subject.items():
    plt.annotate(val, (idx, val), xytext=(0, 2), textcoords='offset points',
                 fontsize=8, ha='center', color='green')
plt.show()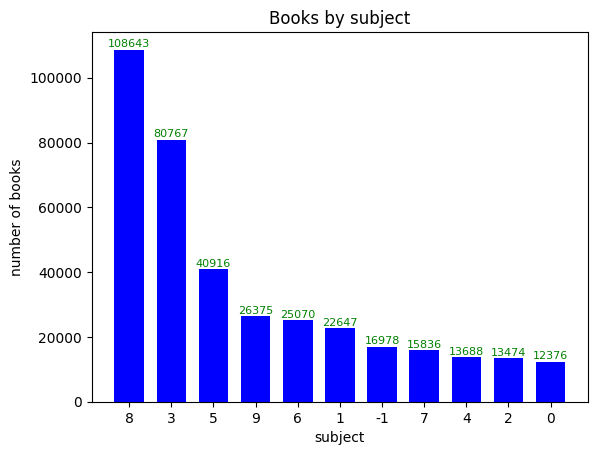

42 Gyeongsan Learner