Prometheus 와 grafana를 사용하여 모니터링 환경 구축하기 (monolithic 환경)
Prometheus 특징
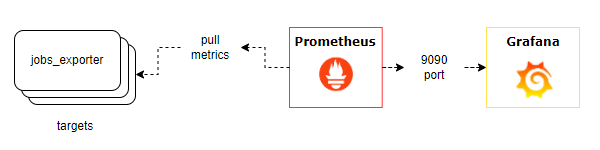
Prometheus는 시스템 및 서비스 모니터링을 위해 설계된 오픈 소스 소프트웨어이다. 주로 시계열 데이터를 수집하고 처리하는 데 사용되며, Cloud Native Computing Foundation (CNCF)의 일부로써, 메트릭 기반의 모니터링 시스템을 구축하는데 사용되는 모니터링 도구이다.
프로메테우스의 기본 개념
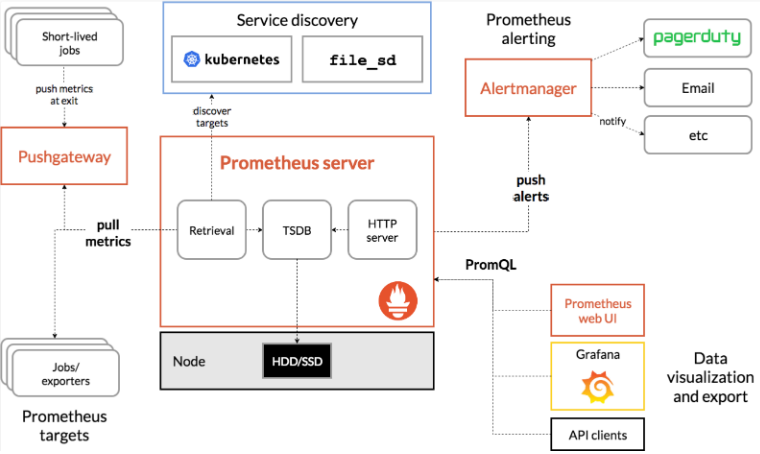
- PromQL : 프로메테우스에 저장된 데이터를 상세하게 조회하고 분석할 수 있는 쿼리 언어이다.
- Alertmanager : prometheus 에서 수집된 metric을 기반으로 이상 상황을 탐지하고 알림을 발송한다.
- pull 기반 스크랩 : 정해진 간격으로 타겟의 metric을 주기적으로 "pull"하여 수집한다.
- Exporter : 타겟의 metric을 수집하여 prometheus가 pulling 할 수 있도록 노출시키는 agent이다.
설치 구성
공식문서 구성
프로메테우스 : 9090 포트
그라파나 : 3000 포트
node_exporter : 9100 포트
mysqld_exporter : 9104 포트
apache_exporter : 9117 포트
tomcat_exporter : 9402 포트
Prometheus 설치
1. Prometheus 바이너리 설치
Prometheus Download: https://prometheus.io/download/
# wget https://github.com/prometheus/prometheus/releases/download/v2.45.0/prometheus-2.45.0.linux-amd64.tar.gz

압축 해제 후 prometheus 로 폴더 명 변경
/data/prometheus/prometheus
2. 시스템 서비스 등록
# vi /etc/systemd/system/prometheus.service

[Unit]
Description=Prometheus Server
Documentation=https://prometheus.io/docs/introduction/overview/
After=network-online.target
[Service]
User=root
Restart=on-failure
ExecStart=/data/prometheus/prometheus \
  --config.file=/data/prometheus/prometheus.yml \
  --storage.tsdb.path=/data/prometheus/data
[Install]
WantedBy=multi-user.target
하기 경로에도 가능
vi /usr/lib/systemd/system/3. 서비스 등록/실행
# systemctl daemon-reload
# systemctl start prometheus
# systemctl enable promethues
# systemctl status prometheus
# netstat -tnlp
Active Internet connections (only servers)
Proto Recv-Q Send-Q Local Address Foreign Address State PID/Program name
tcp 0 0 0.0.0.0:22 0.0.0.0:* LISTEN 1060/sshd
tcp 0 0 0.0.0.0:10050 0.0.0.0:* LISTEN 8574/zabbix_agentd
tcp6 0 0 :::80 :::* LISTEN 5002/httpd
tcp6 0 0 :::22 :::* LISTEN 1060/sshd
tcp6 0 0 :::443 :::* LISTEN 5002/httpd
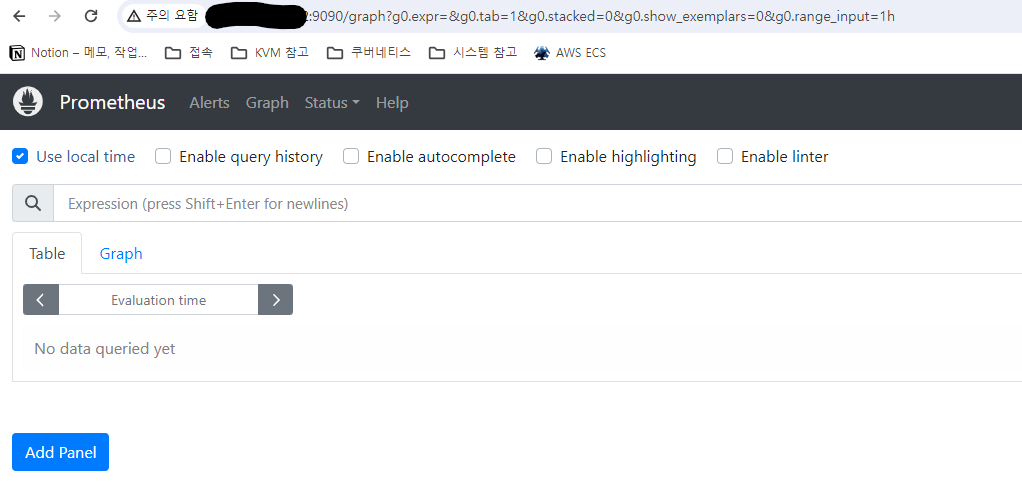
tcp6 0 0 :::9090 :::* LISTEN 11627/prometheusPrometheus의 기폰 포트 9090으로 WEB 접속하여 정상 실행 확인
상단 Status -> Tagets 탭에서 상태 정보 확인 가능
grafana 설치
Grafana Download: https://grafana.com/grafana/download
1. grafana 패키지 설치
# yum install -y https://dl.grafana.com/oss/release/grafana-10.0.1-1.x86_64.rpm2. 서비스 실행
# systemctl start grafana-server.service
# systemctl enable grafana-server.service
# netstat -tnlp
Active Internet connections (only servers)
Proto Recv-Q Send-Q Local Address Foreign Address State PID/Program name
tcp 0 0 0.0.0.0:22 0.0.0.0:* LISTEN 1060/sshd
tcp 0 0 0.0.0.0:10050 0.0.0.0:* LISTEN 8574/zabbix_agentd
tcp6 0 0 :::80 :::* LISTEN 5002/httpd
tcp6 0 0 :::22 :::* LISTEN 1060/sshd
tcp6 0 0 :::3000 :::* LISTEN 14316/grafana
tcp6 0 0 :::443 :::* LISTEN 5002/httpd
tcp6 0 0 :::9090 :::* LISTEN 11627/prometheus#admin 패스워드 변경 (기본은 admin / admin)
# grafana-cli admin reset-admin-password password
.
.
Admin password changed successfully ✔
3. grafana 접속하여 prometheus와 연동
-
IP주소:3000 로 web접속
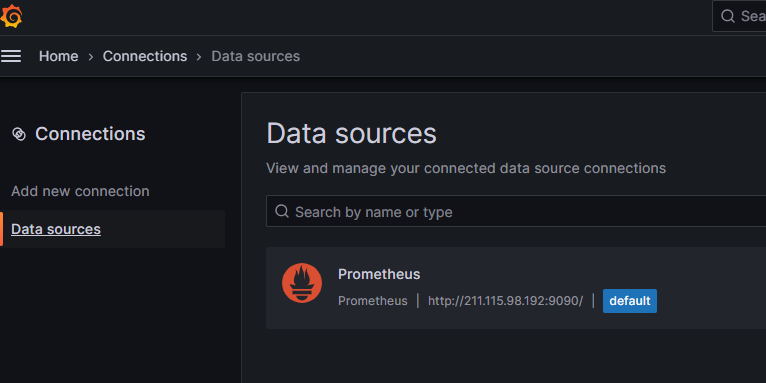
좌측 상단에서 connections 클릭 후 prometheus 선택
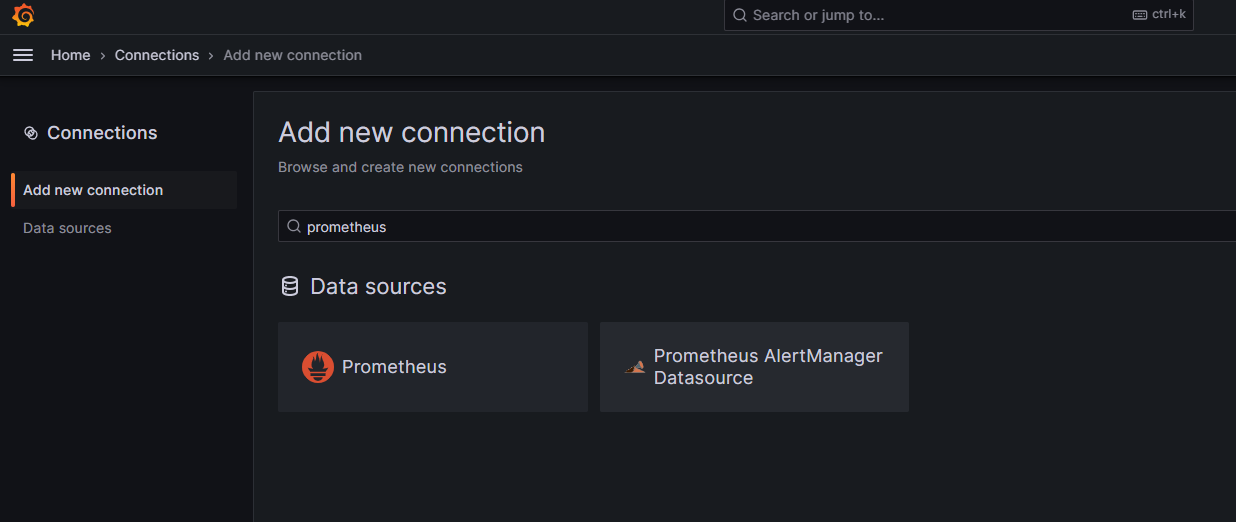
-
프로메테우스가 설치된 서버의 URL 입력하고 연동
프로메테우스가 설치된 서버의 URL 입력하고 연동
그라파나 대시보드 사이트 (만들어진 dashboard를 가져와서 사용할 수 있다.)
node-exporter 설치
1. node-exporter 바이너리 설치 (worker node)
[root@worker-node ~]# wget https://github.com/prometheus/node_exporter/releases/download/v1.6.0/node_exporter-1.6.0.linux-amd64.tar.gz2. 서비스 등록
# vi /etc/systemd/system/node_exporter.service

[Unit]
Description=Prometheus Node Exporter
Documentation=https://prometheus.io/docs/guides/node-exporter/
Wants=network-online.target
After=network-online.target
[Service]
User=root
Restart=on-failure
ExecStart=/data/node_exporter/node_exporter
[Install]
WantedBy=multi-user.target
3. 서비스 실행
systemctl daemon-reload
systemctl start node_exporter
systemctl status node_exporter
systemctl enable node_exporter
4. 프로메테우스 서버에서 client 등록 추가
[root@Prometheus ~]# vi /data/prometheus/prometheus.yml

  - job_name: 'WAS'
    static_configs:
      - targets: ['IP:9100']
exporter 설치 후 prometheus.yml 파일에 worker를 추가 후 prometheus를 재기동 시켜주어야 한다.
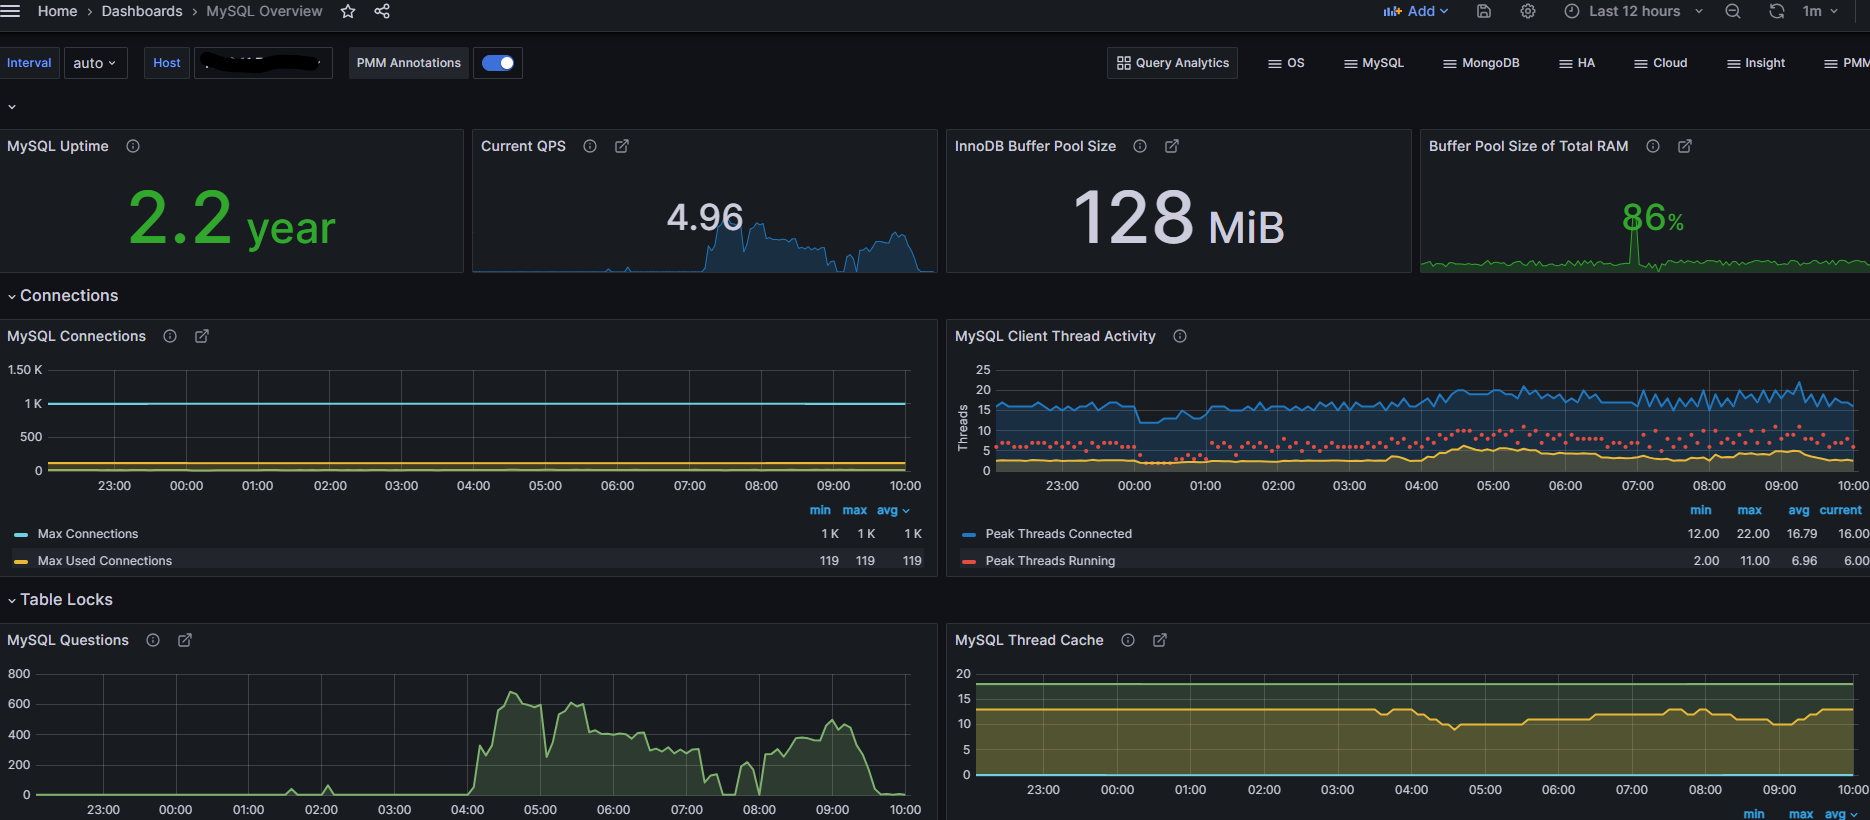
grafana에서 대시보드 생성 후 리소스를 모니터링 할 수 있다.
apache-exporter 설치
1. apache_exporter 설치
# wget https://github.com/Lusitaniae/apache_exporter/releases/download/v1.0.3/apache_exporter-1.0.3.linux-amd64.tar.gz

압축해제 후 /data 밑으로 mv
2. 서비스 등록
# vi /etc/systemd/system/apache_exporter.service

[Unit]
Description=Apache Exporter
Wants=network-online.target
After=network-online.target
[Service]
User=root
Group=root
Type=simple
ExecStart=/data/apache_exporter/apache_exporter \
--scrape_uri="localhost/?auto"
### scrape_uri https
#--scrape_uri="https://xinet.kr/server-status/?auto"

[Install]
WantedBy=multi-user.targe
systemctl daemon-reload
systemctl start apache_exporter.service
systemctl status apache_exporter.service3. apache config server-status 활성화
[root@WEB ~]# vi /data/apache2.4.48/conf/httpd.conf

<Location /server-status>
    SetHandler server-status
    Require local
    Require all denied
</Location>


>>아파치 재시작

[root@NKIV-VBIZRING-WEB bin]# curl localhost/server-status 확
4. 프로메테우스 yml 에 설정 추가
[root@prometheus]# vi /data/prometheus/prometheus.yml

  - job_name: 'apache'
    static_configs:
      - targets: ["IP:9117"]
mysql-exporter 설치
1. mysql_exporter 바이너리 설치
# wget https://github.com/prometheus/mysqld_exporter/releases/download/v0.15.0/mysqld_exporter-0.15.0.linux-amd64.tar.gz

# tar zxvf mysqld_exporter-0.15.0.linux-amd64.tar.gz

# mv mysqld_exporter-0.15.0.linux-amd64 mysqld_exporter
2. mysqld exporter 가 mysql 서버에서 정보를 읽을 수 있도록 계정 생성 및 권한 추가 (maria 10.6)
mysql [(none)] > create user exporter@localhost identified by 'pwexporter' with MAX_USER_CONNECTIONS 3;

mysql [(none)] > grant process, replication client, select on *.* to exporter@localhost;

mysql [(none)] > show grants for exporter@localhost;
+-----------------------------------------------------------------------------------------------------------------------------------------------------------------------+
| Grants for exporter@localhost                                                                                                                                         |
+-----------------------------------------------------------------------------------------------------------------------------------------------------------------------+
| GRANT SELECT, PROCESS, BINLOG MONITOR ON *.* TO `exporter`@`localhost` IDENTIFIED BY PASSWORD '*885EE44233E4E92DC67B811E8C942FF9FA82855A' WITH MAX_USER_CONNECTIONS 3 |
+-----------------------------------------------------------------------------------------------------------------------------------------------------------------------+
3. my.cnf 설정 값 추가 (mysql 재기동은 하지 않았으며, my.cnf에 있는 패스워드 정보로 메트릭을 수집한다.)
vi /etc/my.cnf

[client]
user=exporter
password=pwexporter
4. 서비스 등록
vi /etc/systemd/system/mysqld_exporter.service

[Unit]
Description=Prometheus MySQL Exporter
Wants=network-online.target
After=network.target
[Service]
User=root
Group=root
Type=simple
Restart=always
ExecStart=/data/mysqld_exporter/mysqld_exporter \
--config.my-cnf /etc/my.cnf \
--collect.global_status \
--collect.info_schema.innodb_metrics \
--collect.info_schema.innodb_tablespaces \
--collect.info_schema.innodb_cmp \
--collect.info_schema.innodb_cmpmem \
--collect.auto_increment.columns \
--collect.info_schema.processlist \
--collect.binlog_size \
--collect.info_schema.tablestats \
--collect.global_variables \
--collect.info_schema.query_response_time \
--collect.info_schema.userstats \
--collect.info_schema.tables \
--collect.perf_schema.tablelocks \
--collect.perf_schema.file_events \
--collect.perf_schema.eventswaits \
--collect.perf_schema.memory_events \
--collect.perf_schema.indexiowaits \
--collect.perf_schema.tableiowaits \
--collect.slave_status \
--web.listen-address=0.0.0.0:9104
[Install]
WantedBy=multi-user.target
5. 서비스 실행
systemctl daemon-reload
systemctl start mysqld_exporter.service
systemctl enable mysqld_exporter.service
systemctl status mysqld_exporter.service
[root@DB mysqld_exporter]# netstat -tnlp
Active Internet connections (only servers)
Proto Recv-Q Send-Q Local Address Foreign Address State PID/Program name
tcp6 0 0 :::3306 :::* LISTEN 440/mariadbd
tcp6 0 0 :::9100 :::* LISTEN 26561/node_exporter
tcp6 0 0 :::9104 :::* LISTEN 6509/mysqld_exporte
tcp6 0 0 :::22 :::* LISTEN 1009/sshd6. 프로메테우스 서버 yaml 설정 파일 수정 후 재기동
[root@PROMETHEUS ~]# vi /data/prometheus/prometheus.yml

  - job_name: '_mysqld_exporter'
    static_configs:
      - targets: ["IP:9104"]
7. 재기동
# systemctl restart prometheus.service