Daily plan
🌞오전
- SQL 코드카타 89, 90, 91
- 10시 통계 라이브세션
- 11시 30분 발제?
🔥 오후
- 통계 라이브세션 정리
- 스탠다드 4회차 실습 복습
- 통계 강의 2주차 + 3주차~~
🌝 저녁
- 파이썬 개인과제 피드백 확인
- 데이터 전처리&시각화 3주차 다시 복습
To Do
- ✅ SQL 코드카타 86~88
- ✅ 통계 라이브세션 정리 & 실습 복습
- ✅ 통계 강의 2주차 (2-3~)
- ⛔ 스탠다드반 2회차 실습 복습 + 새로 알게 된 내용만 간단히 정리
- ✅ 개인과제 피드백 확인
- ⛔ QCC 4번 문제 다시 풀어보기
이번주 목표
- 통계학 강의 완강
- 시각화&전처리 강의 완강
- 데이터분석 파이썬 종합반 5주차 정리
- 통계 라이브세션 정리&복습 밀리지 않기!
- 파이썬 스탠다드반 정리&복습 밀리지 않기!
- 파이썬 베이직반 내용 공부 (헷갈리거나 처음보는 내용들만 정리)
- 지난 프로젝트 빨리 정리해서 업로드하자...
- SQL 코드카타 100번 찍기!
SQL 코드카타
Q86 - Average Time of Process per Machine
select machine_id,
    round(avg(time_diff),3) as processing_time
from(
    select a1.machine_id, a1.process_id,
        a2.timestamp-a1.timestamp as time_diff
    from activity a1
        join activity a2
        on a1.machine_id=a2.machine_id
        and a1.process_id=a2.process_id
        and a1.activity_type = 'start'
        and a2.activity_type = 'end'
    ) t
group by machine_id- join 할 때 on절에 and 또는 or로 조건 여러개를 작성할 수 있음
- 동일한 테이블에서 activity_type이 'start'인 경우와 'end'인 경우를 구분하여 join
Q87 - Employee Bonus
select e.name, b.bonus
from employee e
    left join bonus b
    on e.empId = b.empId
where b.bonus<1000 or b.bonus is null
문제 조건에서 null값을 갖는 경우도 출력하라고 해서
- left join을 하고,
- where절에 b.bonus<1000만 적었더니 null값을 갖는 경우는 제외돼서 b.bonus가 null인 경우도 출력하라고 조건을 하나 더 걸어줌
Q88 - Students and Examinations
select st.student_id, st.student_name, sub.subject_name,
    if(e.cnt is null, 0, e.cnt) attended_exams
from students st
    cross join subjects sub
    left join (select student_id, subject_name, count(1) cnt
               from examinations
               group by student_id, subject_name) e
    on st.student_id = e.student_id
        and sub.subject_name=e.subject_name
order by student_id, subject_name- cross join을 이용
- 먼저 students와 subjects 테이블을 crossjoin하여 각각의 학생 모두 모든 과목에 대한 행을 가지도록 테이블을 생성- students와 examinations를 합치면 특정 과목을 듣지 않은 학생에서는 그 과목에 대한 카운트가 되지 않기 때문
- cross join 한 테이블과 과목별 count 열을 추가한 examinations 테이블을 join
- count가 없는 행은 null로 표시되므로 0으로 바꾸어줌
더 좋은 쿼리가 있는지 지피티 선생님께 여쭤본 결과
WITH exam_counts AS (
    SELECT
        student_id,
        subject_name,
        COUNT(*) AS cnt
    FROM examinations
    GROUP BY student_id, subject_name
)

SELECT
    st.student_id,
    st.student_name,
    sub.subject_name,
    COALESCE(e.cnt, 0) AS attended_exams
FROM students st
CROSS JOIN subjects sub
LEFT JOIN exam_counts e
    ON st.student_id = e.student_id
    AND sub.subject_name = e.subject_name
ORDER BY st.student_id, sub.subject_name;- 역시나 with 구문을 쓰라고 추천해주심 (가독성 증가)
- COALESCE(e.cnt, 0)
- if절 대신 이걸 쓰라고 알려주심
- coalesce 함수는 조건에 따라 두 컬럼을 합치는 기능을 하며, 이 기능을 활용해서 Null값을 특정 값으로 변환하는 데 사용하기도 함SELECT a, b, COALESCE(a,b) FROM test;- 두개의 인자를 받고, 첫번째 인자(a)의 0번째 행부터 value를 살핌
- 만약 a의 0번째 행이 Null이면 같은 줄에 있는 b의 값으로 대체
- b 대신 Null값의 대체값을 입력하여 활용 가능
통계 라이브세션 3회차
유의수준
- 중심극한정리
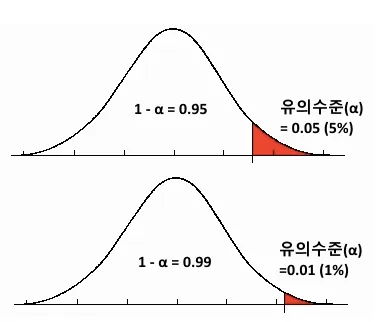
: 모집단의 크기가 충분히 크다면, 모집단의 분포가 어떤 모양이더라도 표본평균의 분포가 정규분포를 이루며, 이를 통해 모집단의 모수를 추정할 수 있음 - 유의수준(α)
: 귀무가설이 맞을 때 기각할 확률
95% 신뢰도를 기준으로 유의수준은 0.05 (신뢰도와 반대의 개념) - 정규분포 그래프
- 그래프 면적은 확률을 의미하며, 0~1 사이의 값을 가짐
검정통계량
- 검정통계량
: 귀무가설 채택 또는 기각을 위해 사용하는 확률변수
확률변수란 특정 확률로 발생하는 각각의 결과를 수치값으로 표현하는 변수
ex) 주사위를 던졌을 때 나오는 숫자를 확률변수 X라고 가정했을 때, X = 1,2,3,4,5,6
p-value
- p-value: 어떤 사건이 우연히 발생할 확률로, 0이상 1이하의 값을 가짐
- p-value가 0.05보다 작다
= 우연히 일어났을 가능성이 거의 없다
= 관계가 있다고 추정 가능하다
= 대립가설 채택 - 반대로 p-value가 0.05보다 크면, 우연히 일어났을 가능성이 높다는 의미이므로 관계가 없다고 추정하여 대립가설을 기각
실습은 주피터에,,,
통계학 기초 강의
2회차(2-3~)
정규분포
- 종 모양의 대칭 분포
- 대부분의 데이터가 평균 주위에 몰려 있는 분포로, 평균을 중심으로 좌우 대칭이며 평균에서 멀어질수록 데이터 빈도가 감소
- 표준편차는 분포의 퍼짐 정도를 나타냄
- 데이터의 수가 많으면 정규분포를 따르는 경향이 있음 -> 중심극한정리
- 대부분의 상황에서 관찰되는 분포
파이썬 실습
# 정규분포 생성
normal_dist = np.random.normal(170, 10, 1000) # 평균, 표준편차, 개수
#
# 히스토그램 시각화
plt.hist(normal_dist, bins=30, density=True, alpha=0.6, color='g')
#
# 정규분포 곡선 추가
xmin, xmax = plt.xlim()
x = np.linspace(xmin, xmax, 100)
p = stats.norm.pdf(x, 170, 10)
plt.plot(x, p, 'k', linewidth=2)
plt.title('normal distribution histogram')
plt.show()
#
# 정규분포 곡선을 추가하여 히스토그램이 정규분포와 얼마나 가까운 형태를 띄는지 확인할 수 있음
긴 꼬리 분포
- 대부분의 데이터가 분포의 한쪽 끝에 몰려있고, 반대쪽으로 긴 꼬리가 이어지는 형태
- 비대칭적
- 특정한 하나의 분포를 의미하지 않으며 여러 종류의 분포를 포함할 수 있음
- 파레토 분포, 지프의 법칙, 멱함수 등 - 일부가 전체적으로 큰 영향을 미치는 경우에 사용
- 소득 분포, 웹사이트 방문자 수, 도서 판매 등
파이썬 실습
  # 긴 꼬리 분포 생성
  long_tail = np.random.exponential(1,1000)
  #
  # 히스토그램 시각화
  plt.hist(long_tail, bins=30, density=True, alpha=0.6, color='b')
  plt.title('long tail distribution histogram')
  plt.show()
스튜던트 t분포
- 표본이 작을 때 (데이터 수가 적을 때) 정규분포 대신 사용 (일반적으로 30개 미만)
- 자유도가 커질수록 정규분포에 가까워짐
- 자유도는 표본의 크기와 관련 있는 값이므로, 표본 크기가 커질수록 정규분포에 가까워진다고 이해할 수 있음 - 정규분포와 유사하지만 표본의 크기가 작을수록 꼬리가 두꺼워지는 특징이 있음
- 작은 표본의 평균을 비교하는 경우에 주로 사용
- 약물 시험 등
파이썬 실습
# 스튜던트 t분포 생성
t_dist = np.random.standard_t(df=10, size=1000)  # df는 자유도를 의미
#
# 히스토그램 시각화
plt.hist(t_dist, bins=30, density=True, alpha=0.6, color='r'
#
# 스튜던트 t분포 곡선 추가
x = np.linspace(-4,4,100)
p = stats.t.pdf(x, df=10)
plt.plot(x, p, 'k', linewidth=2)
plt.title('student t distribution histogram')
plt.show()
카이제곱분포
- 범주형 데이터의 독립성 검정이나 적합도 검정에 사용되는 분포
- k값은 자유도를 의미하며, 자유도에 따라 모양이 달라짐
- 카이제곱분포도 데이터 수가 많아질수록 정규분포에 근사
- 상관관계나 인과관계를 판별하고자 하는 원인의 독립변수가 '완벽하게 서로 다른 질적 자료'일 때 활용
- ex) 성별이나 나이에 따른 선거 후보 지지율 - '관측한 값들이 특정 분포에 해당하는지?' 적합도 검정을 할 때 사용
파이썬 실습
# 카이제곱분포 생성
chi2_dist = np.random.chisquare(df=2, size=1000)
#
# 히스토그램으로 시각화
plt.hist(chi2_dist, bins=30, density=True, alpha=0.6, color='m')
#
# 카이제곱분포 곡선 추가
x = np.linspace(0,10,100)
p = stats.chi2.pdf(x, df=2)
plt.plot(x, p, 'k', linewidth=2)
plt.title('카이제곱 분포 히스토그램')
plt.show()
이항분포
- 결과가 2개 나오는 상황일 때 사용하는 분포
- 성공/실패와 같은 두가지 결과를 가지는 실험을 여러 번 반복했을 때 성공 횟수의 분포- 독립적인 시행이 n번 반복되고, 각 시행해서 둘 중 하나의 결과만 가능한 경우를 모델링하는 분포
- 연속된 값을 가지지 않고 특정한 정수 값만 가질 수 있음
- 이항분포처럼 연속된 값을 가지지 않는 분포를 이산형 분포라고 지칭하기도 함
- 성공 확률을 p라고 할 때 성공의 횟수를 확률적으로 나타냄
- 실험 횟수(n)와 성공 확률(p)로 정의됨
파이썬 실습
# 이항분포 생성
binom_dist = np.random.binomial(n=10, p=0.5, size=1000)
#
# 히스토그램 시각화
plt.hist(binom_dist, bins=10, density=True, alpha=0.6, color='y')
plt.title('이항 분포 히스토그램')
plt.show()
푸아송분포
- 희귀한 사건이 발생할 때 사용하는 분포
- 단위 시간 또는 단위 면적 당 발생하는 사건의 수를 모델링할 때 사용하는 분포 - 평균 발생률(λ)이 충분히 크면 정규분포에 근사
- 평균 발생률: 주어진 시간이나 공간에서 사건이 몇 번 발생했는지 - 연속한 값을 가지지 않으므로 이산형 분포에 해당
- 특정 공간이나 특정 시간에 사건이 발생하는 경우
- ex) 콜센터, 교통사고, 문자메세지, 윕사이트 트래픽 등파이썬 실습
import numpy as np
import matplotlib.pyplot as plt
from scipy.stats import poisson
#
# 푸아송 분포 파라미터 설정
lambda_value = 4  ## 평균 발생률
x = np.arange(0,15)  ## 사건 발생 횟수 범위
#
# 푸아송 분포 확률 질량 함수 계산
poisson_pmf = poisson.pmf(x, lambda_value)
#
# 그래프 그리기
plt.figure(figsize=(10,6))
plt.bar(x, poisson_pmf, alpha=0.6, color='b', label=f'Poisson PMF (lambda={lambda_value})')
plt.xlabel('Number of Events')
plt.ylabel('Probability')
plt.title('Poisson Distribution')
plt.legend()
plt.grid(True)
plt.show()
3주차 내용은 오늘 통계 라이브세션으로 들은 내용이랑 너무 겹쳐서 복습할 겸 내일 들어야겠다
파이썬 개인과제 피드백
7번
좌표 설정 오류.. y좌표 계산해야 하는 자리에 x좌표 계산함
- i[1][j+1][1]-i[1][j][0] -> i[1][j+1][1]-i[1][j][1] 으로 수정
def calculate_total_distances(player_positions):
    # 여기에 코드를 작성하세요
    for i in player_positions.items():
        distance=0
        for j in range(len(i[1])-1):
            distance += ((i[1][j+1][0]-i[1][j][0])**2+(i[1][j+1][1]-i[1][j][1])**2)**(1/2)
        print (i[0]+"의 총 누적 이동 거리: "+str(round(distance,2))+" 미터")
8번
튜터님 피드백이 이해가 가질 않아요...
"암호 해독 함수가 영어와 한글 숫자를 처리하는 기본 로직은 갖추고 있습니다. 다만 영어 숫자 처리 부분에서 문자열 시작 두 글자만 확인하는 방식은 전체 단어를 올바르게 판별하지 못할 수 있습니다. 예를 들어 "five"와 "four"는 첫 두 글자가 같습니다." (?????)
이건 내일 튜터님께 질문하러 가야겠다..
일기

팀복을 맞췄어요
피부색도 참 요란스럽다

5조에 새 식구가 생겼어요
귀여운 비숑
이름: 비숑인대용 (비숑인...'대용'....)
본가에 와서 하루종일 먹기만했더니 얼굴이 너무 부은 거 같다ㅎ
분명 어제 집에 도착했을 때만 해도 배가 좀 홀쭉했는데 지금은 빵빵해짐..
살찌기 전에 어서 서울로 돌아가야겠다,,