Daily plan
🌞오전
- SQL 코드카타 101, 102, 103번
- 10시 통계 라이브세션
- 11시 30분 스탠다드 수업
🔥 오후
- 14시 국취제 센터 방문
- 머신러닝 강의 1-6, 1-7, 1-8
- 통계 라이브세션 정리 복습
- 스탠다드 수업 정리 복습
🌝 저녁
- TIL 제출해 !!!!이번주 목표
- 머신러닝 강의 완강
- 통계 라이브세션 정리&복습 밀리지 않기!
- 파이썬 스탠다드반 정리&복습 밀리지 않기!
- SQL 코드카타 하루 3문제 이상
SQL 코드카타
Q101 - Product Sales Analysis III
select product_id, year as first_year, quantity, price
from (select *,
        dense_rank() over(partition by product_id order by year) rn
    from Sales)a
where rn=1
group by product_id
having min(year)
이라고 작성했다가 having절에는 조건문을 써야한대서 year=min(year)로 썼다.
근데 그러면 quantity, price와 같은 다른 컬럼에는 조건이 적용이 안돼서 오답이 됨.
서브쿼리를 쓰는 방식으로 바꾸어서
처음에 row_number를 사용하여 product id별로 가장 오래된 연도의 데이터만 가져오려고 했는데, 그럼 또 동일한 연도의 데이터 중 하나만 출력되는 오류가 발생함.
결국 dense_rank를 사용해서 겨우 정답을 얻었다.
Q102 - Classes More Than 5 Students
select class
from courses
group by class
having count(student)>=5
Q103 - Find Followers Count
select user_id,
    count(follower_id) as followers_count
from followers
group by user_id
order by user_id
통계 라이브세션
- 통계적 가설검정과 머신러닝은 상호보완적
- 머신러닝 모델의 피처 선택 시 유의미한 변수를 찾기 위해 통계적 가설검정을 사용
- 데이터 전처리에 유용한 통계적 기법 사용
- 비선형 데이터의 관계 처리나 대규모 데이터에서 가설 검정의 한계를 보완하기 위해 머신러닝 사용
- 통계적 가설검정은 변수 간 독립성을 가정하지만, 머신러닝은 이러한 제약 없이 상관관계, 연관성을 탐지함
- 두 방법을 융합
- 통계적 가설검정으로 데이터 탐색 및 초기 분석 수행 후
- 머신러닝으로 예측 성능 극대화
지도 학습
: 정답이 있는 데이터를 활용해 훈련 데이터로부터 결과에 대한 예측을 만들어냄
비지도 학습
: 정답이 없는 데이터를 분석하여 그 안에 숨어있는 패턴을 찾거나 데이터를 그룹화시키는 알고리즘
-
지도학습은 비지도학습보다 더 정확한 경향이 있지만, 데이터에 적절한 레이블 지정을 위해서 사전에 "데이터분석가의 주관" 개입이 필요함
-
비지도 학습은 레이블이 지정되지 않은 데이터의 고유한 구조 발견을 위해 자체적으로 작동하지만, 결과의 유효성을 검사하려면 여전히 "데이터분석가의 주관" 개입이 필요함
지도학습
- 선형 회귀
- 로지스틱 회귀
- 나이브 베이즈
- K-NN (K-최근접 이웃)
- 의사결정 트리
- 랜덤 포레스트
- 서포트 벡터 머신(SVM)
- 인공신경망
RFM(분류) 분석
- 고객 분류(세분화) 기법 -> 고객을 R, F, M이라는 특성에 따라 분류하고 특성에 맞춰서 구매기회 창출 및 서비스 발전을 목표로 함
- Recency (최근성)
: 일반적으로 최근에 구매한 고객일수록 더 가치있는 고객으로 점수 매겨짐
구매시기가 오래되면 보통 재구매율이 떨어지기 때문 - Frequency (빈도)
: 빈도수가 높을수록 가치있는 고객으로 점수 매겨짐 - Monetary (구매 금액)
: 구매빈도가 적어도 큰 금액을 지출하는 고객이 매출에 더 도움될 수 있음
구매금액이 높을수록 가치있는 고객으로 점수 매겨짐
-비즈니스 성격이나 상황에 따라 알맞은 기준을 세우는 과정이 필요 - Recency, Frequency, Monetary를 각각 몇 단계로 나눌 것인가
- Frequency, Monetary를 집계하는 기간을 어떻게 설정할 것인가
- Recency (최근성)
비지도학습
- 군집(Clustering)
- K-means 클러스터링
- 위계적 군집분석
- 가우시안 혼합모형
- 주성분 분석 (PCA)
- LLE (Locally Linear Embedding)
- Isomap
- MDS (Multi Dimensional Scaling)
- t-SNE (t-distributed Stochastic Neighbor Embedding)
군집화
- 현업에서 군집화와 차원 축소가 연결되어 하나의 프로젝트로 진행됨
- 클러스터링에서 학습할 것들 (클러스터링 과정)
- 기간 선정
- K값(군집 개수), 초기 컬럼(피쳐) 선정
- 이상치 기준 선정 및 제외
- 표준화
- 차원 축소
- PCA PLOT으로 군집 밀도 확인
- 위 과정을 반복하여 최적의 결과 도출
- 모델링 (Random Forest)
- 데이터 적재 및 자동화 설정
Python Standard
머신러닝 모델 평가 및 시각화
평가 지표가 중요한 이유
- 단순히 정확도만 보면 안됨!
- 정확도가 높아도 한 번 잘못 예측한 게 치명적인 경우도 있음
주요 평가 지표
- 이진 분류 지표들
- 정확도: 전체 중 정답의 비율
- 정밀도: positive로 예측한 것 중 진짜 정답의 비율 TP/(TP+FP)
- 재현율: 실제 positive인 것 중 예측이 맞은 비율 TP/(TP+FN)
- F1-score: 정밀도와 재현율의 조화 평균
- AUC-ROC: 임계값에 따른 분류 능력 요약 지표
- 정밀도와 재현율은 서로 trade-off 관계이며, 둘 중 한쪽이 높으면 다른 한쪽은 낮아짐
혼동 행렬 시각화
from sklearn.metrics import confusion_matrix, ConfusionMatrixDisplay

# 예시
y_true = [0,1,1,0,1,0,1]
y_pred = [0,0,1,0,1,1,1]

cm = confusion_matrix(y_true, y_pred)
disp = ConfusionMatrixDisplay(confusion_matrix=cm)
disp.plot()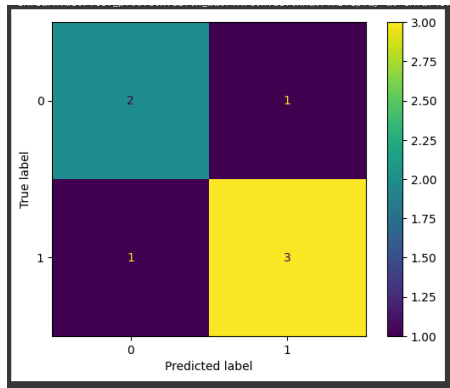
ROC Curve, PR Curve 시각화
from sklearn.metrics import roc_curve, roc_auc_score
import matplotlib.pyplot as plt

# 예시
y_prob = [0.1, 0.4, 0.8, 0.35, 0.9, 0.6, 0.75]
fpr, tpr, thresholds = roc_curve(y_true, y_prob)

plt.plot(fpr, tpr, label=f"AUC={roc_auc_score(y_true, y_prob):.2f}")
plt.plot([0,1],[0,1],'k--') # 대각선 기준선

plt.xlabel("False Positive Rate")
plt.ylabel("True Positive Rate")
plt.title("ROC Curve")
plt.legend()
plt.grid(True)
plt.show()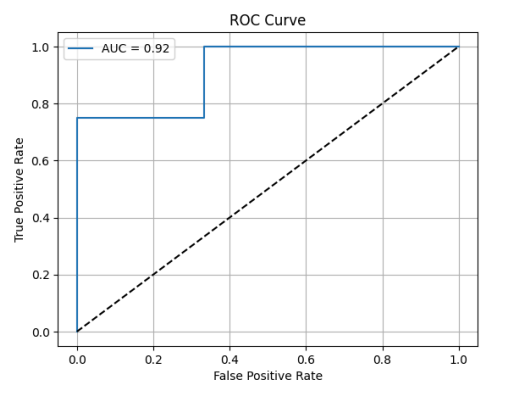
실전 실습: 분류 모델 평가
from sklearn.datasets import load_breast_cancer
from sklearn.ensemble import RandomForestClassifier
from sklearn.model_selection import train_test_split
from sklearn.metrics import classification_report

# 데이터 준비
X, y = load_breast_cancer(return_X_y=True)
X_train, X_test, y_train, y_test = train_test_split(X, y, test_size=0.2)

model = RandomForestClassifier()
model.fit(X_train, y_train)
y_pred = model.predict(X_test)

print(classification_report(y_test, y_pred)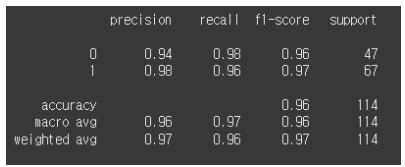
요약
- 정확도만 보지 말고 정밀도, 재현율, F1도 꼭 함께 봐야 함!
- ROC/AUC, 혼동 행렬을 통해 모델의 전체적인 성능 흐름을 시각화
- 실전에서 항상 불균형 데이터 문제를 주의해야 함
시각화 실수
- 목적없는 시각화: 항상 목적 먼저 생각하기
- 축을 잘못 설정하거나 생략
- y축을 0부터 시작하지 않아서 과장된 변화처럼 보일 수 있음
- 이중축을 남용하여 혼란 유발
- 축 범위 조정은 최대한 명확히, 왜곡은 피하기
- 색상 남용 또는 소수를 위한 색상 고려
- 너무 많은 색상은 해석이 불가함
- 색맹 사용자도 구분 가능한 색상을 고려해야 함
- 의미 있는 색상만 사용하고, 필요에 따라 소수를 위한 색깔 고려
- 차트 유형 잘못 선택: 데이터 특성에 맞게 차트 선택하기
- 레이블, 범례, 단위가 없음: 항상 제목, 축 이름, 단위, 범례는 기본으로 작성해야 함
- 너무 많은 정보를 한 그래프에 몰아넣음: 차트 한번에 하나의 메세지만 전달하고, 필요시 나눠 그리기
- 데이터 스케일 고려 안함: Log scale, Standardization 고려
- 해석 없이 그냥 보여줌: 항상 시각화 아래에 메세지 한 줄이라도 작성하기
일기
볼 일이 있어서 외출할 겸 머리도 자르고 왔다 ㅎㅎㅎ
근데 외출을 해서 그런지 공부가 하나도 손에 안잡힘...
머신러닝 강의 빨리 다 들어야 하는데...!!!ㅜㅜㅜ

누가 제일 금쪽이인지 말 안해도 다들 알겠죠..?ㅜㅜ
금쪽이 팀장곤듀 감시하느라 팀원들 등골빠짐ㅜ


헐 머리자른거 봐야돼