
환경
OS - Windows 10
DB - Postgresql 14
Server - Java 8, Spring boot 2.2.9
Prometheus - 2.37.0
grafana - 9
postgresql exporter - 0.10.1
개념
Grafana
그라파나는 메트릭 데이터를 시각화 해주는 제품이다. 대시보드에서 차트나 테이블등의 다양한 형태로 데이터를 표현할 수 있으며, 따로 데이터베이스를 두어 나타내는 것이 아닌 쿼리를 통해 데이터를 수집하여 시각화 한다는 점이 특징이다.
Loki, Prometheus 등의 다양한 라이브러리를 데이터 소스로 두어 수집할 수 있다.
사용법
우선 Postgresql을 가동하는 DB의 메트릭 정보를 수집하기 위해 Exporter와 Prometheus를 연동하고 Grafana에 prometheus 데이터 소스를 등록해야한다.
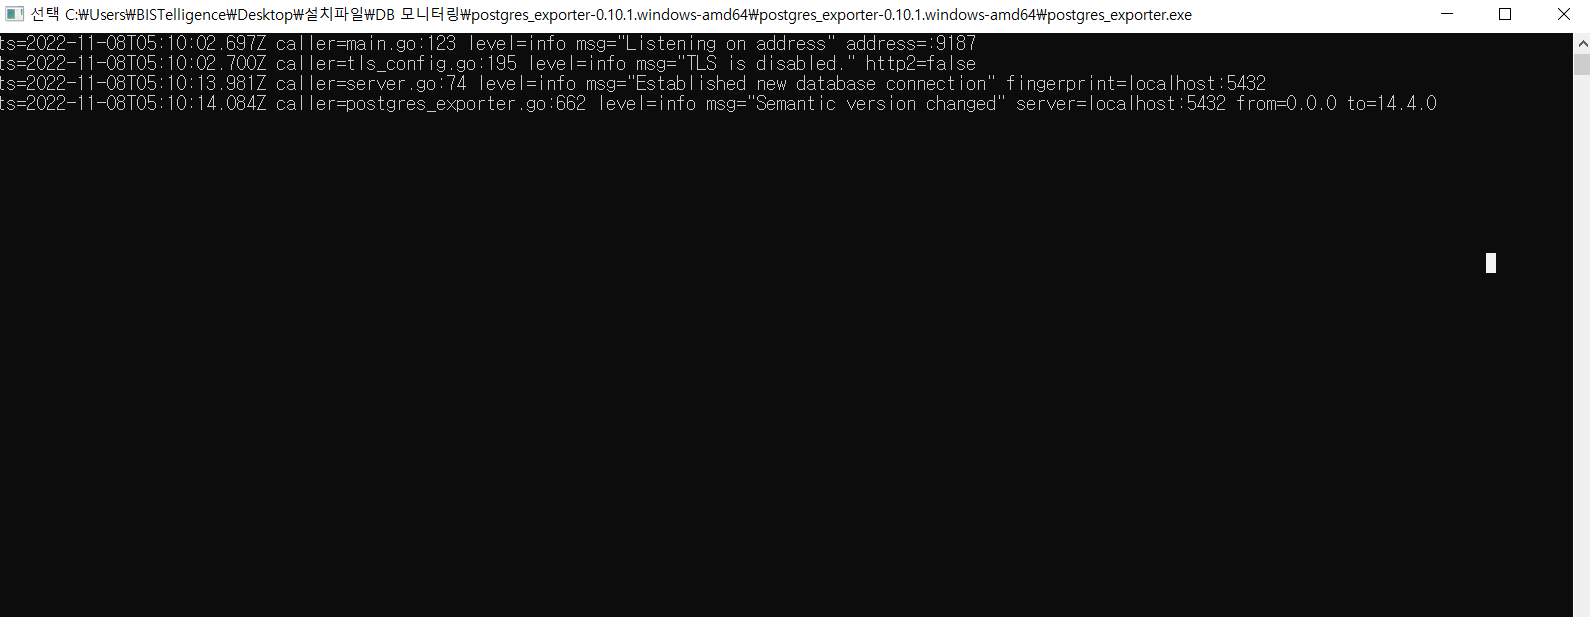
- Exporter 가동
exporter가 원하는 데이터베이스와 연결할 수 있또록 환경변수 설정을 통해 데이터소스를 제공해야 한다.
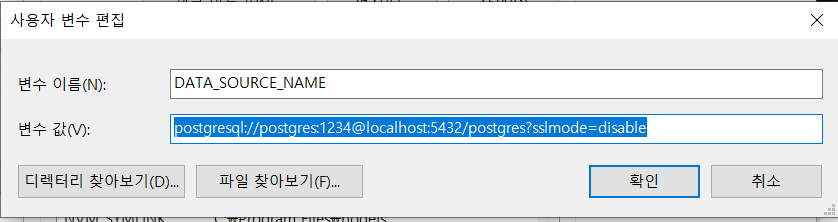
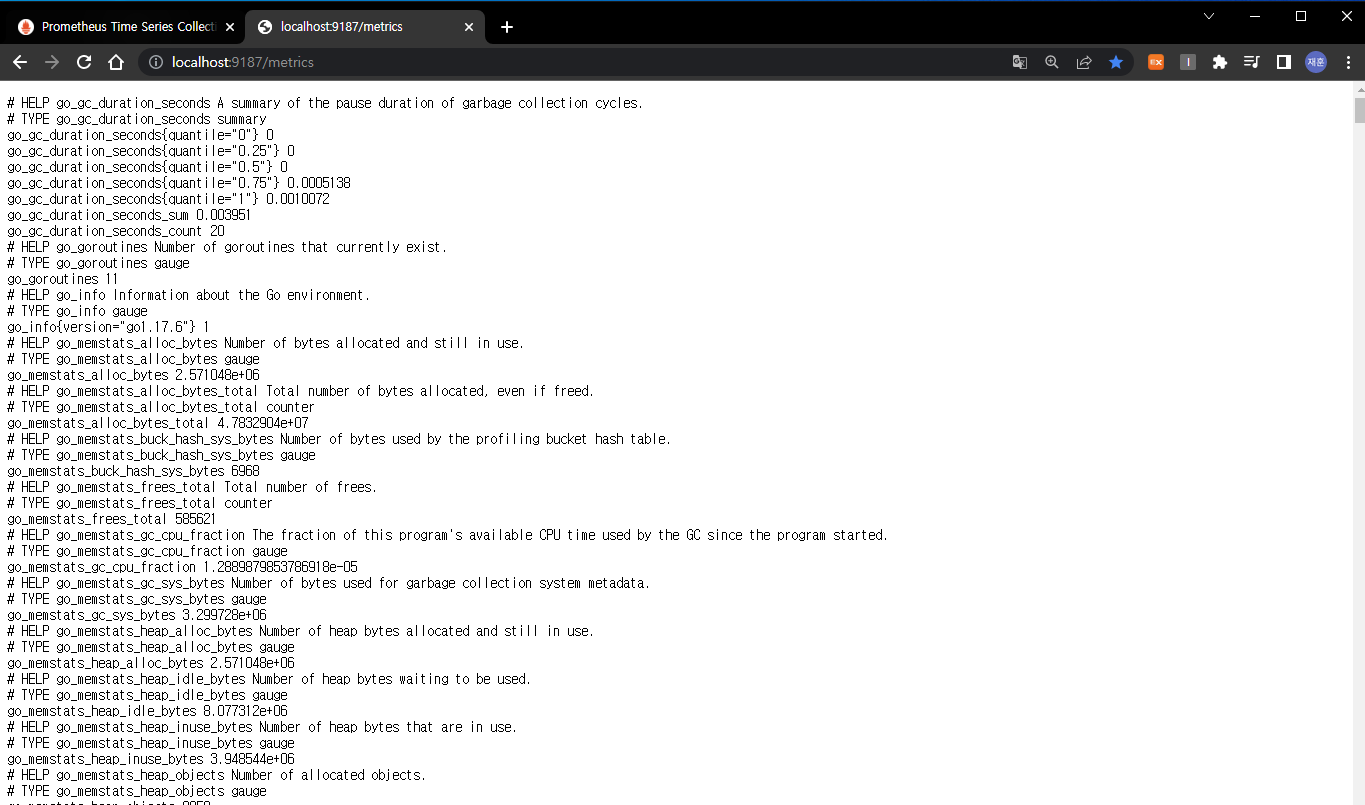
(exporter를 통해 아래와 같은 메트릭 정보를 제공한다)
- Prometheus와 Exporter 연동
prometheus.yml (설정파일)
global:
 # 15 Pull
 scrape_interval: 15s
#
scrape_configs:
  # job, group, instance
  - job_name: "prometheus"
    static_configs:
      - targets: ["localhost:9090"]

 # Postgresql Exporter metrics (exporter 연동)
  - job_name: "postgres"
    static_configs:
      - targets: ["localhost:9187"]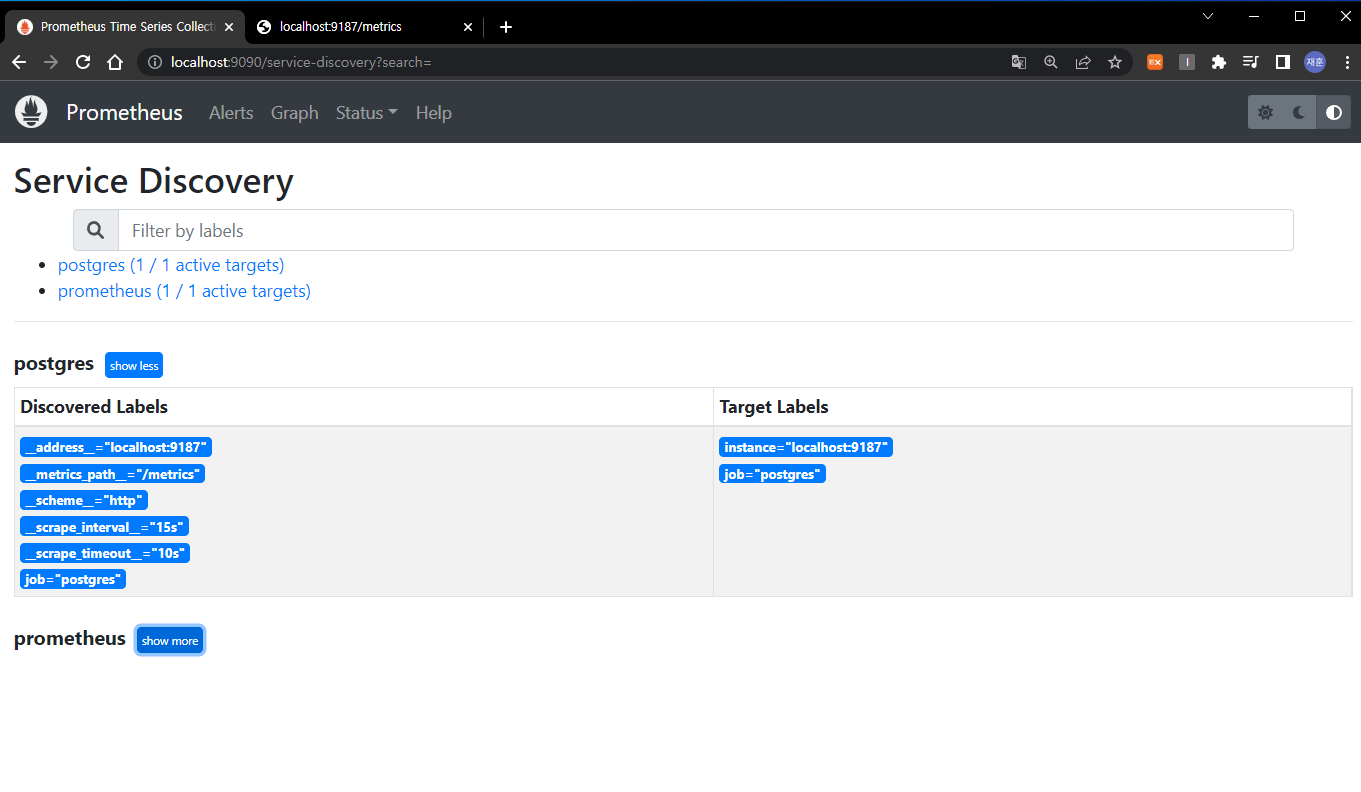
- Grafana와 Prometheus 연동
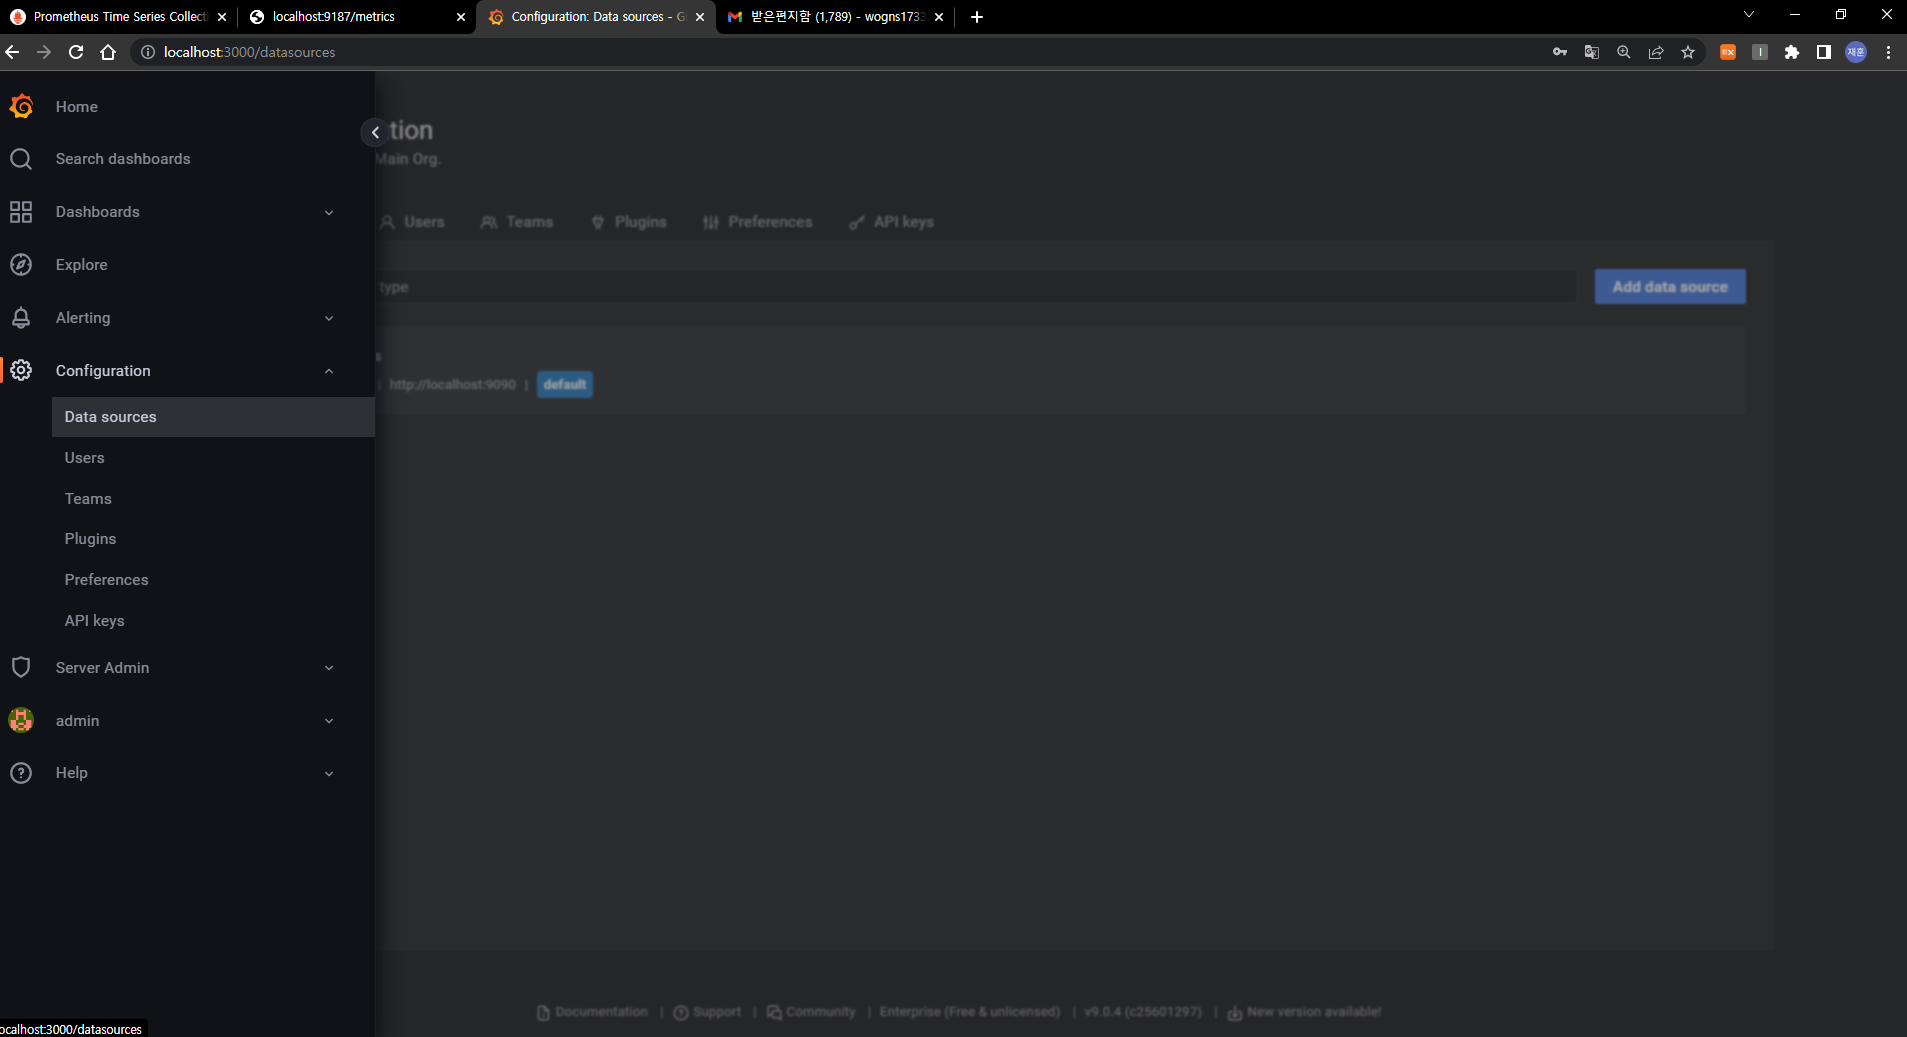
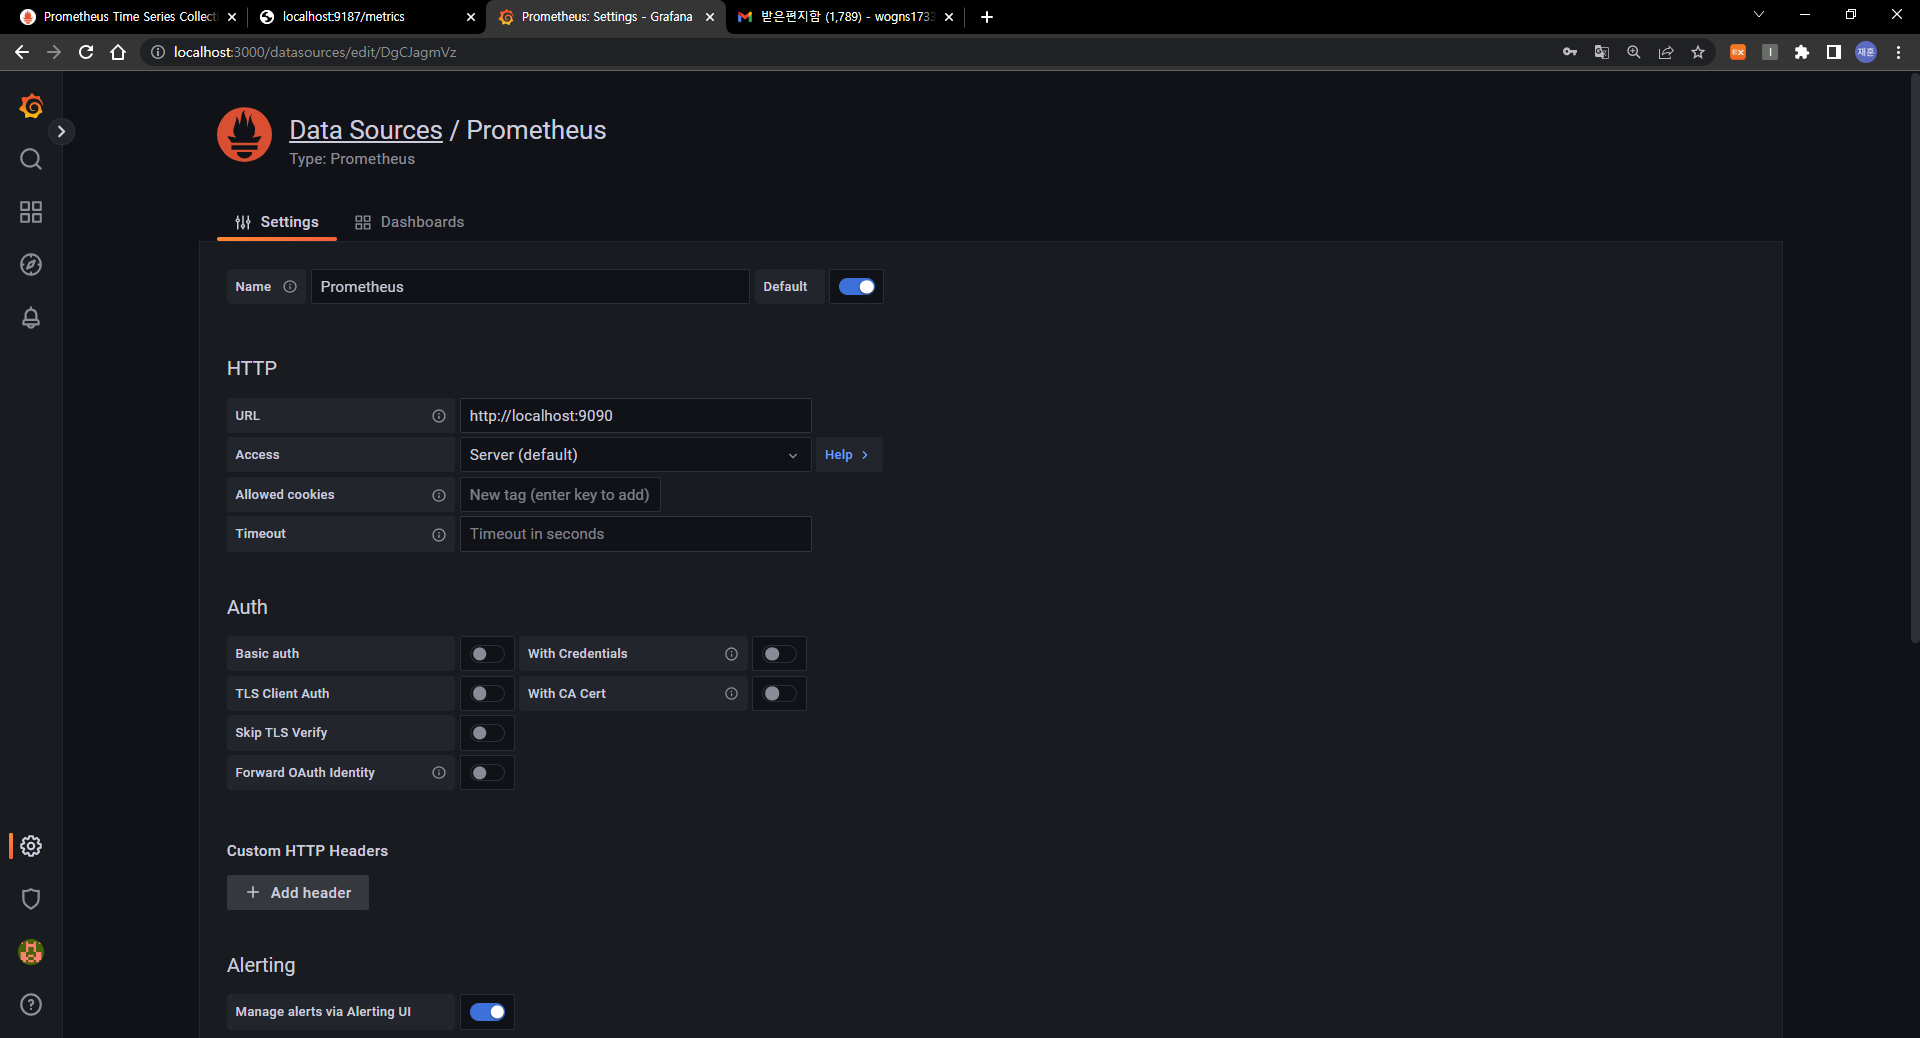
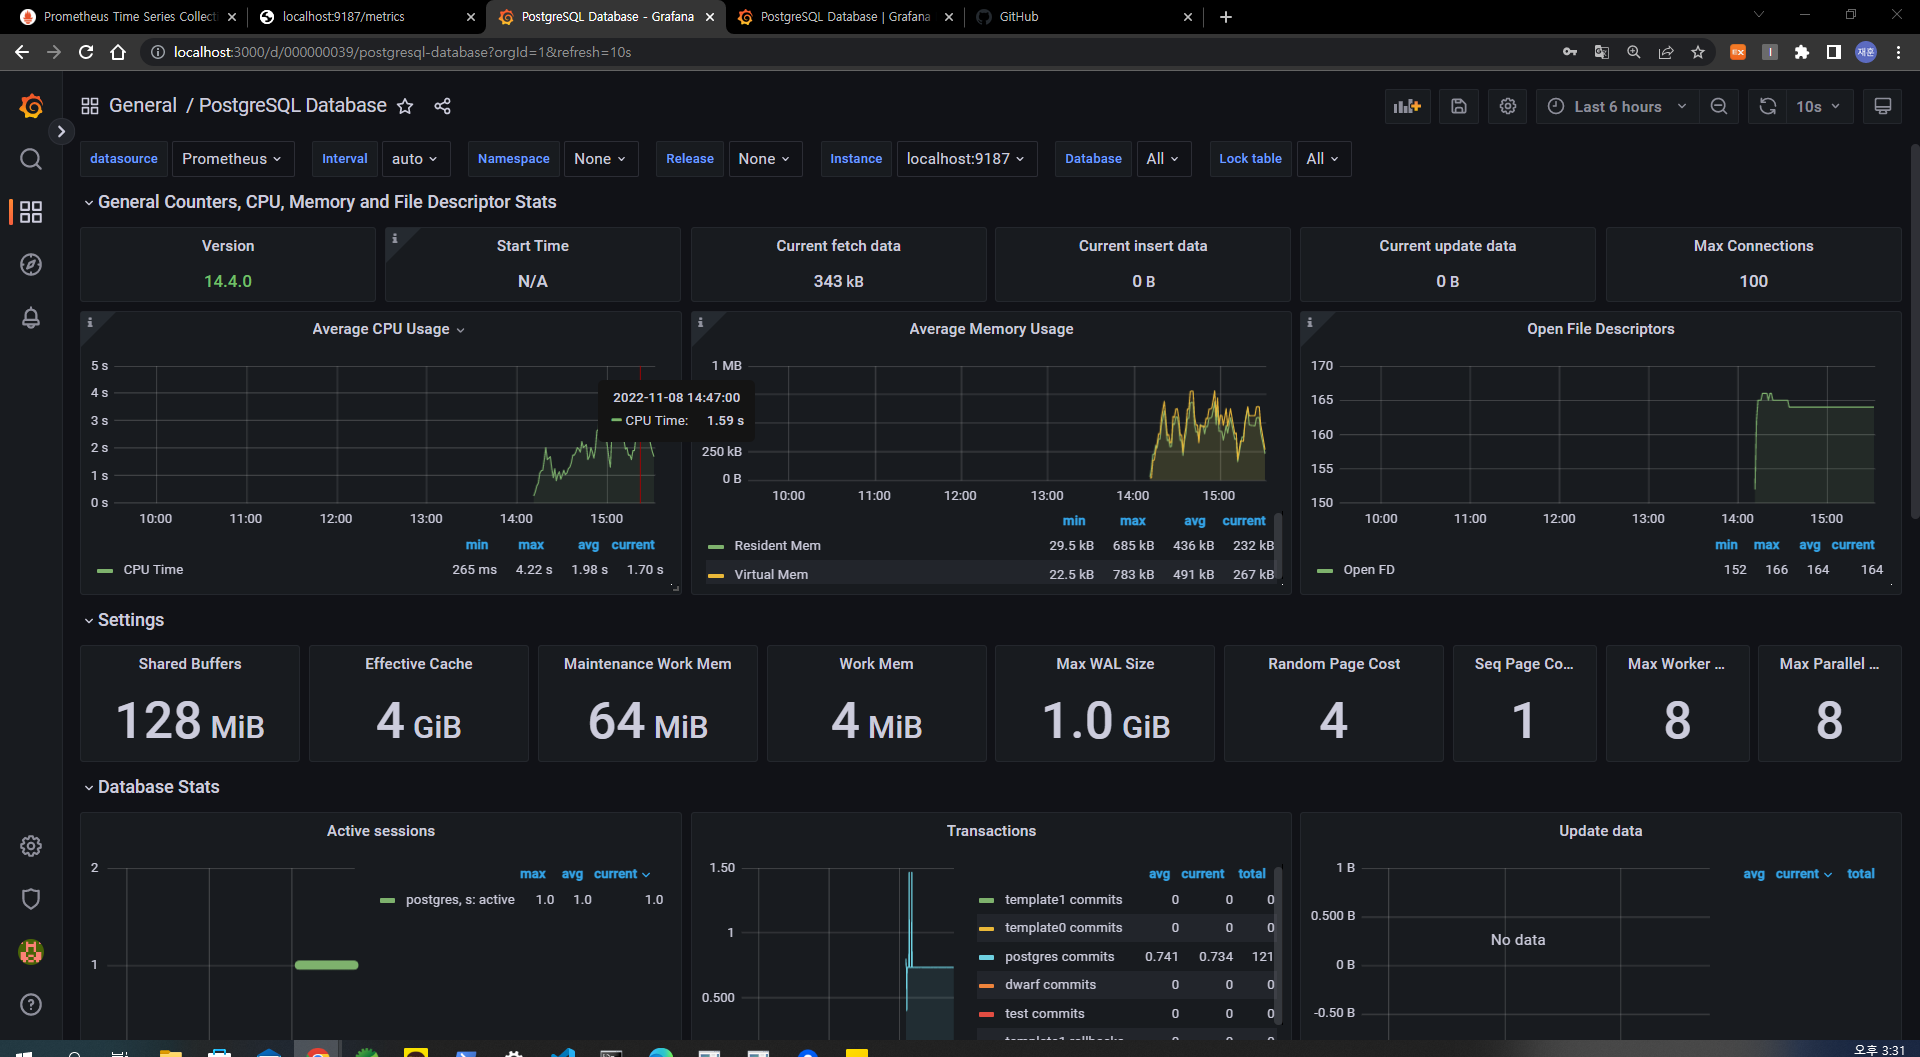
대시 보드 구성의 경우 미리 만들어진 대시보드를 Import 하여 사용
(Dashboard -> Import) Dashboard ID : 9628
후기
처음 환경을 세팅하는 거라 미흡한 점이 많았던거 같다.
특히 프로메테우스를 설정하는 것과 그라파나에서 대시보드를 구성하는 일이 어려웠다. 결국 그라파나는 내가 만드는 것보다 잘 만들어진 걸 가져 오는게 나을거 같아서 그렇게 구성했지만, 나중에는 직접 만들어 봐야겠다.
Reference
https://www.44bits.io/ko/keyword/grafana
https://grafana.com/grafana/
https://grafana.com/grafana/dashboards/9628-postgresql-database/