시계열 필터링과 특징 탐지 by 선형 대수
내적의 사용성
내적은 시계열 필터링에 사용된다.
필터링은 본질적으로 특징 탐지 기법이며, 커널이 시계열 신호의 일부와 일치하는 특징을 찾는다.
필터링된 결과는 또 다른 시계열 데이터가 되며 이를 통해 신호의 특성이 커널의 특성과 얼마나 일치하는지 알 수 있다.
예시로는 매끄러운 변동, 날카로운 에지, 특정 파형 모양 등이 있다.
커널과 시계열 신호 사이의 내적을 계산하는 것이 필터링 알고리즘이다.
하지만 필터링할 때, local 특징 탐지를 해야한다. 이 지역적(local)특징 탐지는 전체 시계열보다 자명하게 짧다. 따라서 시계열 데이터 연구자들은 동일한 길이의 짧은 데이터 조각과 커널(필터링)사이의 내적을 계산하여 특징을 탐지한다.
이 과정으로 필터링된 신호 구간에서 한 점이 생성되고, 커널을 오른쪽으로 한 구간씩 이동시키면서 다른(또는 겹쳐진) 신호 조각화 내적을 계산해 나아간다.
간단한 예시
import numpy as np
import pandas as pd
import matplotlib.pyplot as plt
# 1. 시계열 데이터 생성
np.random.seed(42)
time = np.arange(0, 100, 0.1)
data = np.sin(time) + np.random.normal(scale=0.5, size=len(time))
# 2. 이동 평균 필터 적용
window_size = 5
data_filtered = pd.Series(data).rolling(window=window_size).mean()
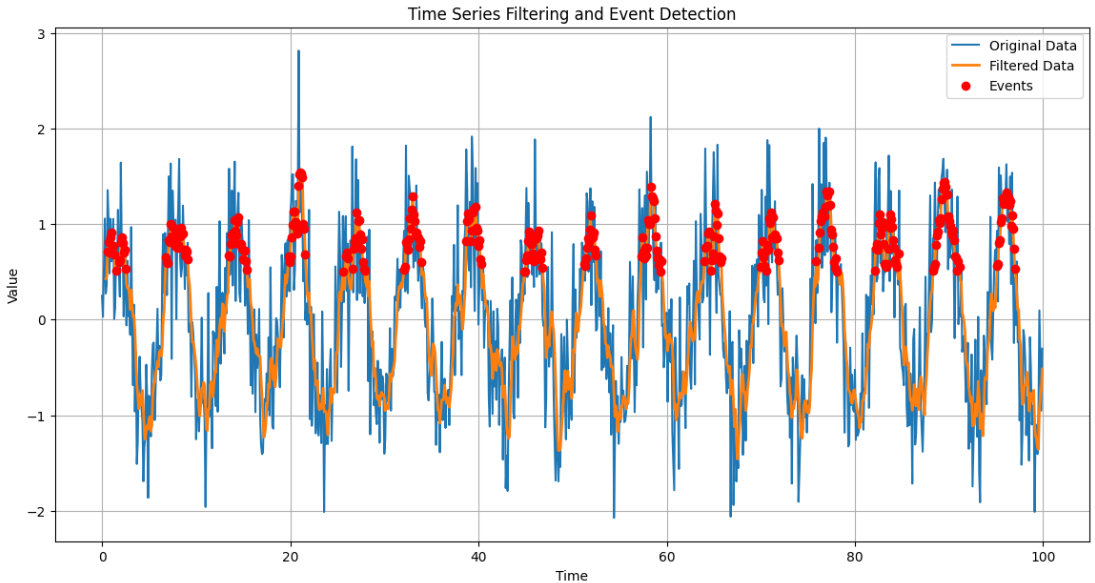
# 3. 특정 임계값을 넘는 이벤트 탐지
threshold = 0.5
events = data_filtered > threshold
# 4. 시각화
plt.figure(figsize=(14, 7))
plt.plot(time, data, label='Original Data')
plt.plot(time, data_filtered, label='Filtered Data', linewidth=2)
plt.scatter(time[events], data_filtered[events], color='red', label='Events', zorder=5)
plt.title('Time Series Filtering and Event Detection')
plt.xlabel('Time')
plt.ylabel('Value')
plt.legend()
plt.grid(True)
plt.show()피크 탐지
import numpy as np
import pandas as pd
import matplotlib.pyplot as plt
from scipy.signal import find_peaks
# 1. 시계열 데이터 생성
np.random.seed(42)
time = np.arange(0, 100, 0.1)
data = np.sin(time) + np.random.normal(scale=0.5, size=len(time))
# 2. 이동 평균 필터 적용
window_size = 5
data_filtered = pd.Series(data).rolling(window=window_size).mean()
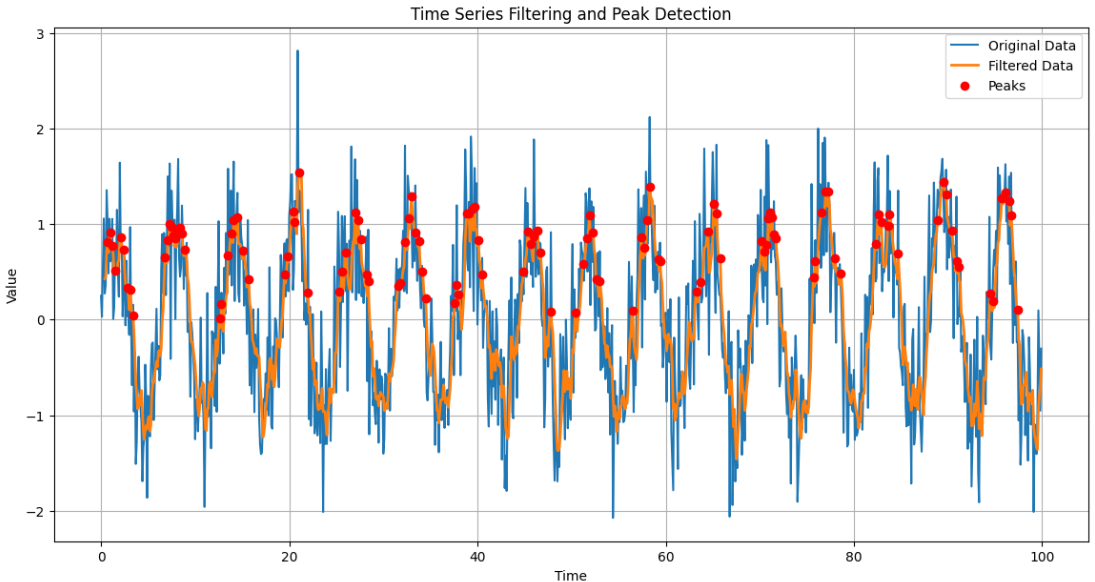
# 3. 피크 탐지
peaks, _ = find_peaks(data_filtered, height=0) # 높이 임계값을 0으로 설정하여 모든 피크 탐지
# 4. 시각화
plt.figure(figsize=(14, 7))
plt.plot(time, data, label='Original Data')
plt.plot(time, data_filtered, label='Filtered Data', linewidth=2)
plt.scatter(time[peaks], data_filtered[peaks], color='red', label='Peaks', zorder=5)
plt.title('Time Series Filtering and Peak Detection')
plt.xlabel('Time')
plt.ylabel('Value')
plt.legend()
plt.grid(True)
plt.show()시계열 필터링은 데이터 과학자에게 중요한 주제이다. 시계열 필터링이 없다면 음악, 라디오, 통신, 위성 등도 존재할 수 없다. 백터-내적으로 음악의 세계가 열렸다고 해도 과언이 아니다.
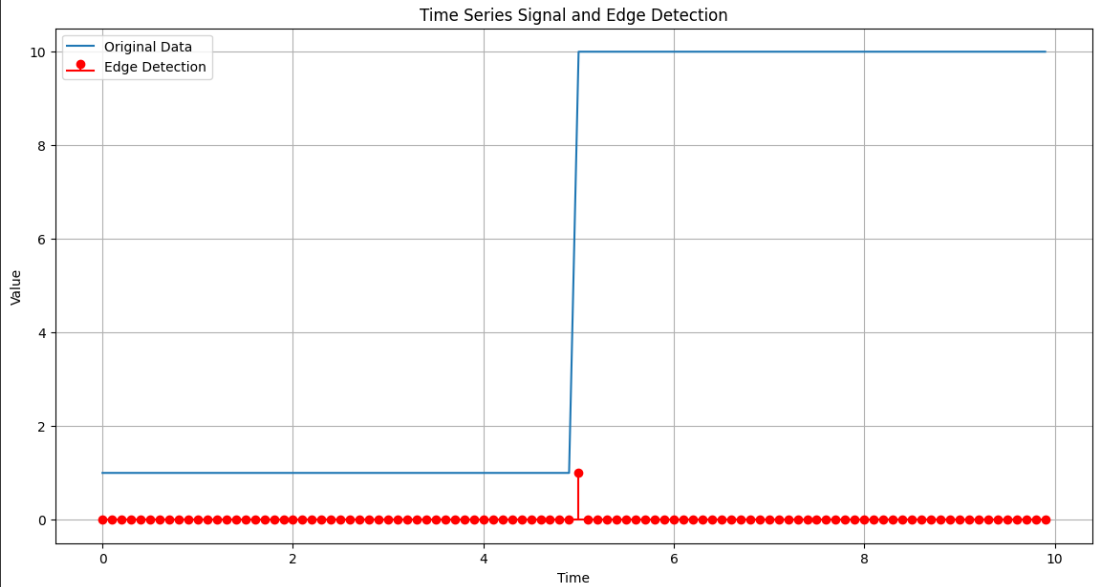
에지 검출기 구현 (계단함수)
import numpy as np
import matplotlib.pyplot as plt

# 1. 간단한 시계열 데이터 생성 (계단 함수 형태)
time = np.arange(0, 10, 0.1)
data = np.where(time < 5, 1, 10)

# 2. 에지 검출 커널 정의
kernel = np.array([-1, 1])

# 3. 에지 검출
edges = np.zeros(len(data))

for i in range(1, len(data)):
    data_segment = data[i-1:i+1]
    if len(data_segment) == 2:  # 커널 크기와 맞추기 위해서
        edge_value = np.dot(kernel, data_segment)
        if edge_value > 0:
            edges[i] = 1
        elif edge_value < 0:
            edges[i] = -1
        else:
            edges[i] = 0

# 4. 시각화
plt.figure(figsize=(14, 7))
plt.plot(time, data, label='Original Data')
plt.stem(time, edges, label='Edge Detection', linefmt='r-', markerfmt='ro', basefmt='r-')
plt.title('Time Series Signal and Edge Detection')
plt.xlabel('Time')
plt.ylabel('Value')
plt.legend()
plt.grid(True)
plt.show()
존경하는 인물: 현 수원삼성블루윙즈 감독 이정효