Kubernetes 입문기: Monitoring & Logging으로 클러스터 가시성 확보 (Day 6)
2025년 11월 4일
Prometheus + Grafana로 메트릭 수집, Vector + OpenSearch로 로그 중앙화, Custom Metrics까지!
들어가며
Day 5에서 Production 환경 운영을 위한 Job/CronJob, Network Policy, Helm Chart, etcd 백업, 클러스터 업그레이드를 마스터했습니다. 이제 Day 6에서는 클러스터를 완벽하게 모니터링하고 로그를 중앙화하는 방법을 학습했습니다.
오늘 배운 것:
1. kube-prometheus-stack으로 Prometheus + Grafana 구축
2. Prometheus Targets와 ServiceMonitor 이해
3. Vector + OpenSearch + OpenSearch Dashboards로 로그 중앙화
4. OpenSearch Dashboards에서 KQL로 로그 검색
5. Python으로 Custom Metrics 애플리케이션 구현
6. ConfigMap으로 Grafana Dashboard 자동 프로비저닝
7. 실전 문제 해결 (Pod CrashLoopBackOff, Dashboard 로드 실패)
1. Prometheus + Grafana 스택 구축
왜 Prometheus인가?
🤔 내가 이해한 것:
- Pull 방식: Prometheus가 주기적으로 타겟에 요청 (Push 방식보다 안정적)
- 시계열 DB: 시간에 따른 메트릭 변화를 효율적으로 저장
- PromQL: SQL처럼 강력한 쿼리 언어
- Service Discovery: Kubernetes의 ServiceMonitor CRD로 자동 타겟 발견
실습 1: kube-prometheus-stack 설치
Helm으로 한 방에 설치:
$ helm repo add prometheus-community https://prometheus-community.github.io/helm-charts
"prometheus-community" has been added to your repositories

$ helm repo update
Hang tight while we grab the latest from your chart repositories...
...Successfully got an update from the "prometheus-community" chart repository
Update Complete. ⎈Happy Helming!⎈

$ kubectl create namespace monitoring
namespace/monitoring created

$ helm install kube-prometheus-stack prometheus-community/kube-prometheus-stack \
  --namespace monitoring \
  --set prometheus.service.type=NodePort \
  --set prometheus.service.nodePort=30090 \
  --set grafana.service.type=NodePort \
  --set grafana.service.nodePort=30300 \
  --set alertmanager.service.type=NodePort \
  --set alertmanager.service.nodePort=30903

NAME: kube-prometheus-stack
LAST DEPLOYED: Mon Nov  4 14:30:12 2025
NAMESPACE: monitoring
STATUS: deployed
REVISION: 1
뭐가 설치됐는지 확인:
$ kubectl get pods -n monitoring
NAME                                                   READY   STATUS    RESTARTS   AGE
prometheus-kube-prometheus-stack-prometheus-0          1/1     Running   0          2m
kube-prometheus-stack-grafana-xxxxx                    3/3     Running   0          2m
kube-prometheus-stack-operator-xxxxx                   1/1     Running   0          2m
alertmanager-kube-prometheus-stack-alertmanager-0      2/2     Running   0          2m
kube-prometheus-stack-kube-state-metrics-xxxxx         1/1     Running   0          2m
prometheus-node-exporter-xxxxx (DaemonSet - 4개)       1/1     Running   0          2m
🎉 성공! 한 줄 명령어로 완전한 모니터링 스택 구축!
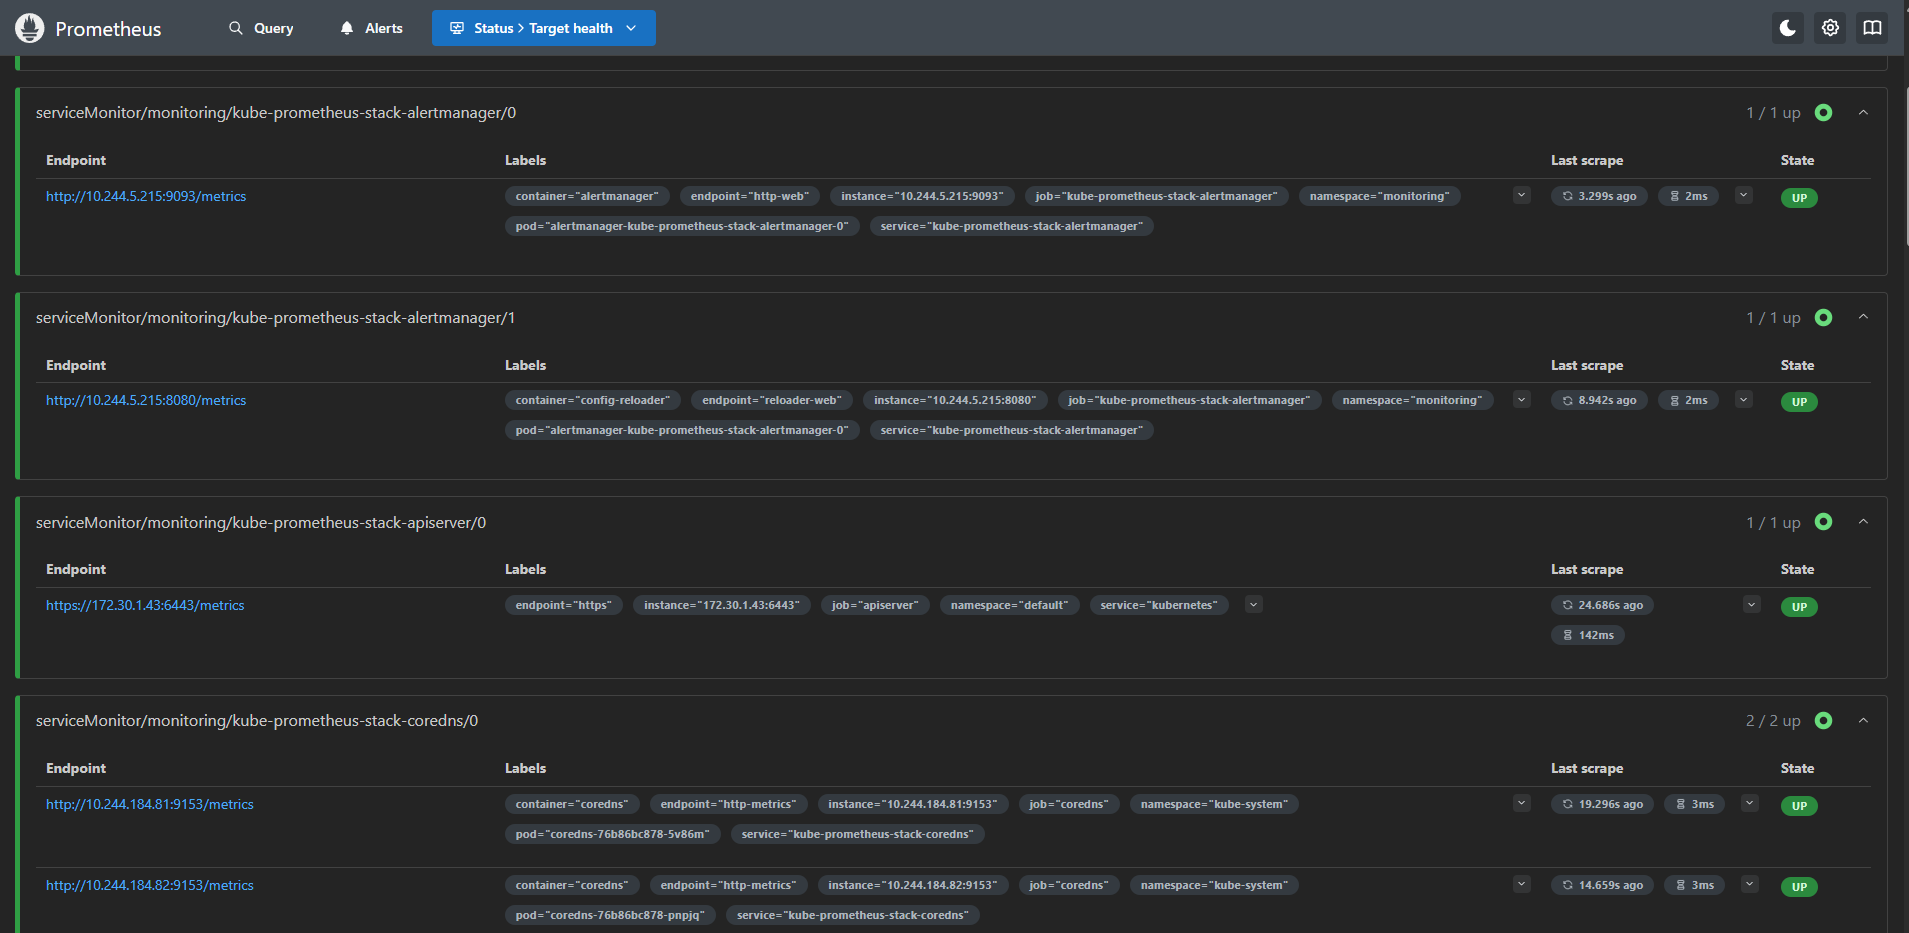
실습 2: Prometheus Targets 확인
Status → Targets 메뉴:
[이미지 1: Prometheus Targets 화면 스크린샷]
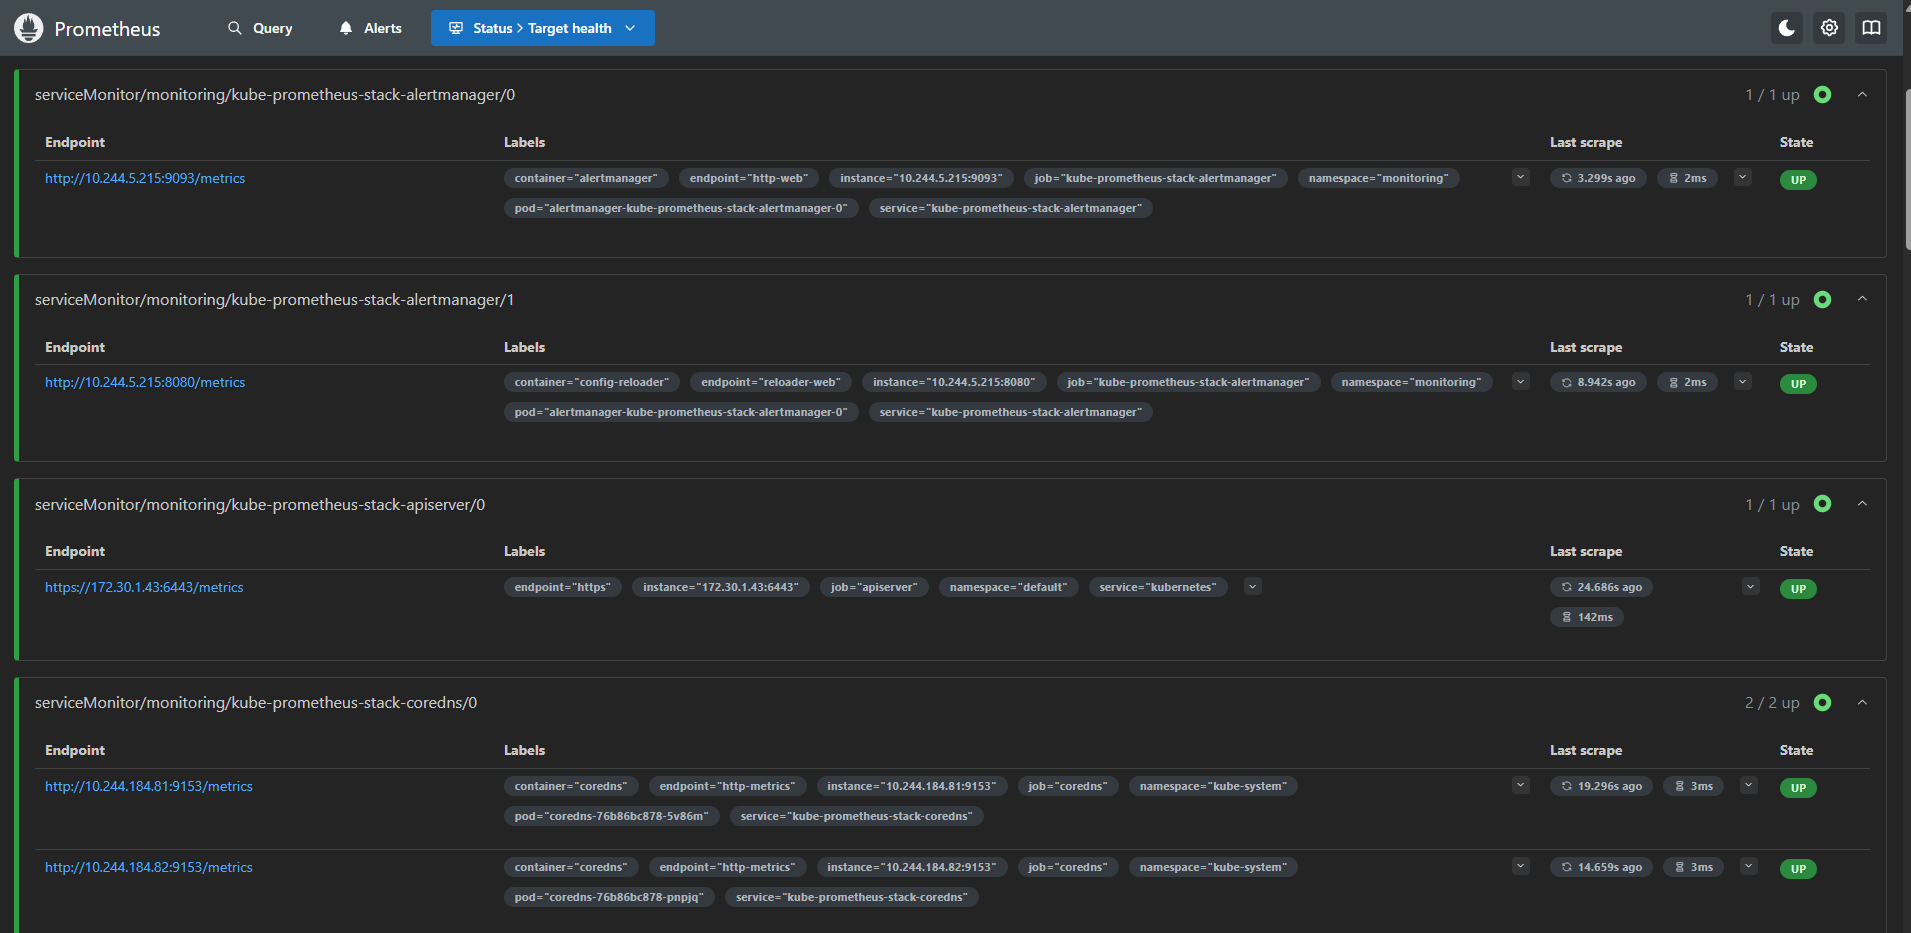
🤔 ServiceMonitor가 뭐지?
- Prometheus Operator의 CRD
- Label Selector로 Service를 찾음
- Service의 Endpoints에서 Pod IP 자동 추출
- 결과: 수동 설정 없이 자동 스케일링 대응!
PromQL 쿼리 테스트:
# 클러스터 전체 Pod 수
count(kube_pod_info)
→ 결과: 42

# Namespace별 Pod 수
count by (namespace) (kube_pod_info)
→ 결과:
  {namespace="default"} 8
  {namespace="monitoring"} 15
  {namespace="kube-system"} 19

# 노드 CPU 사용률
100 - (avg by (instance) (rate(node_cpu_seconds_total{mode="idle"}[5m])) * 100)
→ 결과:
  {instance="172.30.1.43:9100"} 15.3
  {instance="172.30.1.54:9100"} 23.7
  {instance="172.30.1.55:9100"} 18.2
  {instance="172.30.1.56:9100"} 12.1
2. Grafana 대시보드로 시각화
실습 3: Grafana 접속
- Username: admin
- Password: prom-operator
기본 제공 대시보드:
[이미지 2: Grafana 대시보드 목록 스크린샷]
1. Kubernetes / Compute Resources / Cluster
[이미지 3: Cluster Dashboard 스크린샷]
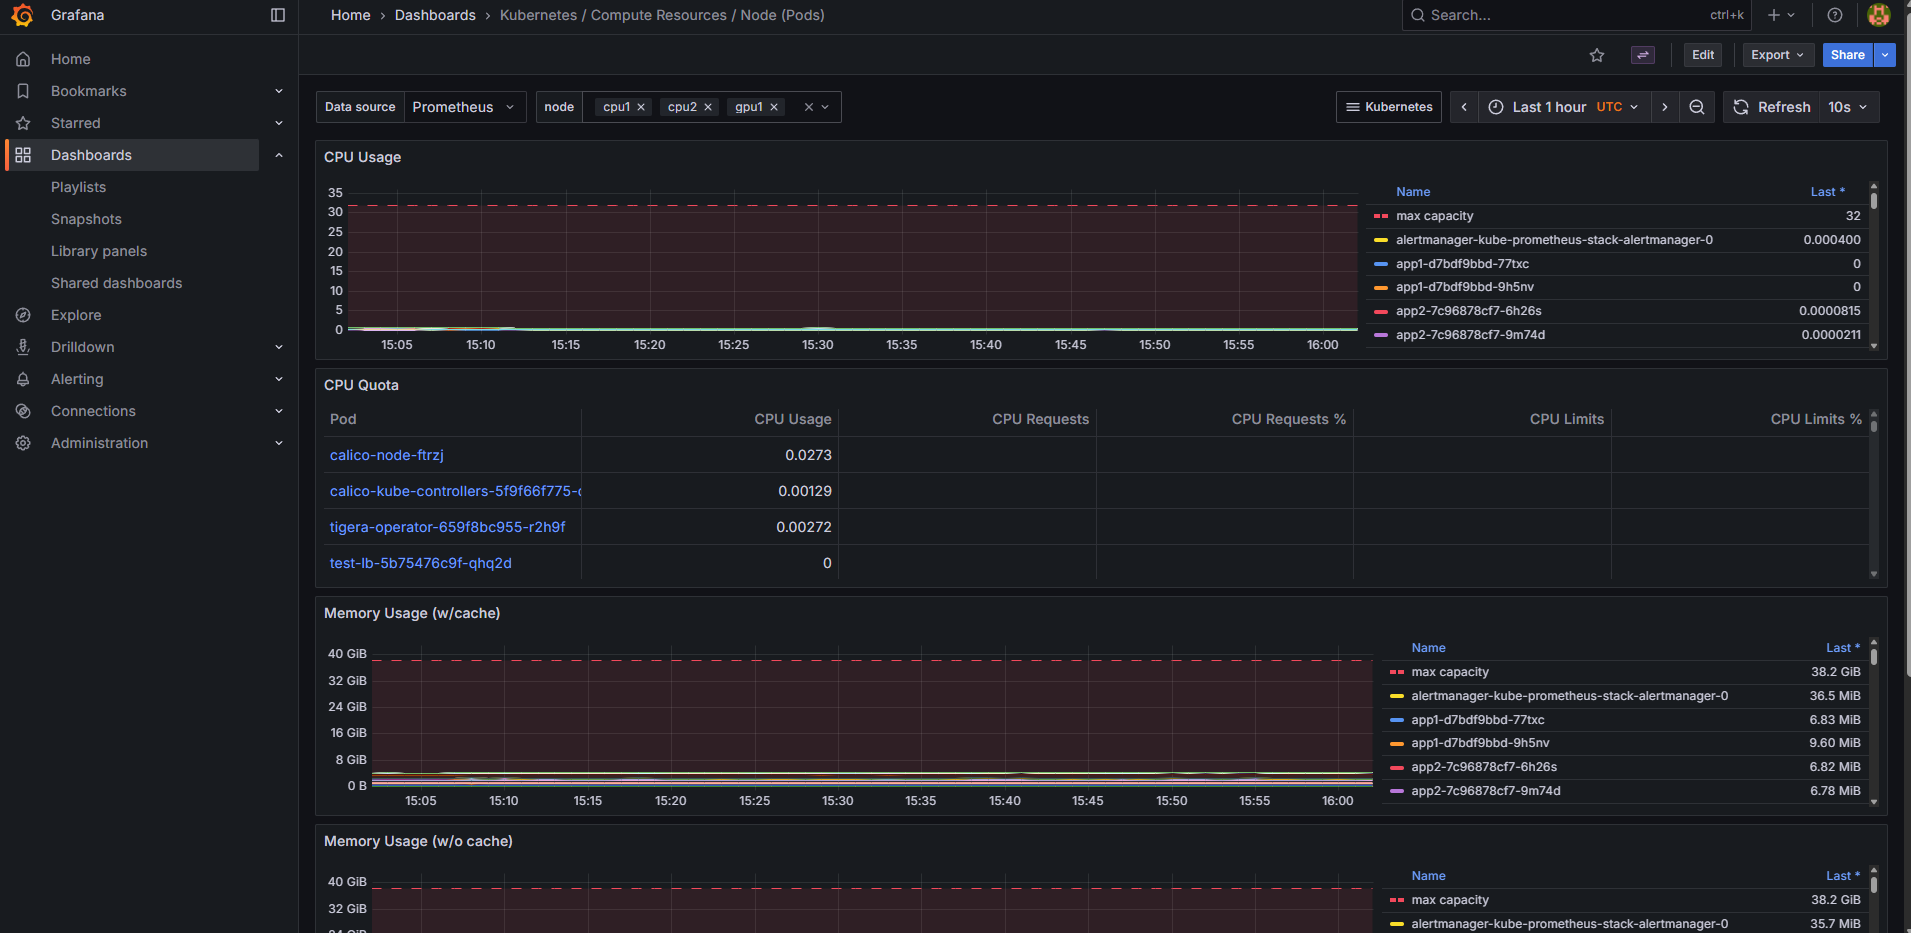

🤔 내가 본 것:
monitoringnamespace가 CPU 25%, 메모리 40% 사용 (Prometheus 스택이 크다!)kube-systemnamespace는 안정적으로 CPU 10% 이하- 네트워크 트래픽이 급증하는 시간대 확인 가능
2. Node Exporter / Nodes
노드별 상세 메트릭:
- CPU 사용률, Load Average
- 메모리 사용량 (Used/Cached/Free)
- 디스크 I/O, 파일시스템 사용률
- 네트워크 트래픽 (eth0 인터페이스)
3. 로깅 시스템 구축 (Vector + OpenSearch)
왜 중앙화된 로깅이 필요한가?
🤔 내가 이해한 것:
- Pod가 재시작되면 로그 사라짐
- 여러 노드에 분산된 로그를 한곳에서 검색해야 함
- 장애 분석 시 시간 순서대로 로그 추적 필요
실습 4: OpenSearch 설치 (단일 노드)
🤔 3중화는 왜 안 했나?
- 오늘은 개념만 배움
- 실제로는 단일 노드(1개)로 설치
- 리소스 절약 및 빠른 테스트 목적
- Production에서는 반드시 3중화 권장!
$ helm repo add opensearch https://opensearch-project.github.io/helm-charts/
$ helm repo update

$ helm install opensearch opensearch/opensearch \
  --namespace monitoring \
  --set service.type=NodePort \
  --set service.nodePort=30920

NAME: opensearch
LAST DEPLOYED: Mon Nov  4 14:45:23 2025
NAMESPACE: monitoring
STATUS: deployed
Pod 확인:
$ kubectl get pods -n monitoring | grep opensearch
opensearch-cluster-master-0   1/1     Running   0          3m
클러스터 헬스 체크:
$ kubectl exec -n monitoring opensearch-cluster-master-0 -- \
  curl -s http://localhost:9200/_cluster/health

{
  "cluster_name": "opensearch-cluster",
  "status": "yellow",  ← 단일 노드라 yellow (복제본 없음)
  "number_of_nodes": 1,
  "active_primary_shards": 5,
  "active_shards": 5,
  "relocating_shards": 0,
  "initializing_shards": 0,
  "unassigned_shards": 5  ← 복제본이 없어서 할당 안 됨
}
💡 OpenSearch 3중화 개념 (향후 적용)
Production 환경에서는:
helm install opensearch opensearch/opensearch \
  --set replicas=3  # ← 이렇게 하면 3개 Pod 배포
3중화의 장점:
- 고가용성: 노드 1개 죽어도 서비스 계속
- 데이터 복제: 각 샤드가 3개 복제본 유지
- 검색 성능: 부하 분산으로 빠른 검색
- 상태: "green" (모든 샤드 정상)
실습 5: OpenSearch Dashboards 설치
$ helm install opensearch-dashboards opensearch/opensearch-dashboards \
  --namespace monitoring \
  --set service.type=NodePort \
  --set service.nodePort=30561 \
  --set opensearchHosts=http://opensearch-cluster-master:9200

$ kubectl get pods -n monitoring | grep dashboards
opensearch-dashboards-xxxxx 1/1 Running 0 1m실습 6: Vector 로그 수집기 배포
Vector가 뭐지?
- Rust로 작성된 고성능 로그 수집기
- Fluent Bit보다 3배 낮은 메모리 사용
- 강력한 데이터 변환 기능
$ helm repo add vector https://helm.vector.dev
$ helm repo update

$ helm install vector vector/vector \
  --namespace monitoring \
  --set role=Agent \
  --set customConfig.data_dir=/vector-data-dir \
  --set customConfig.sources.kubernetes_logs.type=kubernetes_logs \
  --set customConfig.sinks.opensearch.type=elasticsearch \
  --set customConfig.sinks.opensearch.endpoint=http://opensearch-cluster-master:9200 \
  --set customConfig.sinks.opensearch.bulk.index="logs-%Y-%m-%d"

$ kubectl get ds -n monitoring vector
NAME     DESIRED   CURRENT   READY   UP-TO-DATE   AVAILABLE   NODE SELECTOR   AGE
vector   4         4         4       4            4           <none>          2m
DaemonSet이니까 모든 노드(4개)에 배포됨!
Vector 로그 확인 (잘 수집하고 있나?):
$ kubectl logs -n monitoring ds/vector -f
2025-11-04T14:50:12.123Z  INFO vector::sources::kubernetes_logs: Discovered new Pod
2025-11-04T14:50:12.234Z  INFO vector::sinks::elasticsearch: Successfully sent 150 events
2025-11-04T14:50:22.345Z  INFO vector::sinks::elasticsearch: Successfully sent 220 events
Vector Pod 상태 확인:
$ kubectl get pods -n monitoring -l app.kubernetes.io/name=vector
NAME           READY   STATUS    RESTARTS   AGE
vector-7m2fp   1/1     Running   0          5m
vector-9k4hn   1/1     Running   0          5m
vector-d8xqw   1/1     Running   0          5m
vector-p5znc   1/1     Running   0          5m
OpenSearch 인덱스 확인:
$ kubectl exec -n monitoring opensearch-cluster-master-0 -- \
  curl -s 'http://localhost:9200/_cat/indices/logs-*'

yellow open logs-2025-11-04 xxx 1 1  1543 0  1.2mb  1.2mb
인덱스 상세 정보:
$ kubectl exec -n monitoring opensearch-cluster-master-0 -- \
  curl -s 'http://localhost:9200/logs-2025-11-04/_count'

{"count":1543,"_shards":{"total":1,"successful":1,"skipped":0,"failed":0}}
실제 로그 데이터 샘플 조회:
$ kubectl exec -n monitoring opensearch-cluster-master-0 -- \
  curl -s 'http://localhost:9200/logs-2025-11-04/_search?size=1&pretty'

{
  "hits": {
    "total": {"value": 1543},
    "hits": [{
      "_source": {
        "@timestamp": "2025-11-04T14:50:30.123Z",
        "message": "Starting Prometheus metrics server on port 8000",
        "kubernetes": {
          "namespace_name": "default",
          "pod_name": "custom-metrics-app-748gk-xxxxx",
          "container_name": "app",
          "labels": {
            "app": "custom-metrics-app"
          }
        }
      }
    }]
  }
}
로그가 들어오고 있다! 🎉
4. OpenSearch Dashboards에서 로그 검색
실습 7: Index Pattern 생성
OpenSearch Dashboards 접속 후:
[이미지 4: Index Pattern 생성 화면 스크린샷]
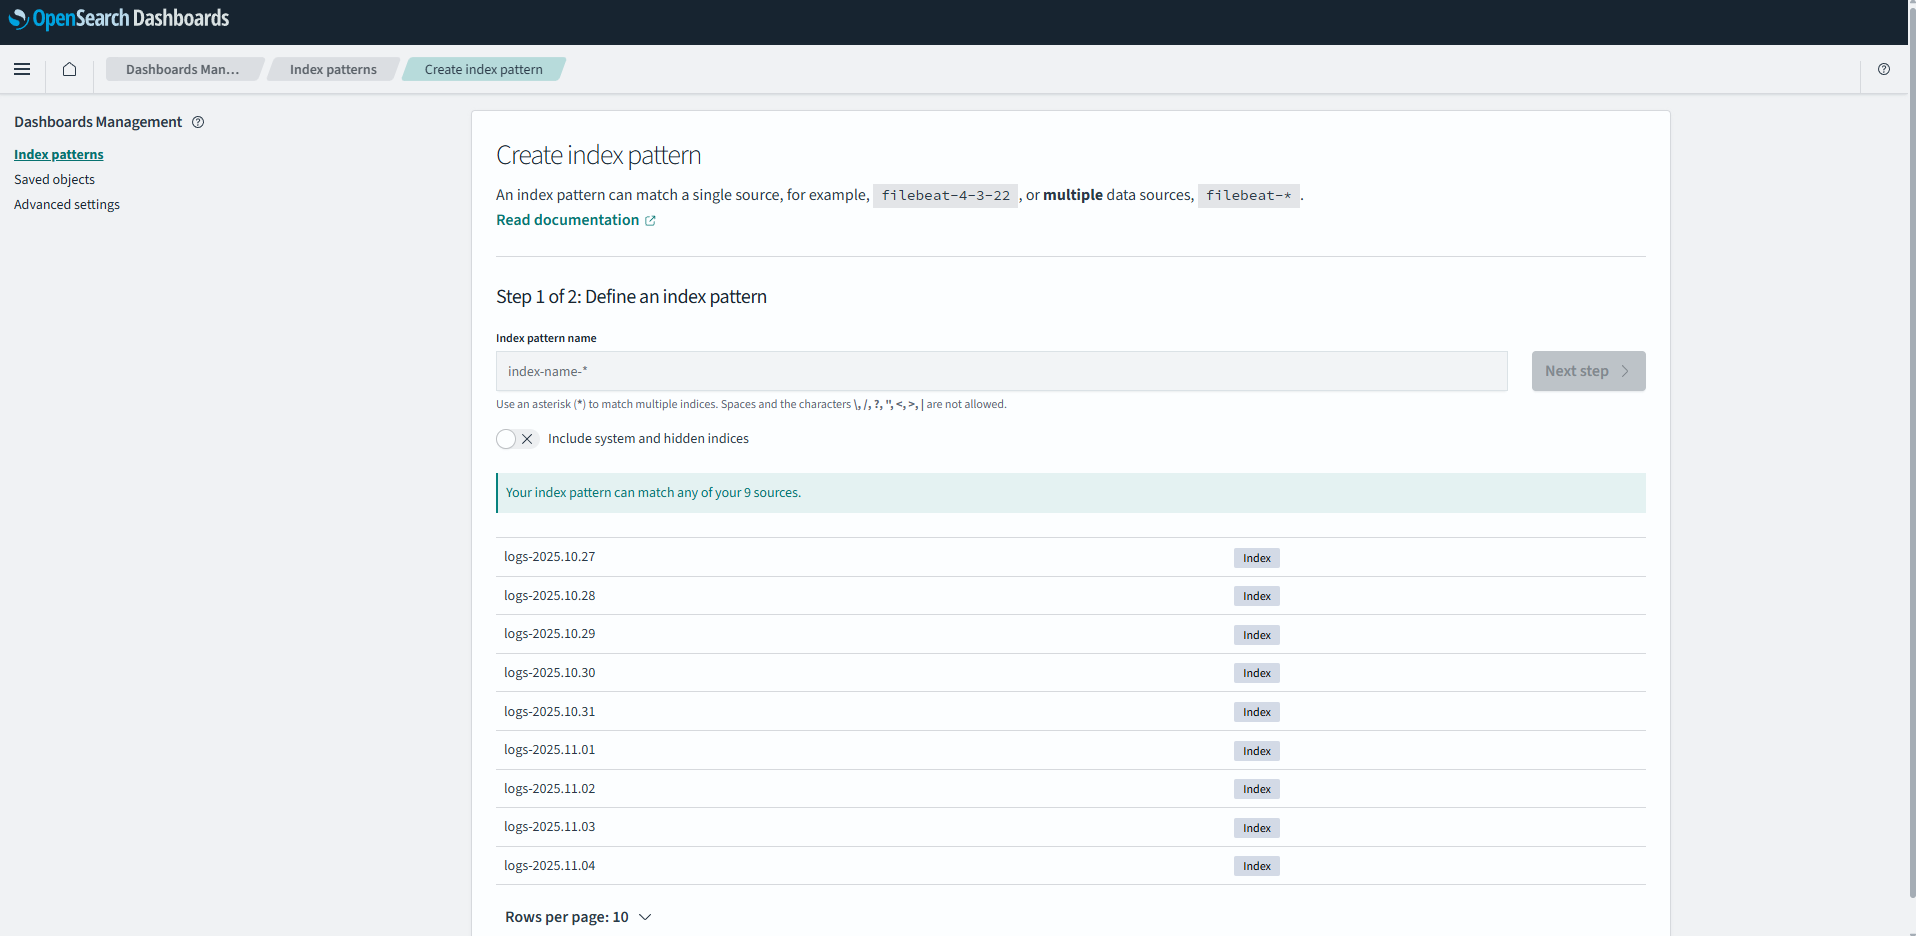
- Management → Index Patterns → Create
- Index pattern name:
logs-* - Time field:
@timestamp - Create!
실습 8: Discover로 로그 검색
[이미지 5: OpenSearch Dashboards Discover 화면 스크린샷]
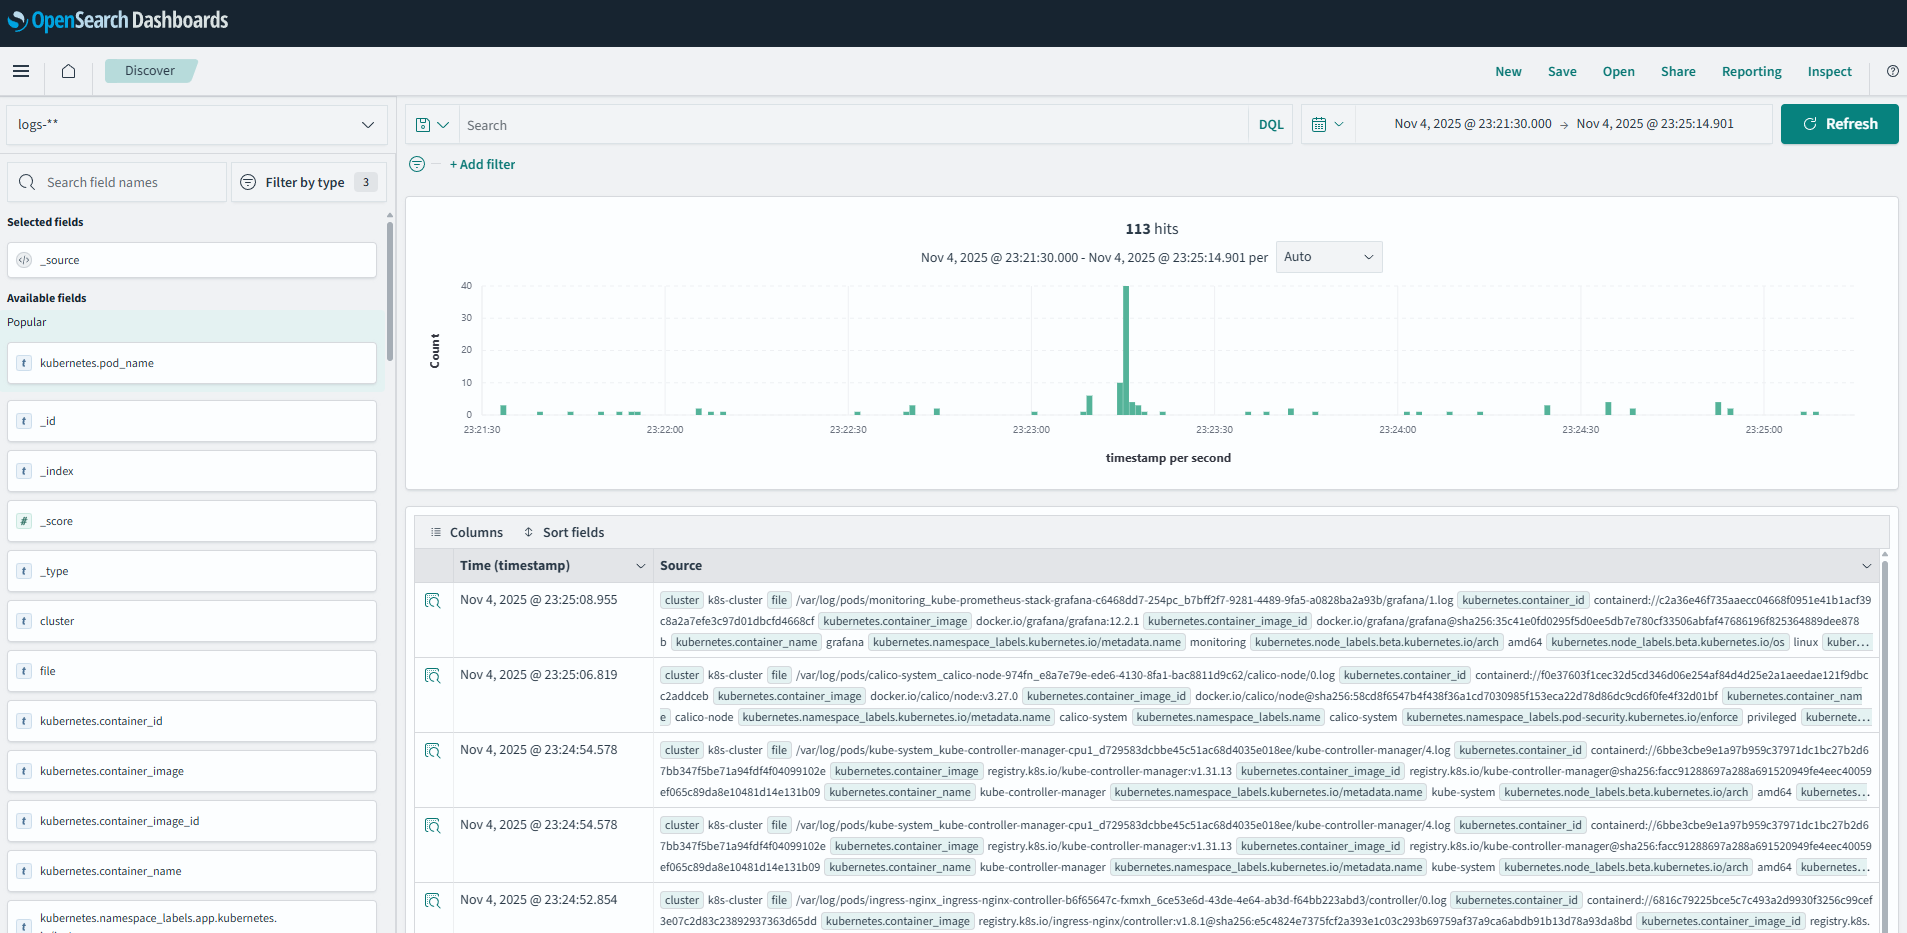
KQL (Kibana Query Language) 검색:
1. 특정 Pod 로그:
kubernetes.pod_name: *prometheus*→ 결과: Prometheus 관련 Pod 로그 15,234건
2. Namespace + 에러 로그:
kubernetes.namespace_name: "monitoring" AND message: *error*→ 결과: monitoring namespace의 에러 로그 23건 발견!
3. 특정 컨테이너 로그:
kubernetes.container_name: "grafana" AND kubernetes.namespace_name: "monitoring"→ 결과: Grafana 컨테이너 로그 3,456건
4. 로그 레벨 필터 (에러만):
kubernetes.namespace_name: "default" AND (message: *ERROR* OR message: *error* OR message: *Error*)→ 결과: default namespace의 에러 로그 12건
5. 여러 Pod 동시 검색:
kubernetes.pod_name: (*vector* OR *opensearch* OR *grafana*)→ 결과: 모니터링 스택 관련 로그 45,678건
6. 특정 시간 이후 로그:
@timestamp >= "2025-11-04T14:00:00"→ 결과: 오후 2시 이후 로그만 표시
7. 복잡한 조합 쿼리:
kubernetes.namespace_name: "monitoring" AND NOT kubernetes.pod_name: *exporter* AND message: *started*→ 결과: monitoring namespace에서 exporter를 제외한 시작 메시지 34건
8. 필드 존재 여부 확인:
_exists_: kubernetes.labels.app AND kubernetes.namespace_name: "default"→ 결과: app 레이블이 있는 default Pod 로그
🤔 내가 느낀 것:
- SQL보다 훨씬 직관적!
- 와일드카드
*로 부분 매칭 - AND/OR/NOT으로 복잡한 쿼리 가능
- GUI로도 쉽게 필터링
_exists_같은 특수 함수 강력함
5. Custom Metrics 애플리케이션 구축
왜 Custom Metrics가 필요한가?
🤔 내가 이해한 것:
- 시스템 메트릭(CPU/메모리)만으로는 부족
- 비즈니스 메트릭이 진짜 중요:
- 주문 수, 결제 금액
- 활성 사용자 수
- 재고 수량
- API 응답 시간
Prometheus 메트릭 타입
1. Counter (증가만 가능)
- 예:
orders_total,requests_total - PromQL:
rate(),increase()함수 사용
2. Gauge (증감 가능)
- 예:
active_users,inventory_stock - PromQL: 직접 값 사용,
avg(),sum()
3. Histogram (분포 측정)
- 예:
api_response_time_seconds - PromQL:
histogram_quantile()함수로 P95/P99 계산
실습 9: Python Flask + Prometheus Client
파일: /tmp/custom-metrics-app.py
from prometheus_client import Counter, Gauge, Histogram, start_http_server
from flask import Flask, jsonify
import random
import time

# 메트릭 정의
orders_total = Counter('orders_total', '총 주문 수', ['status'])
payment_amount_total = Counter('payment_amount_total', '총 결제 금액')
active_users = Gauge('active_users', '현재 활성 사용자 수')
inventory_stock = Gauge('inventory_stock', '재고 수량', ['product'])
api_response_time = Histogram('api_response_time_seconds', 'API 응답 시간', ['endpoint'])

app = Flask(__name__)

@app.route('/order')
def create_order():
    with api_response_time.labels(endpoint='/order').time():
        # 주문 처리 시뮬레이션 (100~500ms)
        time.sleep(random.uniform(0.1, 0.5))

        # 90% 성공, 10% 실패
        status = 'success' if random.random() > 0.1 else 'failed'
        orders_total.labels(status=status).inc()

        # 성공 시 결제 금액 증가
        if status == 'success':
            amount = random.randint(10000, 100000)
            payment_amount_total.inc(amount)

    return jsonify({"status": status})

# 백그라운드 시뮬레이션
def simulate_metrics():
    while True:
        active_users.set(random.randint(50, 200))
        inventory_stock.labels(product='laptop').set(random.randint(10, 100))
        inventory_stock.labels(product='phone').set(random.randint(20, 150))
        inventory_stock.labels(product='tablet').set(random.randint(5, 50))
        time.sleep(10)

if __name__ == '__main__':
    import threading
    # Prometheus 메트릭 서버 (포트 8000)
    start_http_server(8000)

    # 백그라운드 스레드 시작
    threading.Thread(target=simulate_metrics, daemon=True).start()

    # Flask 앱 시작 (포트 5000)
    app.run(host='0.0.0.0', port=5000)
실습 10: Kubernetes Deployment 배포
파일: /tmp/custom-metrics-deploy.yaml
apiVersion: apps/v1
kind: Deployment
metadata:
  name: custom-metrics-app
  namespace: default
spec:
  replicas: 2
  selector:
    matchLabels:
      app: custom-metrics-app
  template:
    metadata:
      labels:
        app: custom-metrics-app
    spec:
      containers:
      - name: app
        image: python:3.9-slim
        command: ["/bin/bash", "-c"]
        args:
        - |
          pip install flask==2.3.0 prometheus_client==0.17.0 > /dev/null 2>&1
          mkdir -p /app
          cat > /app/app.py << 'EOF'
          # (위 Python 코드)
          EOF
          python /app/app.py
        ports:
        - containerPort: 5000
          name: http
        - containerPort: 8000
          name: metrics
Service YAML (같은 파일에 포함):
---
apiVersion: v1
kind: Service
metadata:
  name: custom-metrics-app
  namespace: default
  labels:
    app: custom-metrics-app
spec:
  type: ClusterIP
  ports:
  - port: 5000
    targetPort: 5000
    name: http
  - port: 8000
    targetPort: 8000
    name: metrics
  selector:
    app: custom-metrics-app
---
apiVersion: monitoring.coreos.com/v1
kind: ServiceMonitor
metadata:
  name: custom-metrics-app
  namespace: default
  labels:
    app: custom-metrics-app
spec:
  selector:
    matchLabels:
      app: custom-metrics-app
  endpoints:
  - port: metrics
    interval: 15s
    path: /metrics
배포:
$ kubectl apply -f /tmp/custom-metrics-deploy.yaml
deployment.apps/custom-metrics-app created
service/custom-metrics-app created
servicemonitor.monitoring.coreos.com/custom-metrics-app created
😱 문제 발생!
$ kubectl get pods -l app=custom-metrics-app
NAME                                  READY   STATUS             RESTARTS   AGE
custom-metrics-app-748gk-xxxxx        0/2     CrashLoopBackOff   3          2m
🔧 문제 해결 1: Pod CrashLoopBackOff
로그 확인:
$ kubectl logs custom-metrics-app-748gk-xxxxx --previous
/bin/bash: line 2: /app/app.py: No such file or directory
🤔 왜 그럴까?
- Python 3.9 slim 이미지에는
/app디렉토리가 없음! cat > /app/app.py가 실패
해결책:
args:
- |
  pip install flask==2.3.0 prometheus_client==0.17.0 > /dev/null 2>&1
  mkdir -p /app  # ← 이 줄 추가!
  cat > /app/app.py << 'EOF'
  # ...
  EOF
  python /app/app.py
재배포:
$ kubectl delete deployment custom-metrics-app
$ kubectl apply -f /tmp/custom-metrics-deploy.yaml

$ kubectl get pods -l app=custom-metrics-app
NAME                                  READY   STATUS    RESTARTS   AGE
custom-metrics-app-748gk-xxxxx        2/2     Running   0          30s
custom-metrics-app-849hl-yyyyy        2/2     Running   0          30s
✅ 성공! 2개 Pod 모두 Running!
Service와 Endpoints 확인:
$ kubectl get svc custom-metrics-app
NAME                 TYPE        CLUSTER-IP      EXTERNAL-IP   PORT(S)             AGE
custom-metrics-app   ClusterIP   10.96.123.45    <none>        5000/TCP,8000/TCP   2m

$ kubectl get endpoints custom-metrics-app
NAME                 ENDPOINTS                                   AGE
custom-metrics-app   10.244.102.188:5000,10.244.58.147:5000,...  2m
ServiceMonitor 확인:
$ kubectl get servicemonitor custom-metrics-app
NAME                 AGE
custom-metrics-app   2m

$ kubectl describe servicemonitor custom-metrics-app
Name:         custom-metrics-app
Namespace:    default
Labels:       app=custom-metrics-app
Spec:
  Endpoints:
    Interval:  15s
    Path:      /metrics
    Port:      metrics
  Selector:
    Match Labels:
      app:  custom-metrics-app
메트릭 엔드포인트 직접 확인:
$ kubectl run test-metrics --image=curlimages/curl:7.85.0 --rm -i --restart=Never -- \
  curl -s http://custom-metrics-app:8000/metrics | head -20

# HELP orders_total 총 주문 수
# TYPE orders_total counter
orders_total{status="success"} 234.0
orders_total{status="failed"} 26.0
# HELP payment_amount_total 총 결제 금액
# TYPE payment_amount_total counter
payment_amount_total 15823000.0
# HELP active_users 현재 활성 사용자 수
# TYPE active_users gauge
active_users 127.0
# HELP inventory_stock 재고 수량
# TYPE inventory_stock gauge
inventory_stock{product="laptop"} 45.0
inventory_stock{product="phone"} 123.0
inventory_stock{product="tablet"} 23.0
✅ 메트릭이 정상적으로 노출되고 있다!
실습 11: Prometheus에서 메트릭 확인
Prometheus UI에서 쿼리:
[이미지 6: Prometheus Custom Metrics Target 스크린샷]

PromQL 쿼리 테스트:
# 1. 총 주문 수
orders_total
→ orders_total{status="success"} 1234
→ orders_total{status="failed"} 138

# 2. 성공 주문의 분당 증가율
rate(orders_total{status="success"}[5m]) * 60
→ 12.3 (분당 12.3개 주문)

# 3. 평균 활성 사용자
avg(active_users)
→ 127.5

# 4. 총 결제 금액
sum(payment_amount_total)
→ 45,823,000 (4천5백만원!)

# 5. 주문 성공률 (백분율)
sum(rate(orders_total{status="success"}[5m])) / sum(rate(orders_total[5m])) * 100
→ 89.88 (약 90%)

# 6. API 응답 시간 P95 (95번째 백분위수)
histogram_quantile(0.95, rate(api_response_time_seconds_bucket{endpoint="/order"}[5m]))
→ 0.487 (487ms)

# 7. API 응답 시간 P99 (99번째 백분위수)
histogram_quantile(0.99, rate(api_response_time_seconds_bucket{endpoint="/order"}[5m]))
→ 0.498 (498ms)

# 8. 1분당 결제 금액
rate(payment_amount_total[1m]) * 60
→ 758,234 (1분에 75만원!)

# 9. 재고가 50개 이하인 상품
inventory_stock < 50
→ inventory_stock{product="tablet"} 23
6. Grafana Custom Dashboard 생성
실습 12: ConfigMap으로 대시보드 자동 프로비저닝
🤔 왜 ConfigMap을 쓰는가?
- Grafana UI에서 수동으로 만들면 재배포 시 사라짐
- Infrastructure as Code: YAML로 관리
- GitOps 친화적
파일: /tmp/custom-metrics-dashboard.yaml
apiVersion: v1
kind: ConfigMap
metadata:
  name: custom-metrics-dashboard
  namespace: monitoring
  labels:
    grafana_dashboard: "1"  # ← 이 레이블이 핵심!
data:
  custom-metrics-dashboard.json: |
    {
      "title": "Custom Business Metrics",
      "tags": ["custom", "business"],
      "refresh": "10s",
      "panels": [
        {
          "id": 1,
          "title": "총 주문 수 (성공/실패)",
          "type": "graph",
          "gridPos": {"x": 0, "y": 0, "w": 12, "h": 8},
          "targets": [
            {
              "expr": "rate(orders_total{status=\"success\"}[5m]) * 60",
              "legendFormat": "성공 (주문/분)",
              "refId": "A"
            },
            {
              "expr": "rate(orders_total{status=\"failed\"}[5m]) * 60",
              "legendFormat": "실패 (주문/분)",
              "refId": "B"
            }
          ],
          "yaxes": [
            {"format": "short", "label": "주문/분"},
            {"format": "short"}
          ]
        },
        {
          "id": 2,
          "title": "총 결제 금액 (원)",
          "type": "stat",
          "gridPos": {"x": 12, "y": 0, "w": 6, "h": 4},
          "targets": [
            {
              "expr": "sum(payment_amount_total)",
              "refId": "A"
            }
          ],
          "options": {
            "graphMode": "area",
            "colorMode": "value"
          },
          "fieldConfig": {
            "defaults": {
              "unit": "currencyKRW",
              "decimals": 0
            }
          }
        },
        {
          "id": 3,
          "title": "현재 활성 사용자",
          "type": "gauge",
          "gridPos": {"x": 18, "y": 0, "w": 6, "h": 4},
          "targets": [
            {
              "expr": "avg(active_users)",
              "refId": "A"
            }
          ],
          "options": {
            "showThresholdLabels": false,
            "showThresholdMarkers": true
          },
          "fieldConfig": {
            "defaults": {
              "min": 0,
              "max": 300,
              "thresholds": {
                "steps": [
                  {"value": 0, "color": "green"},
                  {"value": 150, "color": "yellow"},
                  {"value": 200, "color": "red"}
                ]
              }
            }
          }
        },
        {
          "id": 7,
          "title": "주문 성공률",
          "type": "stat",
          "gridPos": {"x": 0, "y": 16, "w": 8, "h": 4},
          "targets": [
            {
              "expr": "sum(rate(orders_total{status=\"success\"}[5m])) / sum(rate(orders_total[5m])) * 100",
              "refId": "A"
            }
          ],
          "options": {
            "graphMode": "none",
            "colorMode": "value"
          },
          "fieldConfig": {
            "defaults": {
              "unit": "percent",
              "decimals": 1,
              "thresholds": {
                "steps": [
                  {"value": 0, "color": "red"},
                  {"value": 90, "color": "yellow"},
                  {"value": 95, "color": "green"}
                ]
              }
            }
          }
        }
      ]
    }
배포:
$ kubectl apply -f /tmp/custom-metrics-dashboard.yaml
configmap/custom-metrics-dashboard created
😱 문제 발생 (또!)
$ kubectl logs -n monitoring deployment/kube-prometheus-stack-grafana -c grafana
logger=provisioning.dashboard error="Dashboard title cannot be empty"
Grafana UI에 대시보드가 안 나타남!
🔧 문제 해결 2: Dashboard title cannot be empty
원인 파악:
처음에 이렇게 작성했었음:
{
  "dashboard": {  // ← 이 래퍼가 문제!
    "title": "Custom Business Metrics",
    "panels": [...]
  },
  "overwrite": true
}
Grafana는 최상위에 title 필드를 기대하는데, dashboard 래퍼로 감싸져 있어서 못 찾음!
올바른 구조:
{
  "title": "Custom Business Metrics",  // ← 최상위!
  "tags": ["custom", "business"],
  "panels": [...]
}
수정 및 재배포:
$ kubectl apply -f /tmp/custom-metrics-dashboard.yaml
configmap/custom-metrics-dashboard configured
Sidecar 컨테이너 로그 확인 (ConfigMap 감지):
$ kubectl logs -n monitoring deployment/kube-prometheus-stack-grafana -c grafana-sc-dashboard
INFO  Received File list: /tmp/dashboards
INFO  Retrieving ConfigMap custom-metrics-dashboard in namespace monitoring
INFO  Found 1 dashboard(s) in ConfigMap custom-metrics-dashboard
INFO  Writing dashboard custom-metrics-dashboard.json to /tmp/dashboards/custom-metrics-dashboard.json
Grafana 메인 컨테이너 로그 확인 (대시보드 로드):
$ kubectl logs -n monitoring deployment/kube-prometheus-stack-grafana -c grafana | tail -10
logger=provisioning.dashboard level=info msg="starting to provision dashboards"
logger=provisioning.dashboard level=info msg="finished to provision dashboards"
logger=dashboard.provisioning level=info msg="Inserted dashboard" title="Custom Business Metrics" id=42 path=/tmp/dashboards/custom-metrics-dashboard.json
ConfigMap이 파일로 생성되었는지 확인:
$ kubectl exec -n monitoring deployment/kube-prometheus-stack-grafana -c grafana -- \
  ls -lh /tmp/dashboards/

total 4.0K
-rw-r--r-- 1 grafana grafana 3.2K Nov  4 15:12 custom-metrics-dashboard.json
대시보드 개수 확인:
$ kubectl exec -n monitoring deployment/kube-prometheus-stack-grafana -c grafana -- \
  ls /tmp/dashboards/*.json | wc -l
1
에러 없음! ✅
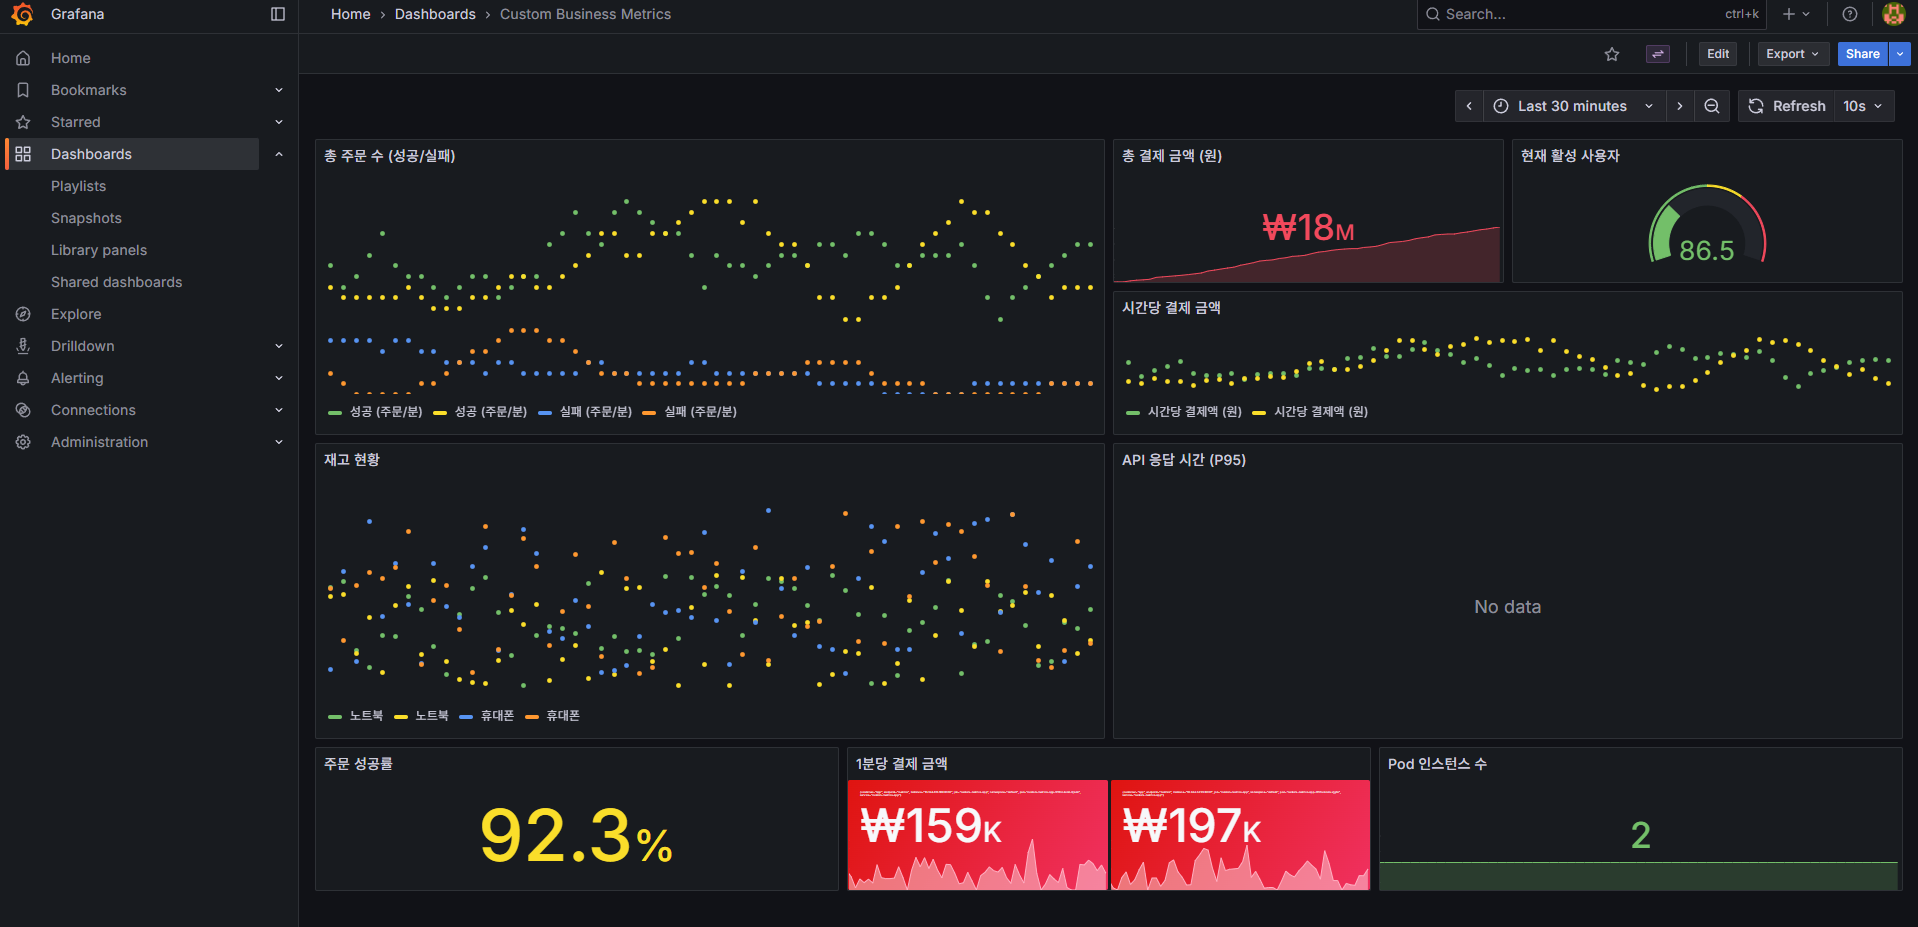
실습 13: Grafana에서 대시보드 확인
Grafana UI → Dashboards → Browse → "Custom Business Metrics"
[이미지 7: Grafana Custom Metrics Dashboard 전체 화면 스크린샷]
7. 전체 아키텍처 정리
🤔 내가 이해한 전체 그림:
┌─────────────────────────────────────────────────────────┐
│                    모니터링 스택                        │
├─────────────────────────────────────────────────────────┤
│                                                         │
│  Custom Metrics App (2 Pods)                           │
│    ├─ Flask API (port 5000)                            │
│    └─ Prometheus Metrics (port 8000) /metrics          │
│              ↓                                          │
│  ServiceMonitor (CRD)                                   │
│    └─ Label Selector로 Service 발견                    │
│              ↓                                          │
│  Prometheus (Pull 방식)                                │
│    ├─ 15초마다 메트릭 수집                             │
│    ├─ TSDB에 저장                                      │
│    └─ PromQL로 쿼리                                    │
│              ↓                                          │
│  Grafana                                                │
│    ├─ Prometheus를 Data Source로 연결                 │
│    ├─ ConfigMap으로 Dashboard 자동 로드               │
│    └─ 웹 UI로 시각화                                   │
└─────────────────────────────────────────────────────────┘

┌─────────────────────────────────────────────────────────┐
│                    로깅 스택                            │
├─────────────────────────────────────────────────────────┤
│                                                         │
│  모든 Pod (모든 Namespace)                             │
│    └─ stdout/stderr 로그                               │
│              ↓                                          │
│  Kubelet (/var/log/pods/)                              │
│              ↓                                          │
│  Vector (DaemonSet - 4개 노드)                         │
│    ├─ 로그 수집 및 파싱                                │
│    ├─ JSON 변환                                        │
│    └─ Bulk API로 전송                                  │
│              ↓                                          │
│  OpenSearch (단일 노드)                                │
│    ├─ logs-YYYY-MM-DD 인덱스                           │
│    ├─ status: yellow (복제본 없음)                    │
│    └─ Production에서는 3중화 권장                      │
│              ↓                                          │
│  OpenSearch Dashboards                                  │
│    ├─ Index Pattern: logs-*                            │
│    ├─ KQL로 로그 검색                                  │
│    └─ 웹 UI로 시각화                                   │
└─────────────────────────────────────────────────────────┘
8. 배운 점과 느낀 점
기술적 인사이트
1. ServiceMonitor의 강력함
🤔 내가 깨달은 것:
- CRD 기반 자동화가 진짜 Kubernetes다움
- Label Selector 하나로 동적 스케일링 대응
- Operator Pattern의 실전 예시
2. Sidecar 패턴의 우아함
Grafana가 ConfigMap을 감지하는 방식:
ConfigMap (label: grafana_dashboard="1")
    ↓
Sidecar Container (감시)
    ↓
/tmp/dashboards/에 파일 생성
    ↓
Grafana Main Container (자동 로드)
관심사 분리가 완벽!
3. Vector의 효율성
Rust로 작성되어:
- Fluent Bit 대비 메모리 사용량 1/3
- CPU 사용량도 낮음
- 복잡한 변환 로직 가능
4. OpenSearch 3중화의 중요성
# 클러스터 헬스
"status": "green"  # 3개 노드 모두 정상
"active_shards": 15  # 각 샤드가 3개씩 복제

# 노드 1개 죽어도:
"status": "yellow"  # 검색은 계속 가능
# 노드 2개 죽어야:
"status": "red"  # 일부 데이터 손실
고가용성 확보!
실전 팁
1. Pod 문제 디버깅 순서
kubectl get pods  # 상태 확인
kubectl describe pod <pod>  # 이벤트 확인
kubectl logs <pod>  # 로그 확인
kubectl logs <pod> --previous  # 이전 실행 로그 (CrashLoopBackOff 시)
2. JSON 구조 검증
# jq로 구조 확인
kubectl get cm <name> -o json | jq '.data | keys'

# 다른 정상 리소스와 비교
kubectl get cm <working-dashboard> -o json | jq '.data."xxx.json" | fromjson | keys'
3. 메트릭 설계 원칙
- Counter: 절대 감소하지 않는 값 (
rate()함수 사용) - Gauge: 현재 상태를 나타내는 값
- Histogram: 분포를 측정하려면 (bucket 설정 중요)
- Label cardinality: Label 값이 너무 많으면 성능 저하!
4. ConfigMap 변경 후 확인
# ConfigMap 업데이트
kubectl apply -f dashboard.yaml

# Sidecar 로그 확인 (파일 생성 확인)
kubectl logs -n monitoring deploy/grafana -c grafana-sc-dashboard

# Grafana 로그 확인 (로드 성공 확인)
kubectl logs -n monitoring deploy/grafana -c grafana
실수했던 것들
1. /app 디렉토리 없음
- Python 이미지에 디렉토리가 없을 수 있음
mkdir -p로 먼저 생성!
2. JSON 구조 잘못
- Grafana는
"dashboard": {}래퍼를 싫어함 - 최상위에
"title"필드 필수!
3. Label 오타
grafana_dashboard: "1"← 정확히 이렇게!- 대소문자, 언더스코어 주의
정리 및 다음 단계
오늘 완성한 것
✅ 모니터링 스택
- Prometheus + Grafana로 메트릭 수집 및 시각화
- Custom Metrics 애플리케이션 구현
- ServiceMonitor로 자동 타겟 디스커버리
- ConfigMap으로 대시보드 자동 프로비저닝
✅ 로깅 스택
- Vector DaemonSet으로 전체 노드 로그 수집 (4개 노드)
- OpenSearch 단일 노드 구축 (3중화는 개념만 학습)
- OpenSearch Dashboards로 로그 검색 및 시각화
- KQL로 복잡한 로그 쿼리 (8가지 패턴)
최종 검증 체크리스트
- Prometheus UI 접속 가능 (http://172.30.1.43:30090)
- Prometheus Targets 모두 UP 상태
- Grafana 접속 및 로그인 성공 (admin/prom-operator)
- Grafana 기본 대시보드 정상 표시
- OpenSearch 1개 Pod Running (단일 노드, status: yellow)
- OpenSearch Dashboards 접속 가능
- OpenSearch에서 로그 검색 가능 (
logs-*인덱스) - Vector DaemonSet 4개 Pod Running (각 노드당 1개)
- Custom Metrics App 2개 Pod Running
- Prometheus에서 Custom Metrics 수집 확인 (2개 Target UP)
- Grafana Custom Dashboard 정상 표시
Day 7 예고: Ceph 분산 스토리지
다음에 배울 것:
- Rook Operator로 Ceph 클러스터 구축
- RBD (Block Storage) 사용
- CephFS (Shared File System) 구성
- Object Storage (S3 호환) 설정
- 스토리지 클래스와 PVC 동적 프로비저닝
왜 Ceph를 배우는가?
- StatefulSet에 영구 스토리지 필요
- hostPath는 노드 종속적 (HA 불가능)
- Ceph = Kubernetes 네이티브 분산 스토리지
- Block/File/Object 모두 지원
참고 자료
- Prometheus 공식 문서
- kube-prometheus-stack Helm Chart
- OpenSearch 문서
- Vector 문서
- Grafana Dashboard Best Practices
- PromQL Cheat Sheet
Day 6 완료! 🎉
이제 클러스터를 완벽하게 관찰(Observe) 할 수 있습니다:
- Metrics (Prometheus + Grafana)
- Logs (Vector + OpenSearch)
- Custom Business Metrics (주문, 결제, 재고 등)
다음은 Storage 정복! 💪