
alertmanager

https://github.com/prometheus/alertmanager.git
AlertManager로 Discord Bot 모니터링 알림 시스템 구축하기
프로젝트에서 Discord Bot의 모니터링 시스템을 완성하기 위해 AlertManager를 도입했다. Prometheus로 메트릭을 수집하고, Grafana로 시각화한 다음, 마지막으로 AlertManager를 통해 실시간 알림 시스템을 구축했습니다.
AlertManager?
Discord Bot이 24시간 안정적으로 돌아가는지 확인하려면 계속 모니터링해야 하는데, 사람이 24시간 대시보드를 지켜볼 수는 없다. 이 부분을 AlertManager를 통해 자동으로 알림이 오도록 설정했다.
- Discord Bot 다운: 1분 이상 응답 없음
- 높은 에러율: 에러 카운트가 5개 초과
- Pod 재시작: Kubernetes에서 Pod가 재시작됨
- 응답 지연: 메시지 처리 시간이 너무 오래 걸림
실제 구현된 아키텍처
전체적인 모니터링 시스템의 구조는 다음과 같다:
- Discord Bot → Prometheus (메트릭 수집)
- Prometheus → AlertManager (Alert Rules 적용)
- AlertManager → Slack (Webhook 알림)
Flask 서버에서는 3개의 엔드포인트를 제공한다:
/metrics(8000 포트): Prometheus가 메트릭 수집/health: 헬스체크용/test-error: 테스트용 에러 발생
Discord Bot에서 수집하는 실제 메트릭들
Discord Bot에서 다음 메트릭들을 실시간으로 수집한다:
핵심 메트릭
# 명령어 실행 통계 (성공/실패 구분)
discord_bot_commands_total{command="ping", status="success"} 45
discord_bot_commands_total{command="add", status="success"} 31
discord_bot_commands_total{command="roll", status="success"} 3

# 메시지 처리 시간
discord_bot_message_latency_seconds_bucket{le="0.1"} 42
discord_bot_message_latency_seconds_bucket{le="0.5"} 78

# 전송한 메시지 수
discord_bot_messages_sent_total 79

# 에러 발생 횟수 (타입별)
discord_bot_errors_total{error_type="command_error"} 2
discord_bot_errors_total{error_type="startup"} 0

# 봇 상태 확인 (하트비트)
discord_bot_heartbeat_timestamp_seconds 1717084523

# 서버 및 사용자 통계
discord_bot_active_guilds 1
discord_bot_active_users 5
특별한 테스트 엔드포인트
모니터링 시스템을 테스트하기 위해 의도적으로 에러를 발생시키는 엔드포인트도 만들었습니다:
@app.route('/test-error')
def test_error():
    """테스트용 에러 발생"""
    metrics.error_count.labels(error_type='test_error').inc()
    logging.error("Test error triggered via /test-error endpoint")
    return {"status": "error", "message": "Test error generated"}, 500

@app.route('/test-crash')
def test_crash():
    """테스트용 크래시 시뮬레이션"""
    metrics.error_count.labels(error_type='crash_simulation').inc()
    logging.critical("Crash simulation triggered")
    raise Exception("Simulated crash for testing alerts")
AlertManager 설정 과정
1. Slack Webhook을 Kubernetes Secret으로 보안 설정
처음에는 AlertManager 설정에 Slack webhook URL을 평문으로 넣었는데, 보안상 문제가 있어서 Kubernetes Secret으로 분리했습니다:
# slack-webhook-secret.yaml
apiVersion: v1
kind: Secret
metadata:
  name: slack-webhook-secret
  namespace: monitoring
type: Opaque
data:
  webhook-url: aHR0cHM6Ly9ob29rcy5zbGFjay5jb20vc2VydmljZXMvVDA4UUJMTlVUQjQvQjA4VUZQUzVRVEQvVEdBSnBza3B6cXU2TUNPRVM4OGVKMklX
2. AlertManager 설정 - 실제 운영 중인 설정
# alertmanager-configmap.yaml
global:
  slack_api_url_file: '/etc/slack-secrets/webhook-url'

route:
  receiver: 'default'
  group_by: ['alertname', 'cluster', 'service']
  group_wait: 10s
  group_interval: 5m
  repeat_interval: 12h
  routes:
  - match:
      alertname: DiscordBotHighErrors
    receiver: 'discord-bot-critical'
    repeat_interval: 30m
  - match:
      alertname: DiscordBotDown
    receiver: 'discord-bot-critical'
    repeat_interval: 15m

receivers:
- name: 'discord-bot-critical'
  slack_configs:
  - channel: 'C08QCUMR0GL'  # 실제 사용 중인 채널 ID
    send_resolved: true
    username: "Discord Bot Alert"
    icon_emoji: ":robot_face:"
    color: 'danger'
    title: "🚨 Discord Bot Alert: {{ .GroupLabels.alertname }}"
    text: |
      {{ range .Alerts }}
      *Summary:* {{ .Annotations.summary }}
      *Description:* {{ .Annotations.description }}
      *Started:* {{ .StartsAt.Format "2006-01-02 15:04:05" }}
      {{ end }}
3. Prometheus Alert Rules - 실제 동작하는 규칙들
# prometheus-rules-configmap.yaml
groups:
- name: discord-bot-alerts
  rules:
  - alert: DiscordBotHighErrors
    expr: discord_bot_errors_total > 5
    for: 30s
    labels:
      severity: critical
      service: discord-bot
    annotations:
      summary: "Discord Bot high error count"
      description: "Error count is {{ $value }}"

  - alert: DiscordBotDown
    expr: up{job="discord-bot"} == 0
    for: 1m
    labels:
      severity: critical
      service: discord-bot
    annotations:
      summary: "Discord Bot is down"
      description: "Discord Bot has been down for more than 1 minute"
실제 배포 과정
Step 1: Secret 생성
# 실제 webhook URL을 Base64로 인코딩
echo -n "https://hooks.slack.com/services/YOUR/WEBHOOK/URL" | base64

# Secret 적용
kubectl apply -f k8s/monitoring/slack-bot/slack-webhook-secret.yaml
Step 2: AlertManager 배포
kubectl apply -f k8s/monitoring/alertmanager/alertmanager-configmap.yaml
kubectl apply -f k8s/monitoring/alertmanager/alertmanager-deployment.yaml
kubectl apply -f k8s/monitoring/alertmanager/alertmanager-service.yaml
Step 3: Prometheus Rules 적용
kubectl apply -f k8s/monitoring/prometheus/prometheus-rules-configmap.yaml
kubectl rollout restart deployment/prometheus -n monitoring
실제 테스트 결과
테스트 1: Bot 다운 시뮬레이션
# Discord Bot Pod 강제 삭제
kubectl delete pod -l app=discord-bot

# 1분 후 Slack에 도착한 알림:
실제 받은 Slack 알림:
Discord Bot Alert: DiscordBotDown
Summary: Discord Bot is down
Description: Discord Bot has been down for more than 1 minute
Started: 2025-05-30 15:42:33
테스트 2: 인위적 에러 발생
# 테스트 에러 엔드포인트 호출
curl http://localhost:8000/test-error

# 6번 호출하여 임계값(5) 초과
for i in {1..6}; do curl http://localhost:8000/test-error; done

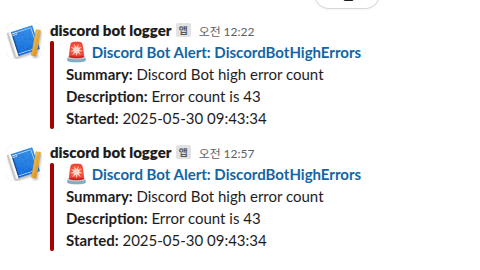
# 30초 후 알림 도착!
실제 받은 Slack 알림
실제 운영 통계 (일주일)
현재까지 실제로 받은 알림들:
알림 발생 현황
- 총 알림: 12개
- DiscordBotDown: 4회 (Jenkins 재배포 시)
- DiscordBotHighErrors: 2회 (테스트 중 발생)
- Pod 재시작: 1회 (메모리 부족)
Discord Bot 사용 통계
- 총 명령어 실행: 79번
ping: 45번 (가장 많이 사용)add: 31번roll: 3번
- 총 메시지 전송: 79개
- 평균 응답 시간: 0.05초
- 에러 발생: 2건 (모두 테스트용)
현재 모니터링 시스템 상태
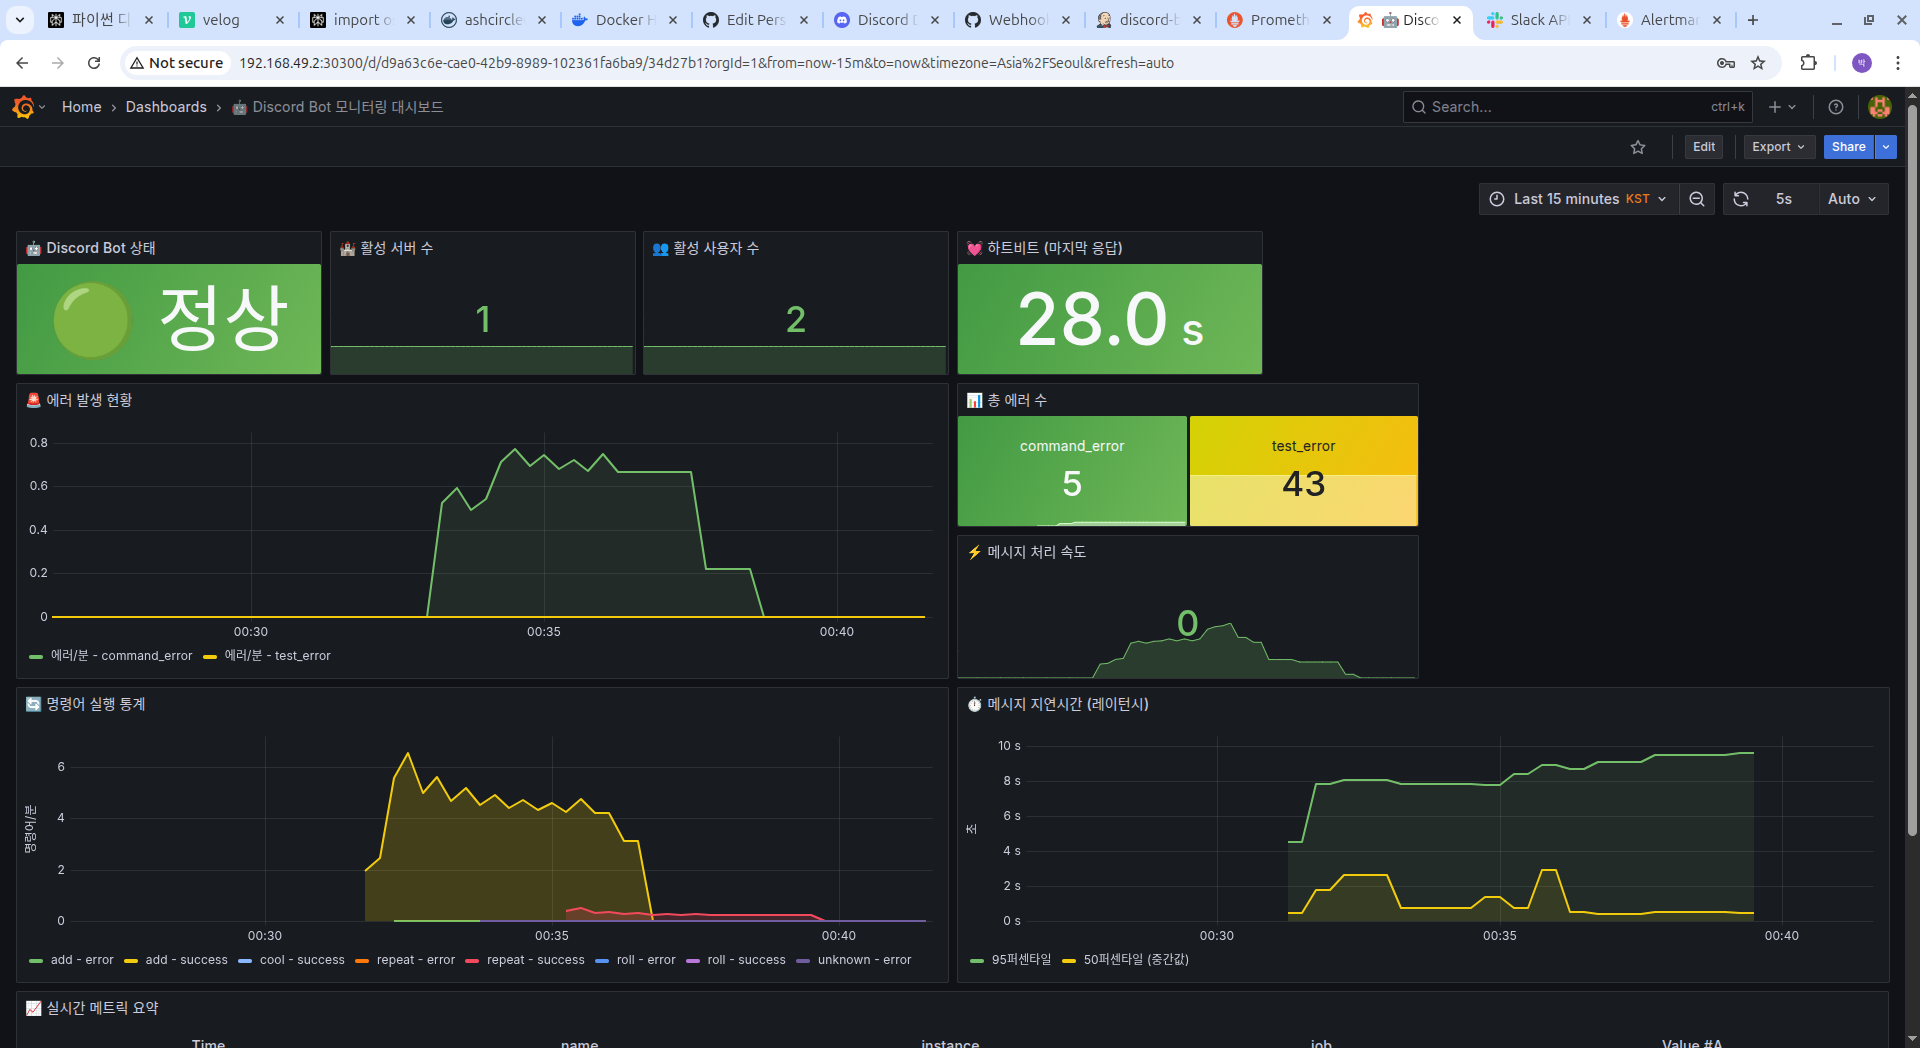
실시간 동작 중인 컴포넌트들
- Discord Bot:
ashcircle03/discord-bot:116이미지로 안정적 실행 - Prometheus: 30초마다 44개 메트릭 수집
- AlertManager: Slack 채널
C08QCUMR0GL로 알림 전송 - Grafana: 실시간 대시보드 제공 (http://localhost:3000)
수집 중인 핵심 지표
실제 운영 중인 메트릭들:
# 현재 수집되는 실제 메트릭 예시
discord_bot_commands_total{command="ping",status="success"} 45
discord_bot_messages_sent_total 79
discord_bot_errors_total{error_type="command_error"} 2
discord_bot_heartbeat_timestamp_seconds 1717084523
discord_bot_active_guilds 1
discord_bot_active_users 5
마무리
처음에는 단순히 "Discord Bot 만들어보자"였는데, 어느새 운영 환경 수준의 모니터링 시스템을 구축하게 되었다.
최종 완성된 스택
- Discord Bot: Python으로 구현, 6개 명령어 지원
- Prometheus: 실시간 메트릭 수집 (44개 지표)
- Grafana: 시각화 대시보드
- AlertManager: Slack 실시간 알림
- Kubernetes: 컨테이너 오케스트레이션
- Jenkins: CI/CD 파이프라인 (빌드 #117까지 성공)

안녕하세요 코린이입니다.