사용 도구
JMeter를 활용해 대기열 시스템의 부하 테스트를 진행하려고 합니다.
테스트 과정에서 CPU와 메모리 사용량, DB 커넥션 풀 상태를 모니터링하여 병목 현상이 발생하는 지점을 분석하려고 합니다.
이를 위해 Spring Actuator, Prometheus, Grafana를 사용하여 성능 지표를 확인하고 시각화 해보겠습니다.
- Actuator
SpringBoot 애플리케이션 내부 상태를 노출하는 도구ex ) 톰켓 스레드 수, DB 커넥션 풀 상태, JVM 메모리 사용량 … 내부 지표를 HTTP API로 확인할 수 있음 즉, 내부 데이터를 꺼내주는 창구 같은 역할
- Prometheus
외부에서 주기적으로 Actuator 같은 지표 제공를 호출하여 데이터를 scrape 하는 도구긁어온 데이터를 시계열 데이터베이스에 저장 Grafana 같은 툴이 Prometheus에서 데이터를 읽어서 대시보드로 보여줌
- Grafana
Prometheus 같은 모니터링 시스템이나 다양한 데이터 소스에서 수집한 지표를 대시보드 형태로 시각화 해주는 오픈소스 데이터 시각화 및 모니터링 도구
데이터 분석 흐름
Spring Actuator를 통해 Spring Boot 애플리케이션의 내부 상태를 노출하고, Prometheus가 이를 주기적으로 수집하여 저장
이후, Grafana를 통해 해당 데이터를 시각화하여 모니터링할 수 있습니다.
설정
-
Spring actuator 및 prometheus 의존성 설치
implementation 'org.springframework.boot:spring-boot-starter-actuator'
implementation 'io.micrometer:micrometer-registry-prometheus'
-
actuator application.properties 설정
# 모든 엔드포인트를 노출
management.endpoints.web.exposure.include=*

# Actuator 포트 설정
management.server.port=9292

# Tomcat 메트릭 설정
# 톰캣 MBean 등록 활성화 → 스레드 풀 상태, 요청 수 등 확인 가능
server.tomcat.mbeanregistry.enabled=true
-
prometheus.yml 파일 생성
# Prometheus가 대상에서 메트릭을 몇 초 주기로 수집할지 설정
global:
  scrape_interval: 15s
  evaluation_interval: 15s

# Prometheus가 경고 규칙을 얼마나 자주 평가할지 설정
alerting:
  alertmanagers:
    - static_configs:
        - targets:

rule_files:

# 어떤 대상에서 어떤 메트릭을 수집할지 정의하는 부분
scrape_configs:

  # Prometheus 자신을 모니터링하여, localhost:9090/metrics에서 Prometheus 서버의 메트릭을 수집
  # 즉, Prometheus는 15초마다 자기 자신( localhost:9090 ) 상태를 모니터링
  - job_name: "prometheus"
    static_configs:
      - targets: ["localhost:9090"]

  # Spring Boot 애플리케이션 모니터링
  # 15초마다 Spring Boot 애플리케이션(9292/actuator/prometheus) 상태를 모니터링
  - job_name: "spring-actuator"
    metrics_path: '/actuator/prometheus'
    scrape_interval: 15s

    # 메트릭을 수집할 대상 주소를 설정
    # Prometheus를 도커로 실행시키기에 로컬의 Actuator에 접근하기 위해 host.docker.internal로 설정
    static_configs:
      - targets: ['host.docker.internal:9292']
Prometheus는 15초마다
host.docker.internal:9292/actuator/prometheus엔드포인트를 호출하여 Spring Actuator의 메트릭 데이터를 수집합니다.
- docker-compose.yml 파일 생성
services:

	# prometheus를 docker 컨테이너를 통해 실행
  airdnb-prometheus:
    image: prom/prometheus

    # 로컬에서 만든 prometheus.yml을 컨테이너 안에 그대로 덮어씌워서 사용
    volumes:
      - ./prometheus.yml:/etc/prometheus/prometheus.yml
    ports:
      - "9090:9090"

  #
  airdnb-local-grafana:
    image: grafana/grafana
    ports:
      - "3001:3000"
사용
-
docker-compose up 명령어를 통해 prometheus와 grafana 컨테이너를 실행
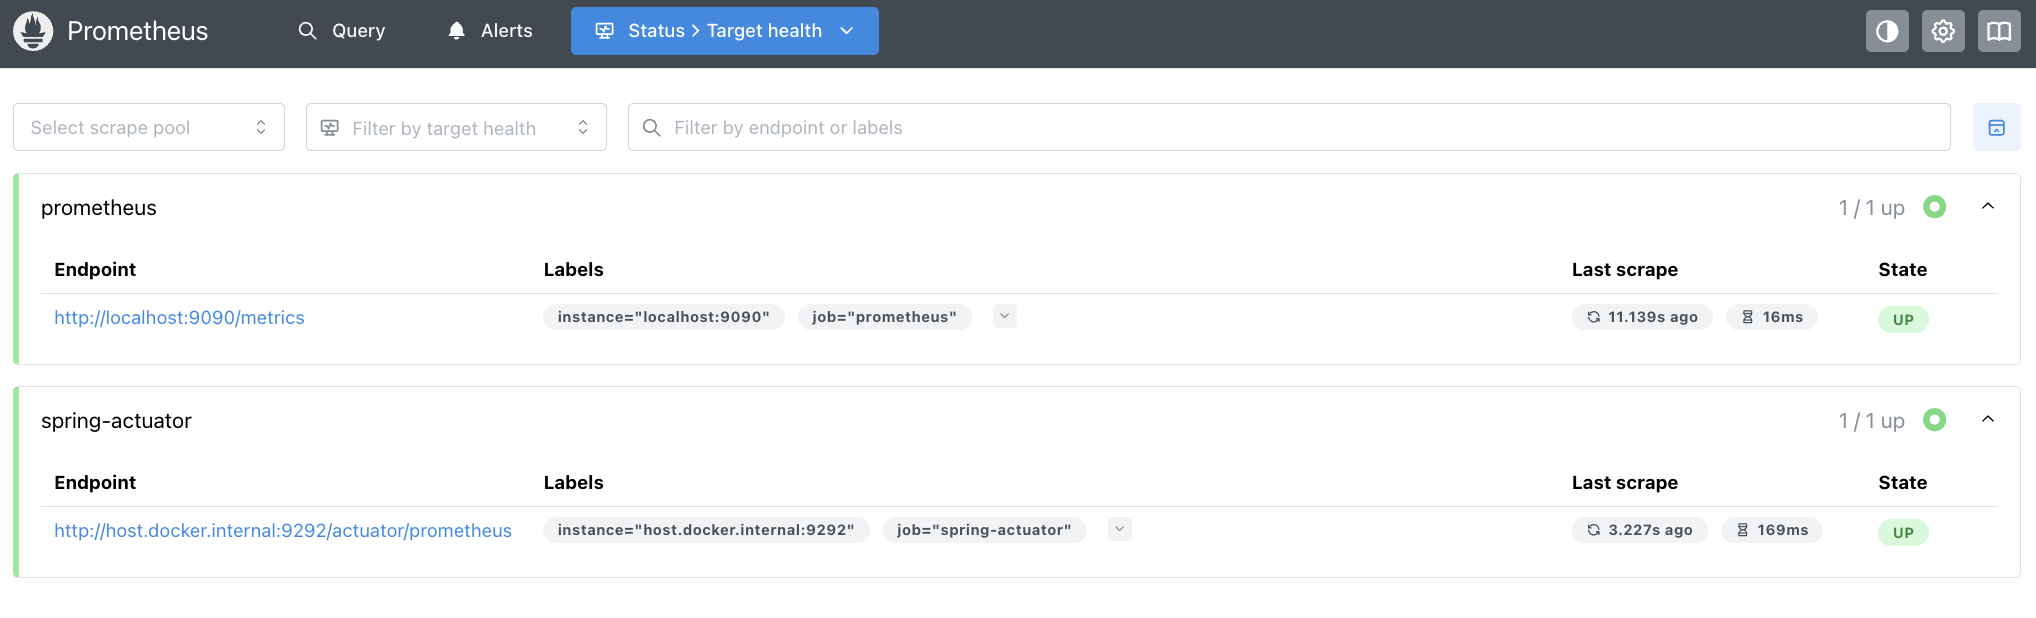
localhost:9090으로 prometheus에 접속하여 status 목록의 target health에서 prometheus와 스프링부트가 잘 연결되었는지 확인
( http://localhost:9292/actuator/prometheus 를 통해 Actuator의 metric을 확인 가능 )
-
그라파다에 접속하여 Data sources 메뉴에서 Add new data source를 통해 data source를 생성하여 connection에
http://airdnb-prometheus:9090를 입력하고 저장
-
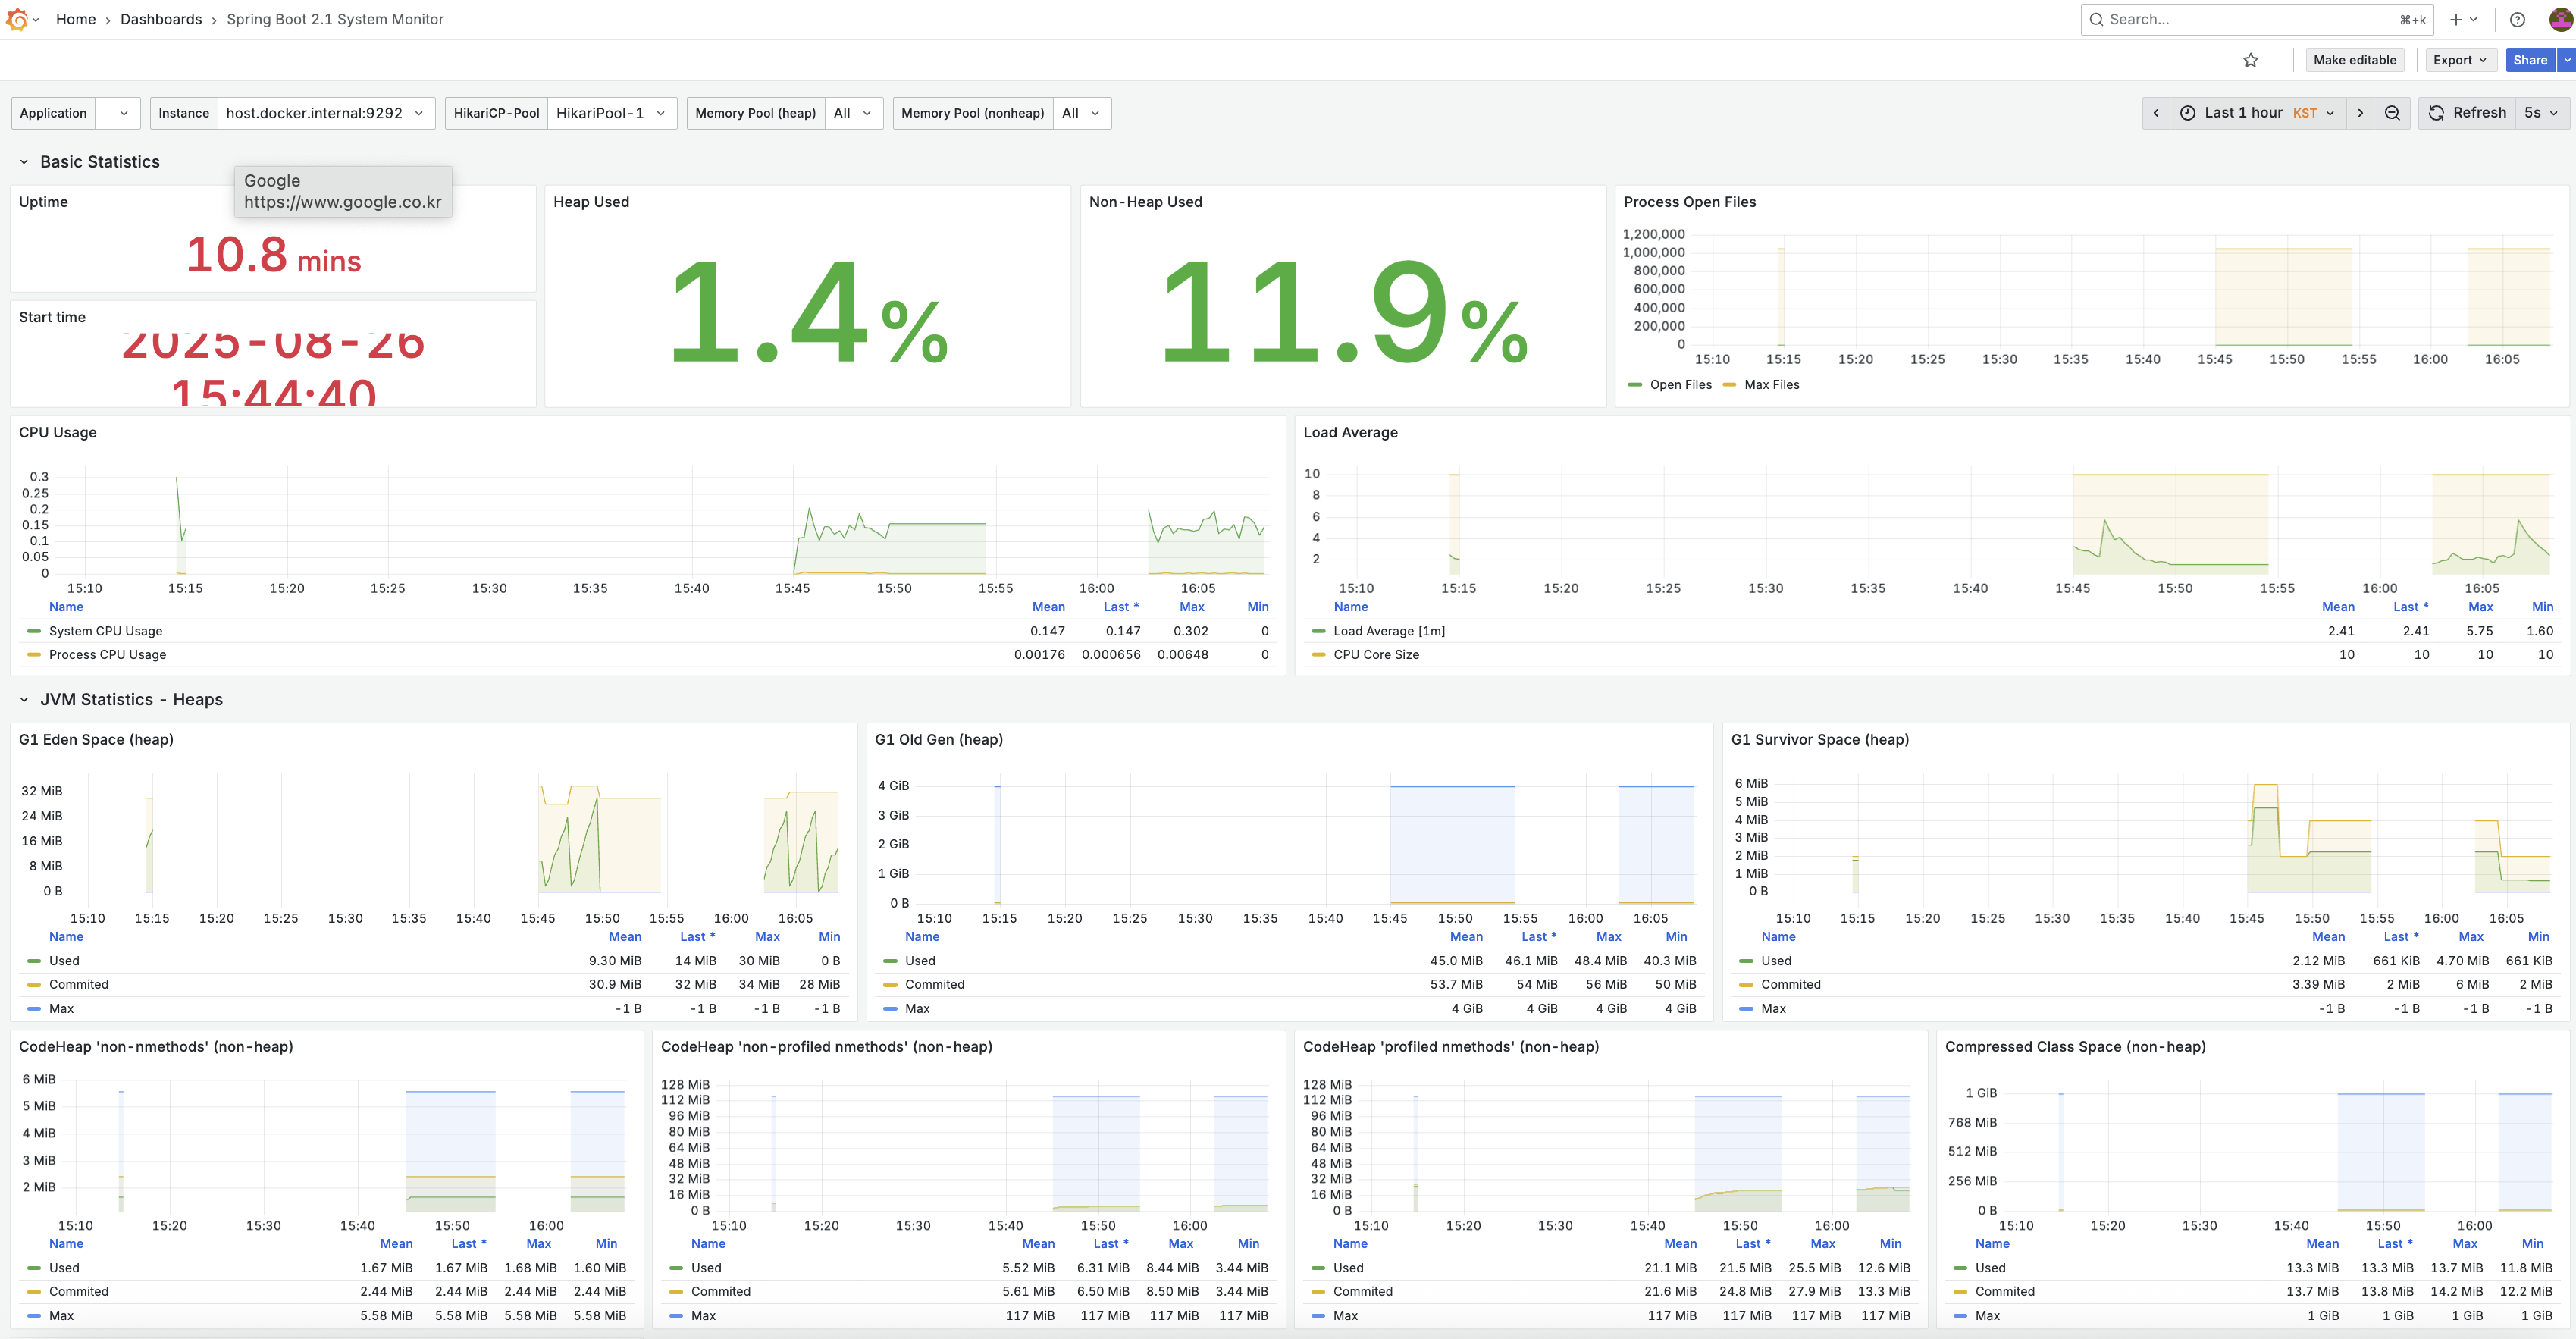
생성한 data source를 대시보드를 통해 분석할 수 있는데 공유 대시보드를 활용하여 사용 가능
https://grafana.com/grafana/dashboards/ 경로에서 원하는 대시보드의 ID를 복사하고 대시보드에서 import → ID 입력 후 생성하면 아래와 같이 분석 가능