EDA
분석 전 데이터 셋의 초기 정보 확인
특정 패턴, 특이성, 가설 검증, 통계와 그래픽
방법1.Graphic
방법2.Non-Graphic: 주로 Summary Statistics로 데이터 확인
타겟 1.Univariate(변량 한개)
타겟 2.Multi-variate(다변량): 주로 변수들간의 관계보는 것
Uni-Non Graphic
: 분산을 확인하는 것이 주목적
Numeric data의 경우 Summary Statistics를 주요 사용
- Center (Mean, Median, Mod)
- Spread (Variance, SD, IQR, Range)
- Modality (Peak)
- Shape (Tail, Skewness, Kurtosis)
- Outliers 등을 확인합니다.
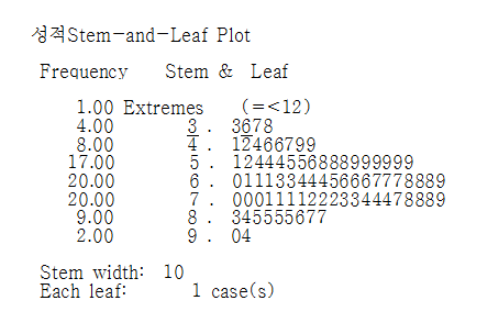
Categorical data의 경우: occurence(발생), frequency, tabulation(표)Uni-Non Graphic: Pie chart, Stem-leaf plot, Boxplot, QQplot
Multi - Non Graphic: Relationship을 보는 것이 주된 목표
-Cross-Tabulation
-Cross-Statistics (Correlation, Covariance)Multi - Graphic
Category & Numeric : Boxplots, Stacked bar, Parallel Coordinate, Heatmap
Numeric & Numeric : Scatter Plot
1. 데이터셋 불러오기
단어 줄이기
import pandas as pd
excel 불러오기
pandas.read_excelcsv 불러오기
pandas.read_csv
상위 5개만 불러오기
df.head()
특정 시트 불러오기
sheet_name= '시트 이름'sheet_name= 시트 순서(0,1,2..)
row와 columns 바꾸기
df.transpose()df.T
행,열 이름 변경
df.rename(columns={변경 전 열이름, 변경 후 열이름})df.rename(index={변경 전 행이름, 변경 후 행이름}, inplace=True
행, 열 삭제
drop('행 또는 열이름', axis = 0 or 1)행을 삭제하려면axis=0(디폴트값), 열을 삭제하려면 axis=1
아래 시리즈 VS 데이터프레임 참고
2. 데이터 확인
데이터 dimension 확인
df.shape
데이터 결측지 true / False로 표시
df1.isnull()
데이터 결측지의 갯수
df1.isnull().sum()
데이터 결측지 0으로 대체
df1.fillna(0)
막대 그래프 생성
df1['FCF'].plot.bar()
그래프 위 주소같은 문장 출력되는데 이거 제거하는 방법은 뭘까?
cf)한글 깨질때
:) 나눔 폰트 설치
!sudo apt-get install -y fonts-nanum
!sudo fc-cache -fv
!rm ~/.cache/matplotlib -rf
::) matplotlib폰트를 나눔 폰트로 지정
import matplotlib.pyplot as plt
plt.rc('font', family='NanumBarunGothic')
https://teddylee777.github.io/colab/colab-korean 참고
3. File export
cf). 드라이브 마운트
https://blog.naver.com/convin305/222332846863
colab 드라이브 에 df1.csv, df2 생성
from google.colab import files
df1.to_csv('df.csv')
df2.to_csv('df2.csv')
csv 출력(긴가민가...)
df.csv=df.to_csv(index=False)
4. EDA
열 cross-tabulation
Example =pd.crosstab(pp.열이름, pp.열이름)
가장 큰 값 찾기
max()가장 작은 값 찾기
min()한번이면 될 줄 알았는데 한번 더 시행해야 깔끔하게 큰값과 작은 값 나오는데 왜 그러한가
시리즈 VS 데이터프레임