과제 목표 & 진행 방식
- Python Library를 통한 데이터 기초 핸들링 및 응용 실습
- 기본 라이브러리 외 추가적인 라이브러리 import 진행 필요
- 기본 라이브러리 import
import pandas as pd
import numpy as np
import scipy.stats as stats
from datetime import datetime, timedelta
- 기본 라이브러리 import
필수 1. 기초통계
1-1
statistics csv 파일을 읽고, 성별 Review Rating 에 대한 평균과 중앙값을 구해주세요. 결과는 소수점 둘째자리까지 표현해주세요.
import pandas as pd
df = pd.read_csv("statistics.csv")

female_rating_mean = df[df['Gender']=='Female']['Review Rating'].mean().round(2)
female_rating_median = df[df['Gender']=='Female']['Review Rating'].median().round(2)
male_rating_mean = df[df['Gender']=='Male']['Review Rating'].mean().round(2)
male_rating_median = df[df['Gender']=='Male']['Review Rating'].median().round(2)
print(f'여성 Review Rating 평균: {female_rating_mean}')
print(f'여성 Review Rating 중앙값: {female_rating_median}')
print(f'냠셩 Review Rating 평균: {male_rating_mean}')
print(f'남성 Review Rating 중앙값: {male_rating_median}')
1-2
1-1에 대한 해석을 간략하게 설명해주세요.
1. 필요한 라이브러리 import
2. 데이터 불러오기(csv 파일 읽기)
3. 성별 Review Rating 에 대한 평균과 중앙값에 대해 각각 변수를 선언하고 넣어준 뒤 print로 출력함
3-1. [df['Gender']=='Female'] 또는 [df['Gender']=='Male']
성별 Review Rating 에 대한 평균과 중앙값을 구하기 위해
Gender 컬럼이 여자(Female)인 경우와 남자(Male)인 경우로
조건을 걸었음
3-2. ['Review Rating']
통계량 연산을 할 컬럼 지정
3-3. mean() 또는 median()
평균과 중앙값을 구해야 하므로 두 가지 연산 함수 사용
3-4. round(2)
결과가 소수점 둘째 자리까지 표현되어야 하므로 2 넣음
필수 2. 통계적 가설검정(1)
2-1
성별, Review Rating 컬럼에 대한 T-TEST 를 진행해주세요.
- 귀무가설과 대립가설을 작성해주세요.
- t-score, P-value 를 구해주세요.
- 그리고 이에 대한 귀무가설 채택/기각 여부와 그렇게 생각한 이유를 간략하게 설명해주세요.
import pandas as pd
import numpy as np
import scipy.stats as stats

df = pd.read_csv('statistics.csv')

df_rating_f = df[df['Gender']=='Female'][['Review Rating']]
df_rating_m = df[df['Gender']=='Male'][['Review Rating']]

# 무작위로 뽑아 두 집단을 비교하는 경우이므로 독립표본 t-검정
# (귀무가설, H0): 남성과 여성의 평균 Review Rating에 차이가 없을 것
# (대립가설, H1): 남성과 여성의 평균 Review Rating에 차이가 있을 것

# 데이터가 여성 1248건, 남성 2652건으로 n이 30 이상이라 정규성 만족한 것으로 봄

# 분산의 동일성 검사(levene test)
var_test_stat, var_test_p_val = stats.bartlett(df_rating_f, df_rating_m)
print(f'두 집단 간 등분산성 검정 통계량:{var_test_stat}, p-value: {var_test_p_val}')
# 등분산성 검사 진행 결과 p-value가 [0.64808913]로 유의수준 0.05보다 크기 때문에 두 집단의 데이터는 등분산성을 만족한다고 볼 수 있음

# t-test 진행
t_score, p_value=stats.ttest_ind(df_rating_f, df_rating_m)
print(f't-score: {t_score}, P-value: {p_value}')

# 독립표본 t검정 수행 결과 검정통계량 t-score는 -0.50971475, 유의 확률 P-value는 0.61028017로 P-value가 유의수준 0.05보다 크기 때문에 귀무가설을 채택하고 "남성과 여성의 Review Rating에 차이가 없다(Review Rating과 성별은 관계가 없다)"는 결론을 내릴 수 있다.
2-2
2-1에 대한 해석을 간략하게 설명해주세요.
1. 필요한 라이브러리 import
2. 데이터 불러오기(csv 파일 읽기)
3. 데이터 분리: Review Rating 컬럼에서 성별 여자/남자 분리
4. 귀무가설, 대립가설 작성
- 귀무가설(H₀)
: 남성과 여성의 평균 Review Rating에 차이가 없을 것이다
- 대립가설(H₁)
: 남성과 여성의 평균 Review Rating에 차이가 있을 것이다
5. 정규성, 등분산성 확인 후 t-test 진행(stats.ttest_ind())
6. 수행 결과 t-score는 -0.50971475, p-value는 0.61028017이 나왔음
7. p-value가 유의수준 0.05보다 크기 때문에 연관성이 없다고 추정할 수 있음 → 대립가설 기각, 귀무가설 채택
8. 따라서 "남성과 여성의 Review Rating에 차이가 없다(Review Rating과 성별은 관계가 없다)"는 결론을 내릴 수 있음
필수 3. 통계적 가설검정(2)
3-1
Color, Season 컬럼에 대한 카이제곱 검정을 진행해주세요.
- 귀무가설과 대립가설을 작성해주세요.
- 두 범주형 자료의 빈도표를 만들어주세요. 이를 코드로 작성하여 기재해주세요.
- 카이제곱통계량, P-value 를 구해주세요.
- 그리고 이에 대한 귀무가설 채택/기각 여부와 그렇게 생각한 이유를 간략하게 설명해주세요.
import pandas as pd
import numpy as np
import scipy.stats as stats

df = pd.read_csv('statistics.csv')

# 이원 카이제곱검정(two-way chi-squared test)
# (귀무가설, H0): Color와 Season은 관련성이 없을 것이다(독립적일 것이다)
# (대립가설, H1): Color와 Season은 관련성이 있을 것이다

# 빈도표 그리기
df_chi = pd.crosstab(df['Color'], df['Season'])
print('빈도표\n', df_chi)


# chi2_contingency를 통해 카이제곱통계량, p-value를 출력
chi_square, chi_p_value, dof, expected = stats.chi2_contingency(df_chi)
print(f'카이제곱 검정 통계량: {chi_square}, p-value: {chi_p_value}')

# 이원 카이제곱검정 수행 결과 검정통계량 chi-sqare는 64.6506366841786, 유의 확률 P-value는 0.718551112120402로 P-value가 유의수준 0.05보다 크기 때문에 귀무가설을 채택하고 "Color와 Season은 관련성이 없다(독립적이다)"는 결론을 내릴 수 있다.
3-2
3-1에 대한 해석을 간략하게 설명해주세요.
1. 필요한 라이브러리 import
2. 데이터 불러오기(csv 파일 읽기)
3. 판다스 크로스탭(crosstab) 함수를 사용하여 두 개 이상의 요인(factors)에 대한 교차표 생성 → crosstab: 범주형 변수를 기준으로 개수 파악이나 수치형 데이터를 넣어 계산할 때 사용
4. 귀무가설, 대립가설 작성
- 귀무가설(H₀)
: Color와 Season은 관련성이 없을 것이다(독립적일 것이다)
- 대립가설(H₁)
: Color와 Season은 관련성이 있을 것이다
5. chi2_contingency를 통해 카이제곱 겁정 진행
6. 카이제곱검정 수행 결과 검정통계량 chi-sqare는 '64.6506366841786', 유의 확률 P-value는 '0.718551112120402'가 나왔음
7. p-value가 유의수준 0.05보다 크기 때문에 연관성이 없다고 추정할 수 있음 → 대립가설 기각, 귀무가설 채택
8. 따라서 "Color와 Season은 관련성이 없다(독립적이다)"는 결론을 내릴 수 있음
필수 4. 머신 러닝(1)
4-1
아래와 같은 데이터가 있다고 가정하겠습니다. 데이터를 바탕으로 선형 회귀 모델을 훈련시키고, 회귀식을 작성하고 회귀식을 통해, 새로운 광고 예산이 1,000만원일 경우의 매출을 예측(계산)해주세요.
- 독립 변수(X): 광고예산 (단위: 만원)
- 종속 변수(Y): 일일 매출 (단위: 만원)
- X=[10, 20, 30, 40, 60, 100]
- Y=[50, 60, 70, 80, 90, 120]
import sklearn
import numpy as np
import pandas as pd
from sklearn.linear_model import LinearRegression


X = [10, 20, 30, 40, 60, 100]
Y = [50, 60, 70, 80, 90, 120]

# 딕셔너리 형태로 key값과 리스트 변수를 선택하면서 데이터프레임 만들기
df = pd.DataFrame({'광고예산': X, '일일 매출': Y})

# 모델 생성
model_lr = LinearRegression()

# 훈련할 데이터 X값, y값 나누기
X_lr = df[['광고예산']]
y_lr = df[['일일 매출']]

# 선형회귀모델 데이터 훈련
model_lr.fit(X=X_lr, y=y_lr)

# 회귀식 작성
w1 = model_lr.coef_[0][0]
w0 = model_lr.intercept_[0]

print(f'회귀식: y = {w1.round(4)}x + {w0.round(4)}')

# 새로운 광고 예산이 1,000만원일 경우의 매출을 예측(계산)
pred = w1*(1000) + w0
print(f'새로운 광고 예산이 1,000만원일 경우의 매출(예측): {pred.round(4)}만원')
4-2
4-1에 대한 해석을 간략하게 설명해주세요.
1. 필요한 라이브러리 import
2. X, Y 변수 선언하고 주어진 데이터(리스트 값) 넣음
3. 딕셔너리 형태로 key값과 리스트 변수를 선택하면서 데이터프레임 생성
4. 모델 생성
5. 모델 학습을 위한 데이터 생성 → scikit-learn 에서 모델 학습을 위한 데이터는 (n,c) 형태여야 해서 대괄호 2개 사용
6. 선형회귀모델 model_lr 훈련(fit) 진행
7. 회귀계수에 대해 변수 w1을 선언하고 값 넣음 → 회귀계수 값이 리스트 안 리스트에 들어 있어서([[0.75625]]) 이중 리스트에서 인덱싱하기 위해 [0][0] 사용
8. 편향에 대해 변수 w0을 선언하고 값 넣음 → 값이 리스트 형태로 저장되어 있어 리스트의 첫 번째 요솟값을 가져오기 위해 [0] 사용
9. 편향과 회귀계수를 가지고 회귀식을 도출하고 새로운 광고 예산(x)이 1,000(만원)일 경우의 매출을 예측함
도전 1. 머신 러닝(2)
5-1
Review Rating, Age, Previous Purchases 컬럼을 활용하여, 고객이 할인(Discount Applied)을 받을지 예측하는 RandomForest모델을 학습시켜 주세요. 그리고 모델 정확도를 계산해주세요.
- y(종속변수)는 Yes/No 로 기재된 이진형 데이터입니다. 따라서, 인코딩 작업이 필요합니다. 구현을 위해 LabelEncoder를 사용해주세요.
- 머신러닝 시, 전체 데이터셋을 Train set과 Test set 으로 나눠주세요. 해당 문제에서는 Test set비중을 30%로 설정해주세요. random_state는 42로 설정해주세요.
- Train Set: 모델을 학습하는데 사용하는 데이터셋
- Test Set: 적합된 모델의 성능을 평가하는데 사용하는 데이터셋
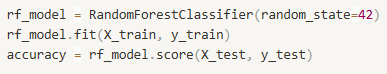
- RandomForestClassifier 를 활용하여 모델 학습을 진행해주세요. random_state는 42로 설정해주세요.
import pandas as pd
import matplotlib.pyplot as plt
import numpy as np
from sklearn.preprocessing import LabelEncoder
from sklearn.model_selection import train_test_split
from sklearn.ensemble import RandomForestClassifier

df = pd.read_csv('statistics.csv')

# 독립변수 1: Review Rating → numerical
# 독립변수 2: Age → numerical
# 독립변수 3: Previous Purchases → numerical
# 종속변수: Discount Applied → categorical Yes/No 이진형 데이터라 Label Encoding 필요

X_features = ['Review Rating', 'Age', 'Previous Purchases']
X= df[X_features]

# y(종속변수) Label Encoding
le = LabelEncoder()
y = le.fit_transform(df['Discount Applied'])

# 전체 데이터셋을 Train set과 Test set으로 나누기: Test set 비중 30%, random_state는 42로 설정
X_train, X_test, y_train, y_test = train_test_split(X, y, test_size=0.3, random_state=42)

# 모델 생성
model_rf = RandomForestClassifier(random_state=42)

# 학습
model_rf.fit(X_train, y_train)

# accuracy
accuracy = model_rf.score(X_test, y_test)
print(f'RandomForest 모델 정확도: {accuracy}')

# RandomForest 모델 정확도: 0.517948717948718
5-2
5-1에 대한 해석을 간략하게 설명해주세요.
1. 필요한 라이브러리 import
2. 데이터 불러오기(csv 파일 읽기)
3. 활용해야 하는 세 개의 컬럼을 X_features 변수에 할당한 뒤 X 변수 선언하고 넣음 → Review Rating, Age, Previous Purchases 컬럼 모두 numerical이라 별도의 인코딩 필요 없음
4. LabelEncoder 변수 선언 후 y 변수 선언하고 LabelEncoder로 인코딩 작업한 거 바로 넣음(fit_transform) → categorical Yes/No(이진형) 데이터라 Label Encoding 진행
5. 전체 데이터셋을 Train set과 Test set으로 나눔 → Test set 비중 30%, random_state는 42로 설정
6. 모델 생성
7. 학습 진행
8. X_test, y_test 사용하여 RandomForest 모델 정확도 계산
도전 2. 머신 러닝(3)
6-1
Subscription Status 컬럼을 종속변수로 사용하여 고객의 이탈 여부를 예측하는 로지스틱 회귀 모델 학습을 진행해주세요. Age, Purchase Amount, Review Rating을 활용하여 모델을 훈련한 후, 연령 30세, 구매 금액 50 USD, 리뷰 평점 4.0인 고객의 이탈 확률을 계산해주세요.
- y(종속변수)는 Yes/No 로 기재된 이진형 데이터입니다. 따라서, 인코딩 작업이 필요합니다. 구현을 위해 LabelEncoder를 사용해주세요.
- 머신러닝 시, 전체 데이터셋을 Train set과 Test set 으로 나눠주세요. 해당 문제에서는 Test set비중을 30%로 설정해주세요. random_state는 42로 설정해주세요.
- Train Set: 모델을 학습하는데 사용하는 데이터셋
- Test Set: 적합된 모델의 성능을 평가하는데 사용하는 데이터셋
- 연령 30세, 구매 금액 50 USD, 리뷰 평점 4.0 인 고객을 new_customer 라는 변수에 지정해주세요. 1차원이 아닌 이중 대괄호[[...]]로 지정해주세요. (모델 입력 형식은 2차원 배열이어야 하므로)
- model.predict_proba 를 사용하여 이탈 확률을 구해주세요.
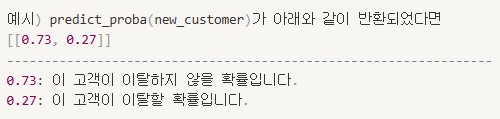
- predict_proba의 반환값: 모델이 각 클래스에 속할 확률을 계산합니다. 결과는 다음과 같은 배열로 반환됩니다.
- [[P(클래스 0), P(클래스 1)]]
- P(클래스 0): 이 고객이 이탈하지 않을 확률
- P(클래스 1): 이 고객이 이탈할 확률
import pandas as pd
import matplotlib.pyplot as plt
import numpy as np
from sklearn.preprocessing import LabelEncoder
from sklearn.model_selection import train_test_split
from sklearn.linear_model import LogisticRegression

df = pd.read_csv('statistics.csv')

# 독립변수 1: Age → numerical
# 독립변수 2: Purchase Amount → numerical
# 독립변수 3: Review Rating → numerical
# 종속변수: Discount Applied → categorical Yes/No 이진형 데이터라 Label Encoding 필요

X_features = ['Age', 'Purchase Amount (USD)', 'Review Rating']
X= df[X_features]

# y(종속변수) Label Encoding
le = LabelEncoder()
y = le.fit_transform(df['Discount Applied'])

# 전체 데이터셋을 Train set과 Test set으로 나누기: Test set 비중 30%, random_state는 42로 설정
X_train, X_test, y_train, y_test = train_test_split(X, y, test_size=0.3, random_state=42)

# 모델 생성
model_lor = LogisticRegression()

# 학습
model_lor.fit(X_train, y_train)

# 연령 30세, 구매 금액 50 USD, 리뷰 평점 4.0 인 고객
new_customer = pd.DataFrame({'Age': [30], 'Purchase Amount (USD)': [50], 'Review Rating': [4.0]})


# new_customer 이탈 확률
new_customer_proba = model_lor.predict_proba(new_customer)

# model_lor.predict_proba(new_customer)가 반환하는 값: array([[0.58414347, 0.41585653]])

print(f'{new_customer_proba[0][0]}: new_customer가 이탈하지 않을 확률')
print(f'{new_customer_proba[0][1]}: new_customer가 이탈할 확률')

# 출력 내용
# 0.5841434677759765: new_customer가 이탈하지 않을 확률
# 0.4158565322240235: new_customer가 이탈할 확률
추가
1차원이 아닌 이중 대괄호\[\[...]]로 지정해주세요.안 쓴 이유 → array로 넣으면 경고 메시지 뜸- UserWarning: X does not have valid feature names, but LogisticRegression was fitted with feature names
6-2
6-1에 대한 해석을 간략하게 설명해주세요.
1. 필요한 라이브러리 import
2. 데이터 불러오기(csv 파일 읽기)
3. 활용해야 하는 세 개의 컬럼을 X_features 변수에 할당한 뒤 X 변수 선언하고 넣음 → Age, Purchase Amount, Review Rating 컬럼 모두 numerical이라 별도의 인코딩 필요 없음
4. LabelEncoder 변수 선언 후 y 변수 선언하고 LabelEncoder로 인코딩 작업한 거 바로 넣음(fit_transform) → categorical Yes/No(이진형) 데이터라 Label Encoding 진행
5. 전체 데이터셋을 Train set과 Test set으로 나눔 → Test set 비중 30%, random_state는 42로 설정
6. 모델 생성
7. 학습 진행
8. 연령 30세, 구매 금액 50 USD, 리뷰 평점 4.0 인 고객을 new_customer 라는 변수에 지정
9. predict_proba를 사용해 해당 고객 이탈 확률 계산 → 고객이 할인(Discount Applied)을 받는다 == Yes 응답 == 클래스 0 == 이탈 안 함
10. 이탈하지 않을 확률과 이탈할 확률을 각각 출력
6번 문제 틀린 부분
Subscription Status컬럼 써야 하는데Discount Applied를 써버렸다…
다시 푼 결과
import pandas as pd
import matplotlib.pyplot as plt
import numpy as np
from sklearn.preprocessing import LabelEncoder
from sklearn.model_selection import train_test_split
from sklearn.linear_model import LogisticRegression

df = pd.read_csv('statistics.csv')

# 독립변수 1: Age → numerical
# 독립변수 2: Purchase Amount → numerical
# 독립변수 3: Review Rating → numerical
# 종속변수: Discount Applied → categorical Yes/No 이진형 데이터라 Label Encoding 필요

X_features = ['Age', 'Purchase Amount (USD)', 'Review Rating']
X= df[X_features]

# y(종속변수) Label Encoding
le = LabelEncoder()
y = le.fit_transform(df['Subscription Status'])

# 전체 데이터셋을 Train set과 Test set으로 나누기: Test set 비중 30%, random_state는 42로 설정
X_train, X_test, y_train, y_test = train_test_split(X, y, test_size=0.3, random_state=42)

# 모델 생성
model_lor = LogisticRegression()

# 학습
model_lor.fit(X_train, y_train)

# 연령 30세, 구매 금액 50 USD, 리뷰 평점 4.0 인 고객
new_customer = pd.DataFrame({'Age': [30], 'Purchase Amount (USD)': [50], 'Review Rating': [4.0]})


# new_customer 이탈 확률
new_customer_proba = model_lor.predict_proba(new_customer)
print(f'pridict_proba가 반환한 값: {new_customer_proba}')
print(f'{new_customer_proba[0][0].round(2)}: new_customer가 이탈하지 않을 확률')
print(f'{new_customer_proba[0][1].round(2)}: new_customer가 이탈할 확률')

# pridict_proba가 반환한 값: [[0.74233045 0.25766955]]
# 0.74: new_customer가 이탈하지 않을 확률
# 0.26: new_customer가 이탈할 확률
해설 강의
- "어떻게 판단할 것인지"까지 써야 한다고 함!
- 평균과 중앙값 차이가 크기 않음 → 두 집단 간 차이 없음
→ conclusion까지 작성하기
- 평균과 중앙값 차이가 크기 않음 → 두 집단 간 차이 없음

2 B R 0 2 B