Comprehensive Mapping of Long-Range Interactions Reveals Folding Principles of the Human Genome
Chromosome conformation capture is a way that enables researchers to observe interactions between loci. These loci are in close contact in the 3-dimnesional structure of a chromosome, but they can be apart in the linear sequence. It is important to understand how chromosomes fold that it is relevant to complicated relationships between chromatic structure, gene activity, and the cell’s functional state. There are many different ways to look into the 3-D structure of chromatin. Chromosome conformation capture, as know as 3C, was the first chromatin structure assay. It uses spatially constrained ligation. 3C has been adapted into several ways such as 4C(inverse PCR) and 5C(multiplexed ligation-meditated amplification). But those methods have to overcome that they require choosing a set of target loci and they cannot be applied to unbiased genomwide analysis. Therefore, researchers in this paper suggest a new method called Hi-C. It also has been developed from above methods but can identify chromatin interactions genomwidely. Hi-C starts with the cross-linking and DNA digestion steps. While the 5’ overhang is filled, biotinylated residue incorporates it. The biotin tag is at the center of the ligation junction in the DNA strand. It results in fragments in close spatial proximity in the nucleus compost of the ligation products.
The researchers divide the genome into loci 1Mb of which comprise one genome and make a genomwide contact matrix(M) .The matrix entry m(ij) means the number of ligation products between locus I and j. This expresses the combined meaning of the interactions in the cells.
They validated the Hi-C model with several ways. First, they repeated the experiment with the same restriction enzyme and with a different one and checked whether it reproduces same results every time. It was validated by extracting similar contact matrices from the different experiments. Furthermore, they checked whether there is corresponds to the known features of genome organization such as patterns in subnuclear positioning or chromosome territories.
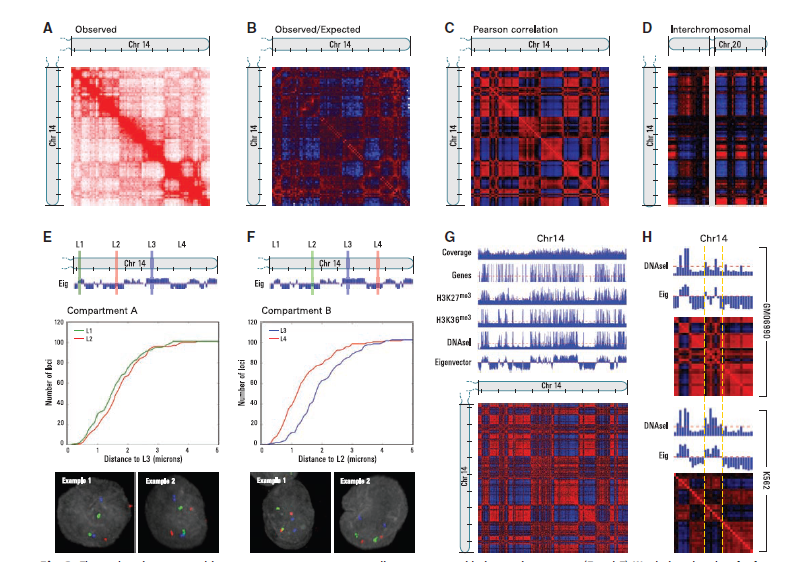
From a genomic distance in base pairs along the nucleotide sequence, they computed the average contact probability. It can be expressed as In(s), where n stands for the sequence number of chromosome and s for the distance. As 3D distance between loci increases, In(s) decreases on every chromosome. These is also supported by 3C and fluorescence in situ hybridization(FISH). In terms of interchromosomal contact probabilities, some small and gene-rich chromosomes preferentially showed strong interact with each other. On the other hand, small but gene-poor chromosomes don’t interact that much with other small chromosomes. This is also supported by FISH. They were also curious about whether there are specific regions on individual chromosomes that preferentially associate with each other. They defined a normalized contact matrix M*. This entry of the matrix is by dividing each entry in the contact matrix by the genomwide average probability for loci. Interestingly, it makes a plaid pattern that has many blocks of enriched and depleted interactions. Then they defined a correlation matrix C from the assumption that spatially neighboring loci would have a correlated interaction profile. The entry c(ij) of correlation matrix C is the Pearson correlation between the ith row and jth column of M*. It even improves the plaid pattern composed of label A and B. Furthermore, the plaid patterns of intra-chromosome were similar within that of inter-chromosome. This leads to the fact that the whole genome can be divided into two compartments in 3-dimensional where the interactions within each compartment is bigger than across compartments. The Hi-C data shows that regions corresponding to the same compartment are likely to be spatially closer. They tested this by 3D-Fish method with investigating four loci on one chromosome locating in the two compartments. The result validated the compartmentalization in the space. They also examined the density of regions. They found out that the pairs of loci in the compartment B had a higher interaction frequency than the pairs in compartment A which means that B is denser and more packed.
The researchers compared the known genetic and epigenetic features between two spatial compartments. Compartment A is relevant to stronger presence of genes, higher expression through genomwide mRNA expression, and more accessible chromatin. It concludes that the compartment A is more with actively transcribed, open, and accessible chromatin. They do this experiment again with K562 cells, and gained similar result from in GM06990 cells. Even though both K562 and GM06990 showed similar compartment patterns, the loci alternated the compartment. They concluded that even a highly rearranged genome, spatial compartmentalization is relevant with the open or closed status.
Last but not least, they correlated chromatin structure to compartments. They calculated contact probability within chromosome scaling as s^(-1). So far, the chromosol regions have been modeled as an “equilibrium globule”. In it chromatin is pictured as being in a compact and densely knotted configuration. On the other hand “fractal globule” is formed by an unentangled polymer like a “beads-on-a-string” configuration. Because of lacking knots and availability to enfold and refold during the cell cycle, the latter is more attractive structure for chromatin segments than the former. Two globule models make very different predictions about the 3D distance between pairs of loci and the scaling of contact probability with genomic distance s. The researchers created ensemble models by implementing Monte Carlo simulations. The ensemble was tested and showed consistent to theoretically derived results for contact probability and 3D distance.