
들어가며
백엔드 서버를 운영하다 보면 "왜 이 API가 느리지?", "왜 이 요청이 실패했지?" 같은 질문을 자주 마주하게 됩니다. 이런 문제를 해결하려면 체계적인 로깅 시스템이 필수입니다.
이 글에서는 NestJS + Fastify 환경에서 Request Log와 Service Log를 어떻게 구현했는지, 그리고 이 둘이 어떻게 협력하는지 설명하겠습니다.
📋 두 가지 로그 정책
구축한 로깅 시스템은 크게 두 가지로 나뉩니다.
| 로그 유형 | 목적 | 기록 방식 | 기록 시점 |
|---|---|---|---|
| Request Log | HTTP 요청/응답 기록 | 자동 (미들웨어) | 요청 시작 & 응답 완료 |
| Service Log | 비즈니스 로직 추적 | 수동 (개발자 작성) | 로직 실행 중 |
Request Log는 "누가, 언제, 어디로, 얼마나 걸렸는지"를 기록하고,
Service Log는 "내부에서 무슨 일이 일어났는지"를 기록합니다.
🌐 Request Log 구현
기술 스택 선택
Request Log를 구현하기 위해 nestjs-pino를 선택했습니다.
npm install nestjs-pino pino-http pino-pretty선택 이유
- NestJS의 Logger 인터페이스를 그대로 유지하면서
- 내부적으로 고성능 Pino 엔진 사용
- 민감 정보 자동 마스킹 지원
- 로컬에서는 예쁜 출력, 운영에서는 JSON 출력
LoggerModule 구현
// src/common/modules/logger/logger.module.ts
import { randomUUID } from 'node:crypto';
import { Module } from '@nestjs/common';
import { LoggerModule as PinoLoggerModule } from 'nestjs-pino';

@Module({
  imports: [
    PinoLoggerModule.forRootAsync({
      useFactory: () => {
        const isLocal = process.env.NODE_ENV === 'local';

        return {
          pinoHttp: {
            // 기본 메타데이터
            base: {
              service: process.env.SERVICE_NAME || 'my-api',
              env: process.env.NODE_ENV || 'local'
            },

            // 민감정보 마스킹 설정
            redact: {
              paths: [
                'req.headers.cookie',
                'req.headers.authorization',
                'req.body.password',
                'req.body.email',
                '*.token',
                '*.secret'
              ],
              remove: true
            },

            // 요청마다 고유 ID 생성
            genReqId: (req) => {
              const existingId = req.headers['x-request-id'];
              return (Array.isArray(existingId) ? existingId[0] : existingId) || randomUUID();
            },

            // 추가 컨텍스트 정보 수집
            customProps: (req) => ({
              userId: req.user?.userId || null,
              clientIp: req.ips?.[0] || req.ip || req.socket?.remoteAddress
            }),

            level: isLocal ? 'debug' : 'info',

            // 로컬: 예쁜 출력, 운영: JSON
            transport: isLocal
              ? {
                  target: 'pino-pretty',
                  options: {
                    singleLine: false,
                    translateTime: 'SYS:yyyy-mm-dd HH:MM:ss.l',
                    colorize: true
                  }
                }
              : undefined,

            // 성공/에러 메시지 포맷
            customSuccessMessage: (req, res, responseTime) => {
              return `${req.method} ${req.url} ${res.statusCode} - ${Math.round(responseTime)}ms`;
            },

            customErrorMessage: (req, res, err) => {
              return `${req.method} ${req.url} ${res.statusCode} - ERROR: ${err.message}`;
            }
          }
        };
      }
    })
  ],
  exports: [PinoLoggerModule]
})
export class LoggerModule {}
main.ts 설정
// src/main.ts
import { NestFactory } from '@nestjs/core';
import { FastifyAdapter, NestFastifyApplication } from '@nestjs/platform-fastify';
import { Logger } from 'nestjs-pino';
import { AppModule } from './app.module';

async function bootstrap() {
  const app = await NestFactory.create<NestFastifyApplication>(
    AppModule,
    new FastifyAdapter({
      logger: false  // Fastify 기본 로거 비활성화
    }),
    { bufferLogs: true }
  );

  // nestjs-pino의 Logger로 교체
  app.useLogger(app.get(Logger));

  await app.listen(3000, '0.0.0.0');
}
bootstrap();
Request Log 출력 예시
로컬 환경:
[14:32:15.123] INFO: GET /api/orders 200 - 152ms
    service: "my-api"
    env: "local"
    userId: "user-12345"
    clientIp: "::1"
운영 환경 (JSON)
{"level":30,"time":1702647135123,"service":"my-api","userId":"user-12345","responseTime":152,"msg":"GET /api/orders 200 - 152ms"}📊 Service Log 구현
왜 Service Log가 필요한가?
Request Log만으로는 "API가 왜 느린지", "어느 단계에서 실패했는지" 알 수 없습니다.
Service Log는 비즈니스 로직의 내부 흐름을 상세히 기록합니다.
구현 패턴
// src/orders/orders.service.ts
import { Injectable, Logger, BadRequestException } from '@nestjs/common';

@Injectable()
export class OrdersService {
  private readonly logger = new Logger(OrdersService.name);

  async createOrder(dto: CreateOrderDto) {
    const startTime = Date.now();

    // Stage 1: 요청 수신
    this.logger.log('[Stage 1/4] 주문 생성 요청 수신', {
      productId: dto.productId,
      quantity: dto.quantity
    });

    // Stage 2: Validation
    this.logger.debug('[Stage 2/4] Validation 시작');

    if (dto.quantity <= 0) {
      this.logger.warn('[Validation 실패] 유효하지 않은 수량', {
        quantity: dto.quantity,
        reason: '수량은 1 이상이어야 합니다'
      });
      throw new BadRequestException('수량은 1 이상이어야 합니다');
    }

    this.logger.debug('[Stage 2/4] Validation 통과');

    // Stage 3: 비즈니스 로직 처리
    this.logger.debug('[Stage 3/4] 주문 처리 중...');

    const order = await this.orderRepository.save({
      productId: dto.productId,
      quantity: dto.quantity,
      totalPrice: dto.quantity * 10000
    });

    this.logger.log('[Stage 3/4] 주문 생성 완료', { orderId: order.id });

    // Stage 4: 완료
    const duration = Date.now() - startTime;
    this.logger.log('[Stage 4/4] 처리 완료', {
      orderId: order.id,
      duration: `${duration}ms`
    });

    return order;
  }
}
Service Log 출력 예시
정상 처리
[14:32:15.050] INFO: [Stage 1/4] 주문 생성 요청 수신 { productId: 'PROD-001', quantity: 5 }
[14:32:15.060] DEBUG: [Stage 2/4] Validation 시작
[14:32:15.065] DEBUG: [Stage 2/4] Validation 통과
[14:32:15.100] DEBUG: [Stage 3/4] 주문 처리 중...
[14:32:15.140] INFO: [Stage 3/4] 주문 생성 완료 { orderId: 'ORD-123' }
[14:32:15.142] INFO: [Stage 4/4] 처리 완료 { duration: '92ms' }
Validation 실패
[14:32:15.050] INFO: [Stage 1/4] 주문 생성 요청 수신 { productId: 'PROD-001', quantity: -1 }
[14:32:15.060] DEBUG: [Stage 2/4] Validation 시작
[14:32:15.062] WARN: [Validation 실패] 유효하지 않은 수량 { quantity: -1, reason: '수량은 1 이상이어야 합니다' }
🔄 Request Log의 작동 원리 (인터셉트 방식)
Request Log가 어떻게 자동으로 기록되는지, 그 흐름을 단계별로 설명하겠습니다.
전체 흐름도
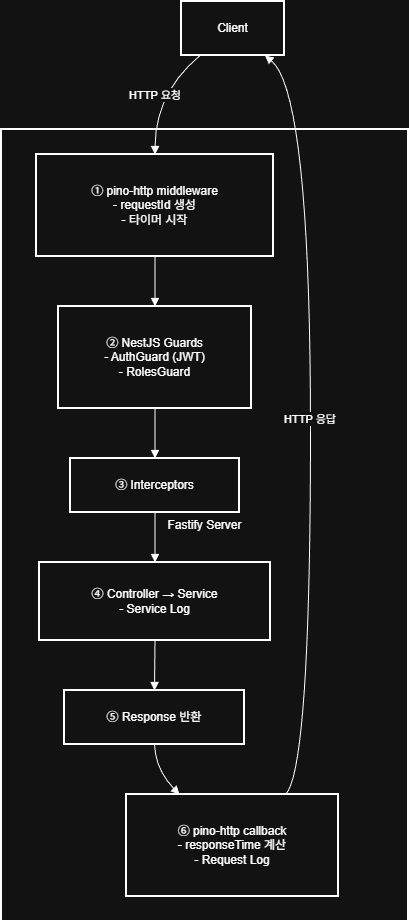
핵심 포인트
pino-http가 인터셉트하는 방식
- 요청 시작 시: 미들웨어로서 요청을 가로채 정보 수집 (로그 출력 X)
- 응답 완료 시: 등록해둔 콜백이 실행되어 최종 로그 출력
이 방식 덕분에 개발자가 별도 코드를 작성하지 않아도 모든 API에 자동 적용되며responseTime을 정확히 측정 가능해 집니다. (요청 시작 ~ 응답 완료) 또한, req.user 등 Guard에서 설정한 정보도 로그에 포함 가능합니다.
💡 실무 적용 팁
1. X-Request-Id 활용
프론트엔드에서 디버깅 시 직접 ID를 지정할 수 있습니다
fetch('/api/orders', {
  headers: { 'X-Request-Id': `debug-${Date.now()}` }
});
2. 민감 정보 마스킹 필수
운영 환경에서는 개인정보가 로그에 남지 않도록 주의
redact: {
  paths: ['req.body.password', 'req.body.email', '*.token'],
  remove: true  // 해당 필드 완전 제거
}
3. 로그 레벨 활용
this.logger.debug('...');  // 개발 시에만 확인할 상세 정보
this.logger.log('...');    // 일반적인 정보
this.logger.warn('...');   // 주의가 필요한 상황
this.logger.error('...');  // 에러 상황
마치며
로깅 시스템을 구축하면서 느낀 점은, 좋은 로그는 문제 해결 시간을 극적으로 줄여준다는 것입니다.
Request Log와 Service Log를 조합하면
- 전체적인 트래픽 흐름 파악 (Request Log)
- 내부 비즈니스 로직 추적 (Service Log)
이 두 가지를 모두 할 수 있어, 장애 대응과 성능 최적화에 큰 도움이 됩니다.
참고 자료