
단어에 대한 시각화로 자주 쓰이는 WordCloud를 간단한 예제를 통해 구현해보겠습니다😁
데이터 출처
text,image 링크
06_alice.txt
data/06_alice_mask.png 파일을 사용했습니다.
text = open("data/06_alice.txt").read()
alice_mask = np.array(Image.open("data/06_alice_mask.png"))

stopwords = set(STOPWORDS)
stopwords.add("said")
import numpy as np
import matplotlib.pyplot as plt
%matplotlib inline
from matplotlib import rc
rc('font', family='Arial Unicode MS')
import platformplt.figure(figsize=(8,8))
plt.imshow(alice_mask, cmap = plt.cm.gray, interpolation = 'bilinear')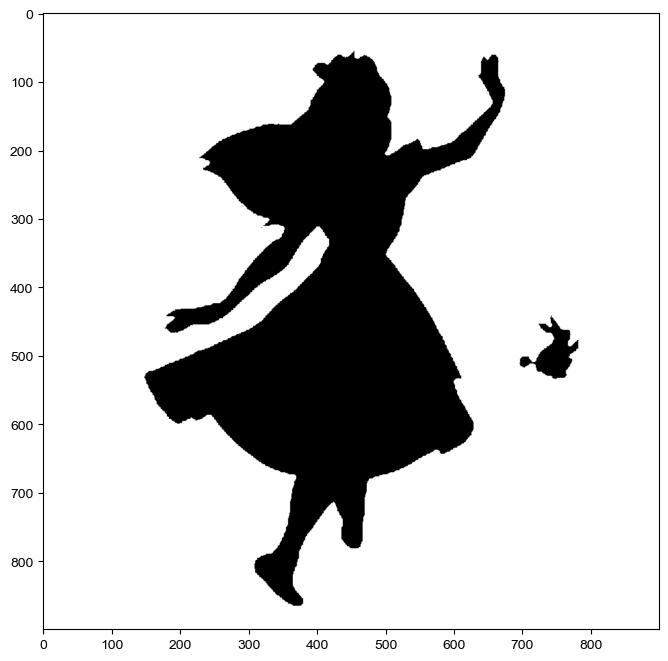
wc = WordCloud(
    background_color = 'white', max_words = 500, mask = alice_mask, stopwords = stopwords
)

wc = wc.generate(text)wc.words_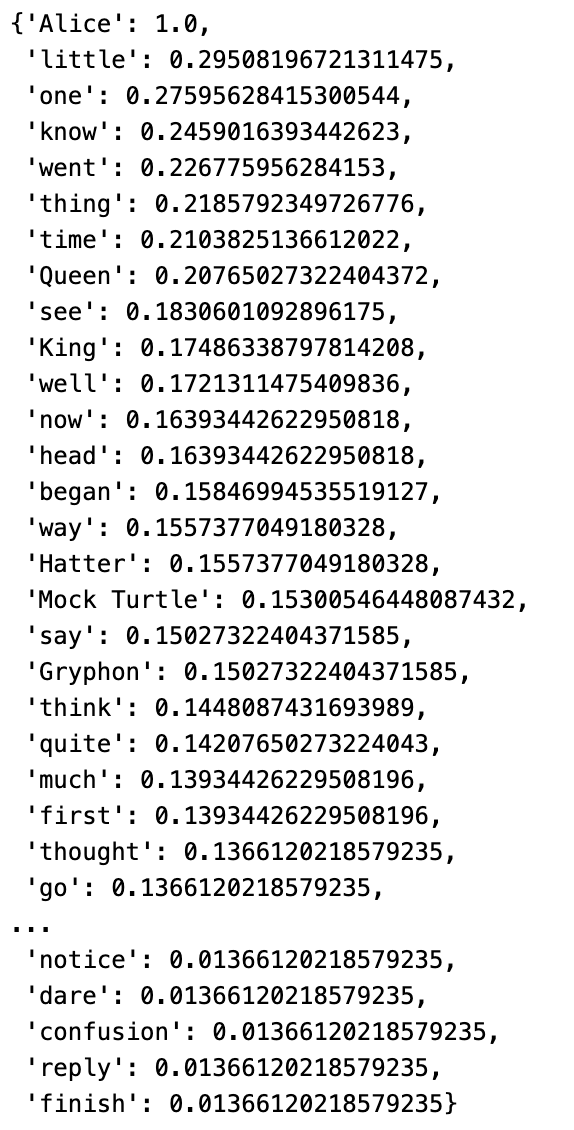
plt.figure(figsize=(12,12))
plt.imshow(wc)
plt.axis('off')
plt.show()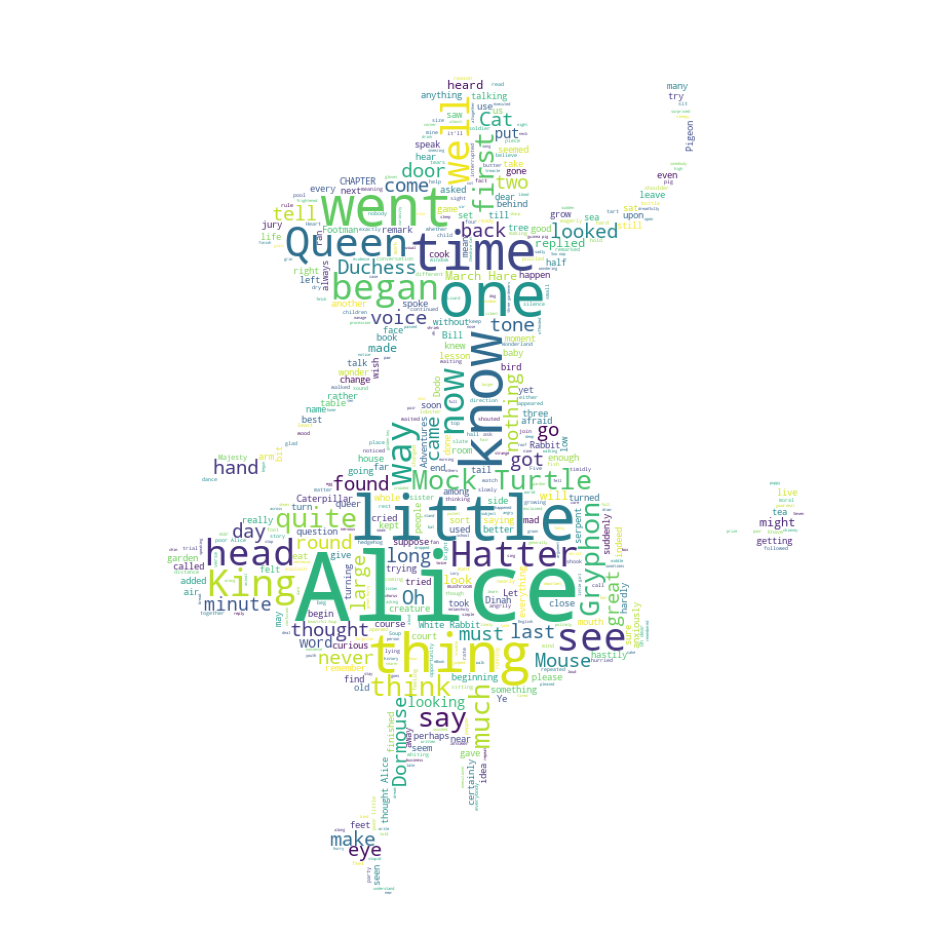

낭만젊음사랑