머신러닝 모델 배포 후 모니터링을 어떻게 할까 고민하던 차에 벡엔드에 이미 prometheus와 grafana가 셋업되어 있다는 사실을 알았다. prometheus는 스크래핑을 담당하고 grafana는 이를 대시보드 형태로 시각화 가능하게 해주기에 fastapi 프록시 서버를 모니터링하고 data drift, model performance tracking을 하기에 적합하다고 생각이 들어 시도해보기로 했다. 우선 가상환경에 prometheus client를 추가해 준다.
poetry add prometheus-client테스트를 위해 간단한 metric을 설정해 준다.
from prometheus_client import Counter, Histogram

router = APIRouter()

# Create metrics
REQUEST_TIME = Histogram('request_processing_seconds', 'Time spent processing request')
REQUEST_COUNT = Counter('request_count', 'Number of requests received')
그 후 request를 받는 handler에 해당 metric을 추가해 준다.
@router.post("/v1.0/recognize-handwritten-answer")
async def recognize_handwritten_answer(dto: HandwritingDto):
    logger.info("handwriting ocr request via dto received.")
    REQUEST_COUNT.inc()
    start_time = time.time()
    response = await HandwritingRecognitionService.recognize_handwriting(
        dto=dto,
    )
    REQUEST_TIME.observe(time.time() - start_time)
    return response
이후 prometheus가 metric을 스크래핑 할 수 있는 handler를 열어준다.
@router.get("/v1.0/metrics")
async def get_metrics():
    return Response(generate_latest(), media_type="text/plain")
호스팅된 prometheus를 건드리기 전에 local 환경에서 테스트해보는 것이 좋겠다는 생각이 들었다. prometheus 디렉토리를 만들고 그 안에 prometheus.yml 파일을 생성해 설정을 해준다.
global:
  scrape_interval: 15s

scrape_configs:
  - job_name: 'ocr-api'
    metrics_path: '/api/v1.0/metrics'
    static_configs:
      - targets: ['localhost:8000']
fastapi 서버 또한 local에서 실행중이기 때문에 위와 같이 설정해준다. 이제 prometheus 서버를 실행하기만 하면 되는데, 별도의 설치 없이 docker만 설치되어 있다면 바로 셋업이 가능하다.
docker run \
    -p 9090:9090 \
    -v path_to_prometheus.yml:/etc/prometheus \
    prom/prometheus
path_to_prometheus.yml에 설정 파일이 있는 절대 경로를 넣으면 된다. 9090포트가 expose 되어 있으므로 해당 주소로 가보면
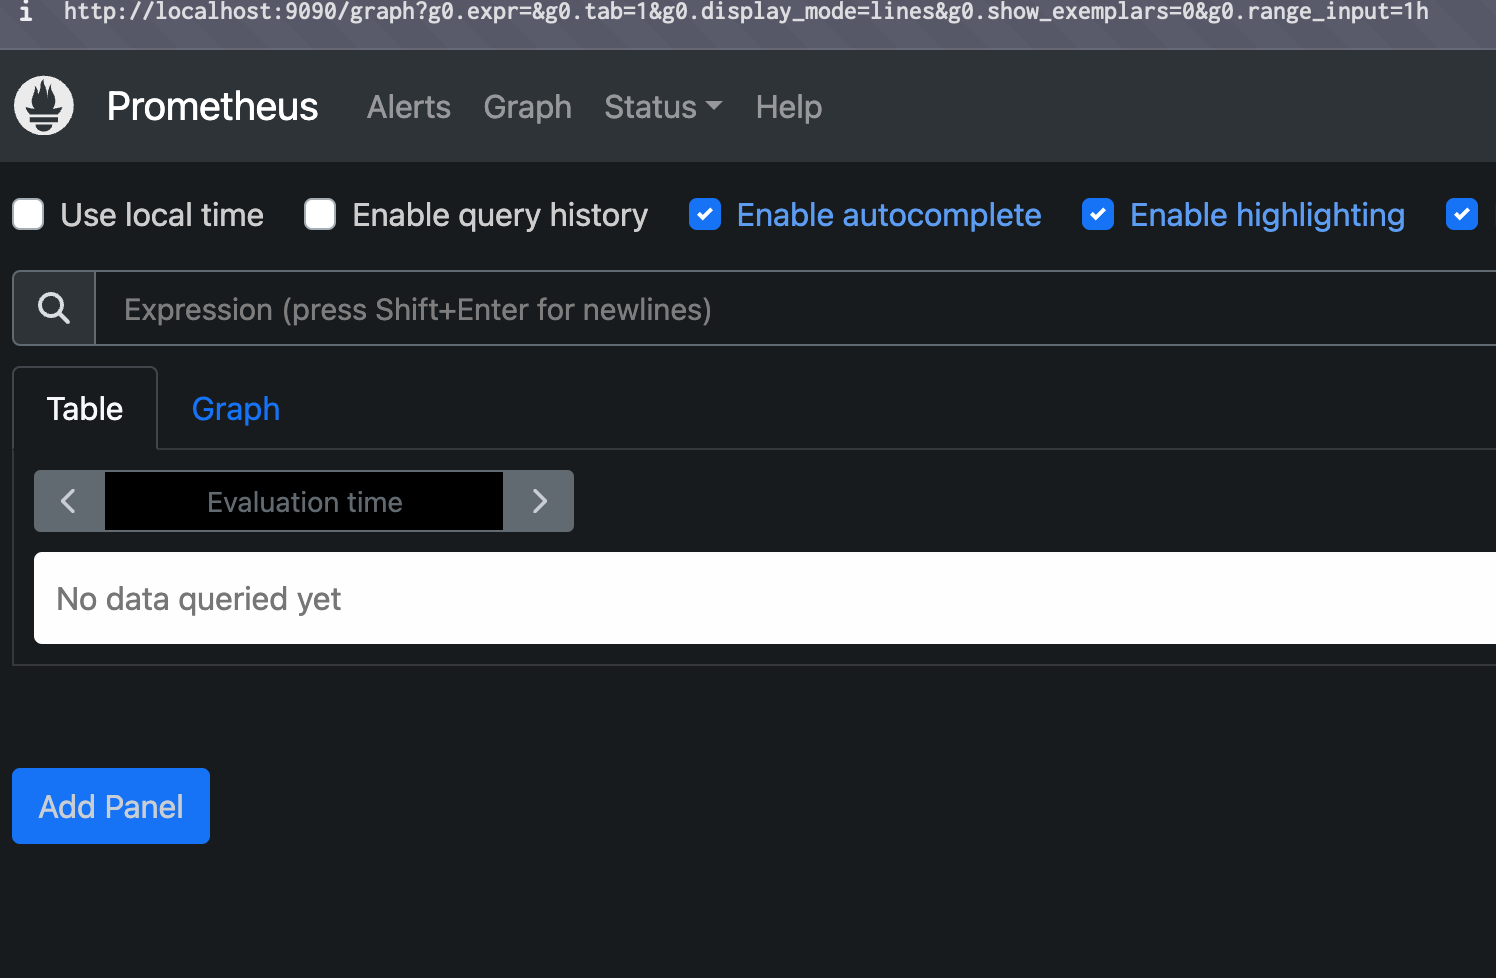
잘 실행되는 것을 볼 수 있다.

배우고 성장하는 ML 엔지니어