꽃잎 길이별 boxplot 그리기
from sklearn.datasets import load_iris

# as_frame parameter을 주면 pandas df로 받을 수 있음
# 주지 않으면 pandas df로 받을 수 없음
df = load_iris(as_frame=True).get('frame')
sep_len, sep_wid, pet_len, pet_wid, spec = df.columns

plt.figure(figsize=(5, 7))
for idx, target in enumerate((sep_len, sep_wid, pet_len, pet_wid)):
    plt.subplot(4, 1, idx + 1)
    # orient를 주지 않아도 유추(infer)하기도 하나, 이 경우는 주지 않으면 이상한 그림이 나옴
    sns.boxplot(df, x=target, y=spec, orient='h')

# tight_layout을 주면 plot들이 겹칠 가능성이 낮아짐
plt.tight_layout()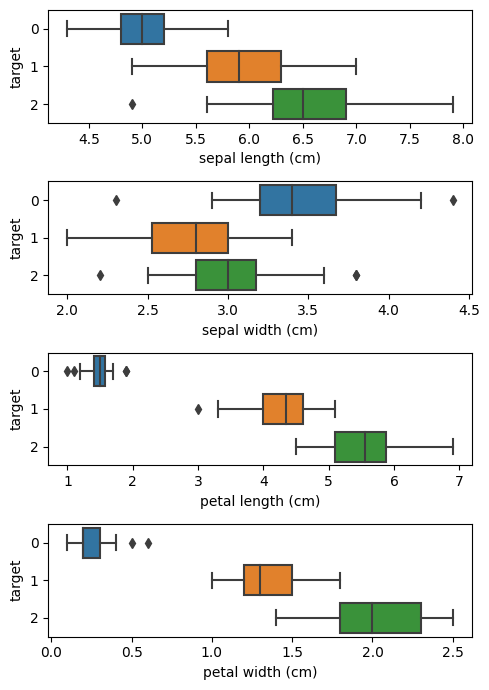
Classifier의 Decision Tree 확인
from sklearn.tree import DecisionTreeClassifier, plot_tree

clf = DecisionTreeClassifier(max_depth=3)
clf.fit(x=petal_info, y=species_info)

plot_tree(clf)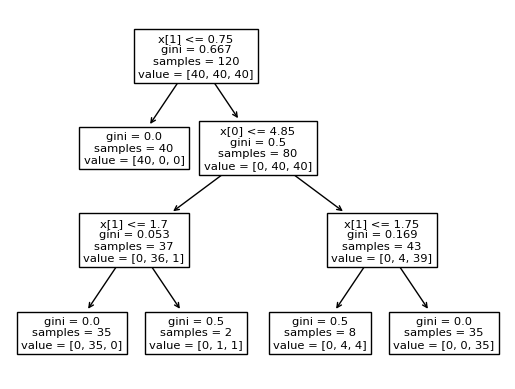
Scikit-learn 내장 시각화
from sklearn.inspection import DecisionBoundaryDisplay

# decision tree 경계선 표시
# X 값은 그림 그리기 위한 최대값 & 최소값을 참조하므로, train 데이터든 원래 데이터든 큰 상관 없음
display = DecisionBoundaryDisplay.from_estimator(clf, X=petal_info)

# 개별 데이터 scatter plot 표시
display.ax_.scatter(x=petal_info[0], y=petal_info[1], c=species_info, edgecolors='k')
DecisionBoundaryDisplay.from_estimator 관련
DicisionBoundaryDisplay.from_estimator의 X parameter는 train 데이터를 넣어야할까, test 데이터를 넣어야할까?
X parameter에서는 그래프 범위를 알기 위해 최대, 최소만 참조하므로 그냥 원래 데이터를 넣어주면 된다.
예시1) 최대, 최소값을 넣은 경우 (정상적으로 그려짐)
pet_extreme_df = pd.DataFrame({pet_len: [1.0, 6.9], pet_wid:[0.1, 2.5]})
display = DecisionBoundaryDisplay.from_estimator(clf_pet, pet_extreme_df)
display.ax_.scatter(x=df[[pet_len]], y=df[[pet_wid]], c=spec_info, edgecolors='k')
예시2) 특정 범위만 넣은 경우 (비정상 출력)
# 위의 예시에서 최소값만 변경해봄
pet_extreme_df = pd.DataFrame({pet_len: [5.0, 6.9], pet_wid:[2.1, 2.5]})
display = DecisionBoundaryDisplay.from_estimator(clf_pet, pet_extreme_df)
display.ax_.scatter(x=df[[pet_len]], y=df[[pet_wid]], c=spec_info, edgecolors='k')

Impact