차트 그리는 건 언제나 쉽지 않다! 박스오피스 api 연동하는 거 재밌다. api연동 처음해봤는데 재밌었당
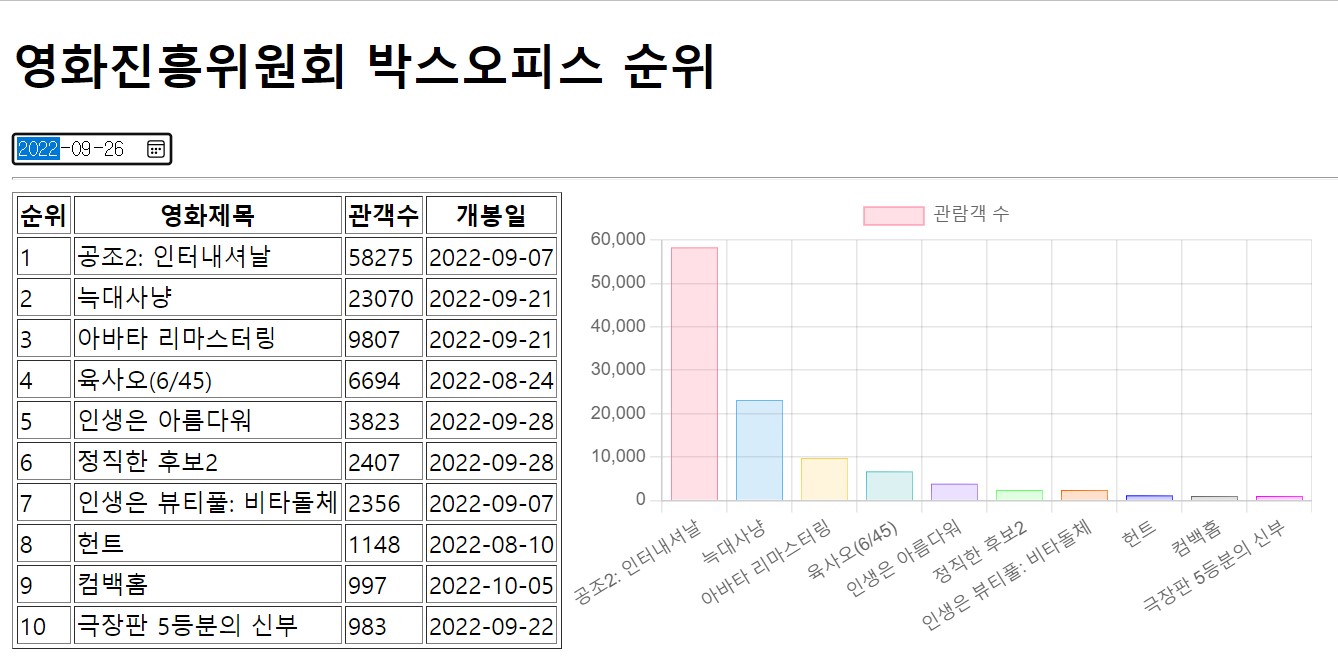
1. 영화진흥위원회 일간 순위를 나타내는 표를 표시하고, 그에 대한 그래프를 구현하시오.
<!DOCTYPE html>
<html lang="ko">
<head>
    <meta charset="UTF-8">
    <meta http-equiv="X-UA-Compatible" content="IE=edge">
    <meta name="viewport" content="width=device-width, initial-scale=1.0">
    <title>Document</title>
    <style>
        #loading {
            width: 100px;
            height: 100px;
            background: url(./img/loading.gif) no-repeat center/cover;
            position: absolute;
            left: 50%;
            top: 50%;
            transform: translate(-50%,-50%);
            z-index: 99999;
            display: none;
        }
        #loading.active {
            display: block;
        }
        table {
            float: left;
        }
        #chart_wrap {
            float:left;
            width: 500px;
            height: 300px;
        }
        #mychart {
            width: 100%;
            height: 100%;
        }
    </style>
</head>
<body>
    <div id="loading"></div>
    <h1>영화진흥위원회 박스오피스 순위</h1>
    <input type="date" id="targetDt" />
    <hr />
    <table border="1">
        <thead>
            <tr>
                <th>순위</th>
                <th>영화제목</th>
                <th>관객수</th>
                <th>개봉일</th>
            </tr>
        </thead>
        <tbody id="list-body"></tbody>
    </table>
    <div id="chart_wrap">
        <div id="mychart"></div>
    </div>

    <script src="../node_modules/axios/dist/axios.min.js"></script>
    <script src="../node_modules/chart.js/dist/chart.min.js"></script>
    <script>
        // 파라미터로 백엔드에 전달할 값을 받아서 이를 ajax로 요청한 후 결과를 수신한다.
        const getMovieRank = async (targetDt) => {
            const loading = document.querySelector('#loading');
            loading.classList.add('active');

            let json = null;
            try {
                const response = await axios.get('http://kobis.or.kr/kobisopenapi/webservice/rest/boxoffice/searchDailyBoxOfficeList.json',{
                    params: {
                        key: 'e78ddc99753147ef1de4911913145b75',
                        targetDt: targetDt.replaceAll('-','')
                    }
                });
                json = response.data;
                console.log(json);
            } catch (err) {
                console.error(`[Error Code] ${error.code}`);
                console.error(`[Error Message] ${error.message}`);
                let alertMsg = error.message;

                if (error.response !== undefined) {
                    const errorMsg = `${error.response.status} error - ${error.response.statusText}`;
                    console.error(`[HTTP Status] ${errorMsg}`);
                    alertMsg += `\n${errorMsg}`;
                }
                alert(alertMsg);
                return;
            } finally {
                loading.classList.remove('active');
            }

            const state = {targetDt:targetDt, data:JSON.stringify(json)};
            const url = `${location.pathname}?targetDt=${targetDt}`;
            history.pushState(state,null,url);

            renderMovieRank(json);
        };


        // json 데이터를 테이블에 출력. 기존에 출력되고 있던 항목은 삭제한다.
        const renderMovieRank = (json) => {
            const listBody = document.querySelector('#list-body');
            Array.from(listBody.getElementsByTagName('tr')).map((v,i) => {
                listBody.removeChild(v);
            });

            const mychart = document.querySelector('#mychart');
            Array.from(mychart.getElementsByTagName('canvas')).map((v,i) => {
                mychart.removeChild(v);
            });

            const name = [];
            const count = [];
            json.boxOfficeResult.dailyBoxOfficeList.forEach((v,i) => {
                name.push(v.movieNm);
                count.push(v.audiCnt);
            });
            console.log(name);
            console.log(count);

            if (json) {
                json.boxOfficeResult.dailyBoxOfficeList.forEach((v,i) => {
                    const tr = document.createElement('tr');
                    listBody.appendChild(tr);

                    const td1 = document.createElement('td');
                    td1.innerHTML = v.rank;
                    tr.appendChild(td1);

                    const td2 = document.createElement('td');
                    td2.innerHTML = v.movieNm;
                    tr.appendChild(td2);

                    const td3 = document.createElement('td');
                    td3.innerHTML = v.audiCnt;
                    tr.appendChild(td3);

                    const td4 = document.createElement('td');
                    td4.innerHTML = v.openDt;
                    tr.appendChild(td4);
                });
                const chart1 = document.createElement('canvas');
                mychart.appendChild(chart1);
                new Chart(chart1, {
                    type: 'bar',
                    data: {
                        labels: name,
                        datasets: [
                            {
                                label: '관람객 수',
                                data: count,
                                borderWidth: 0.5,
                                borderColor: ['rgba(255,99,132,1)','rgba(54,162,235,1)','rgba(255,206,86,1)','rgba(75,192,192,1)','rgba(153,102,255,1)','rgba(100,255,100,1)','rgba(255,100,0,1)','rgba(0,0,255,1)','rgba(100,100,100,1)','rgba(255,0,255,1)'],
                                backgroundColor: ['rgba(255,99,132,0.2)','rgba(54,162,235,0.2)','rgba(255,206,86,0.2)','rgba(75,192,192,0.2)','rgba(153,102,255,0.2)','rgba(100,255,100,.2)','rgba(255,100,0,.2)','rgba(0,0,255,.2)','rgba(100,100,100,.2)','rgba(255,0,255,.2)']
                            }
                        ]
                    },
                    options: {
                        maintainAspectRatio: false
                    }
                });
            }
        };


        // 날짜값이 변경된 경우에 대한 이벤트
        document.querySelector('#targetDt').addEventListener('change', e => {
            getMovieRank(e.currentTarget.value);
        });

        window.addEventListener('popstate', e => {
            if (e.state) {
                const json = JSON.parse(e.state.data);
                renderMovieRank(json);
                document.querySelector('#targetDt').value = e.state.targetDt;
            } else {
                renderMovieRank();
                document.querySelector('#targetDt').value = '';
            }
        });
    </script>
</body>
</html>
2. 학생별 키와 몸무게를 나타내는 막대그래프를 구현하시오.
<!DOCTYPE html>
<html lang="ko">
<head>
    <meta charset="UTF-8">
    <meta http-equiv="X-UA-Compatible" content="IE=edge">
    <meta name="viewport" content="width=device-width, initial-scale=1.0">
    <title>Document</title>
    <style>
        #chart {
            width: 1200px;
            height: 500px;
        }
    </style>
</head>
<body>
    <h1>학생별 키-몸무게</h1>
    <div class="container">
        <div id="chart"></div>
    </div>
</body>
<script src="../node_modules/axios/dist/axios.min.js"></script>
<script src="../node_modules/chart.js/dist/chart.min.js"></script>
<script>
    (async (e) => {
        let json = null;
        try {
            const response = await axios.get('http://localhost:3001/student');
            json = response.data;
            console.log(json);
        } catch (e) {
            console.error(e);
            alert(`[${e.status}] ${e.text}\n${e.msg}`);
            return;
        }
        const name = [];
        const height = [];
        const weight = [];
        json.forEach((v,i) => {
            name.push(v.name);
            height.push(v.height);
            weight.push(v.weight);
        });
        console.log(name);
        console.log(height);
        console.log(weight);


        if (json) {
            const chart = document.querySelector('#chart');
            const canvas = document.createElement('canvas');
            chart.appendChild(canvas);
            new Chart(canvas, {
                type: 'bar',
                data: {
                    labels: name,
                    datasets: [
                        {
                            label: '키',
                            data: height,
                            borderWidth: 0.5,
                            borderColor: 'rgba(255,99,132,1)',
                            backgroundColor: 'rgba(255,99,132,0.2)'
                        },
                        {
                            label: '몸무게',
                            data: weight,
                            borderWidth: 0.5,
                            borderColor: 'rgba(54,162,235,1)',
                            backgroundColor: 'rgba(54,162,235,0.2)'
                        }
                    ]
                },
                options: {
                    maintainAspectRatio: false,
                }
            });
        }
    })();
</script>
</html>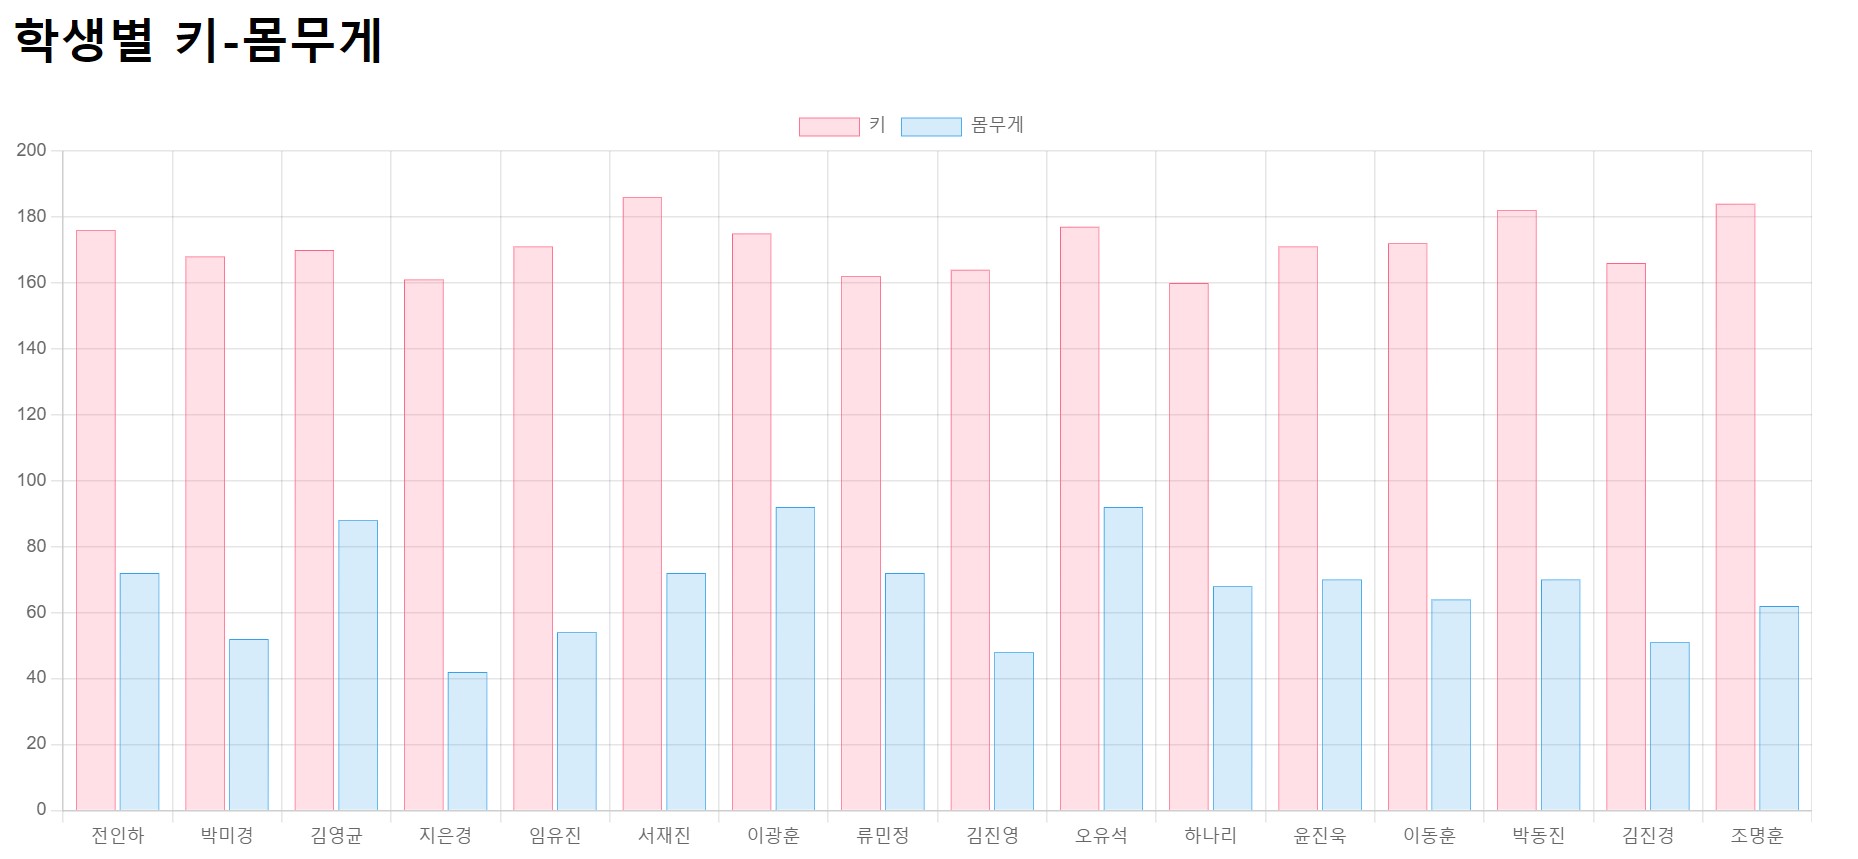

되고 싶다. 나는. 멋진 개발자가.