In the realm of server management and application deployment, understanding the impact of resource allocation on performance is crucial. This case study dives into the real-world effects of increasing server memory and how it improves handling under load, based on performance testing data from two scenarios: one with a 256 MB memory limit and another with a 512 MB limit.
Test Envinorment
spring(kotlin), K6
...with simple api
@RestController
class LoadTestController(

) {
    companion object {
        private val threadLocal = ThreadLocal<MutableList<Int>>()
    }

    @GetMapping("/load")
    fun causeLeak(): String {
        val list = mutableListOf<Int>()
        for (i in 0..10000) {
            list.add(i)
        }
        threadLocal.set(list)
        return ""
    }
}
Test Overview
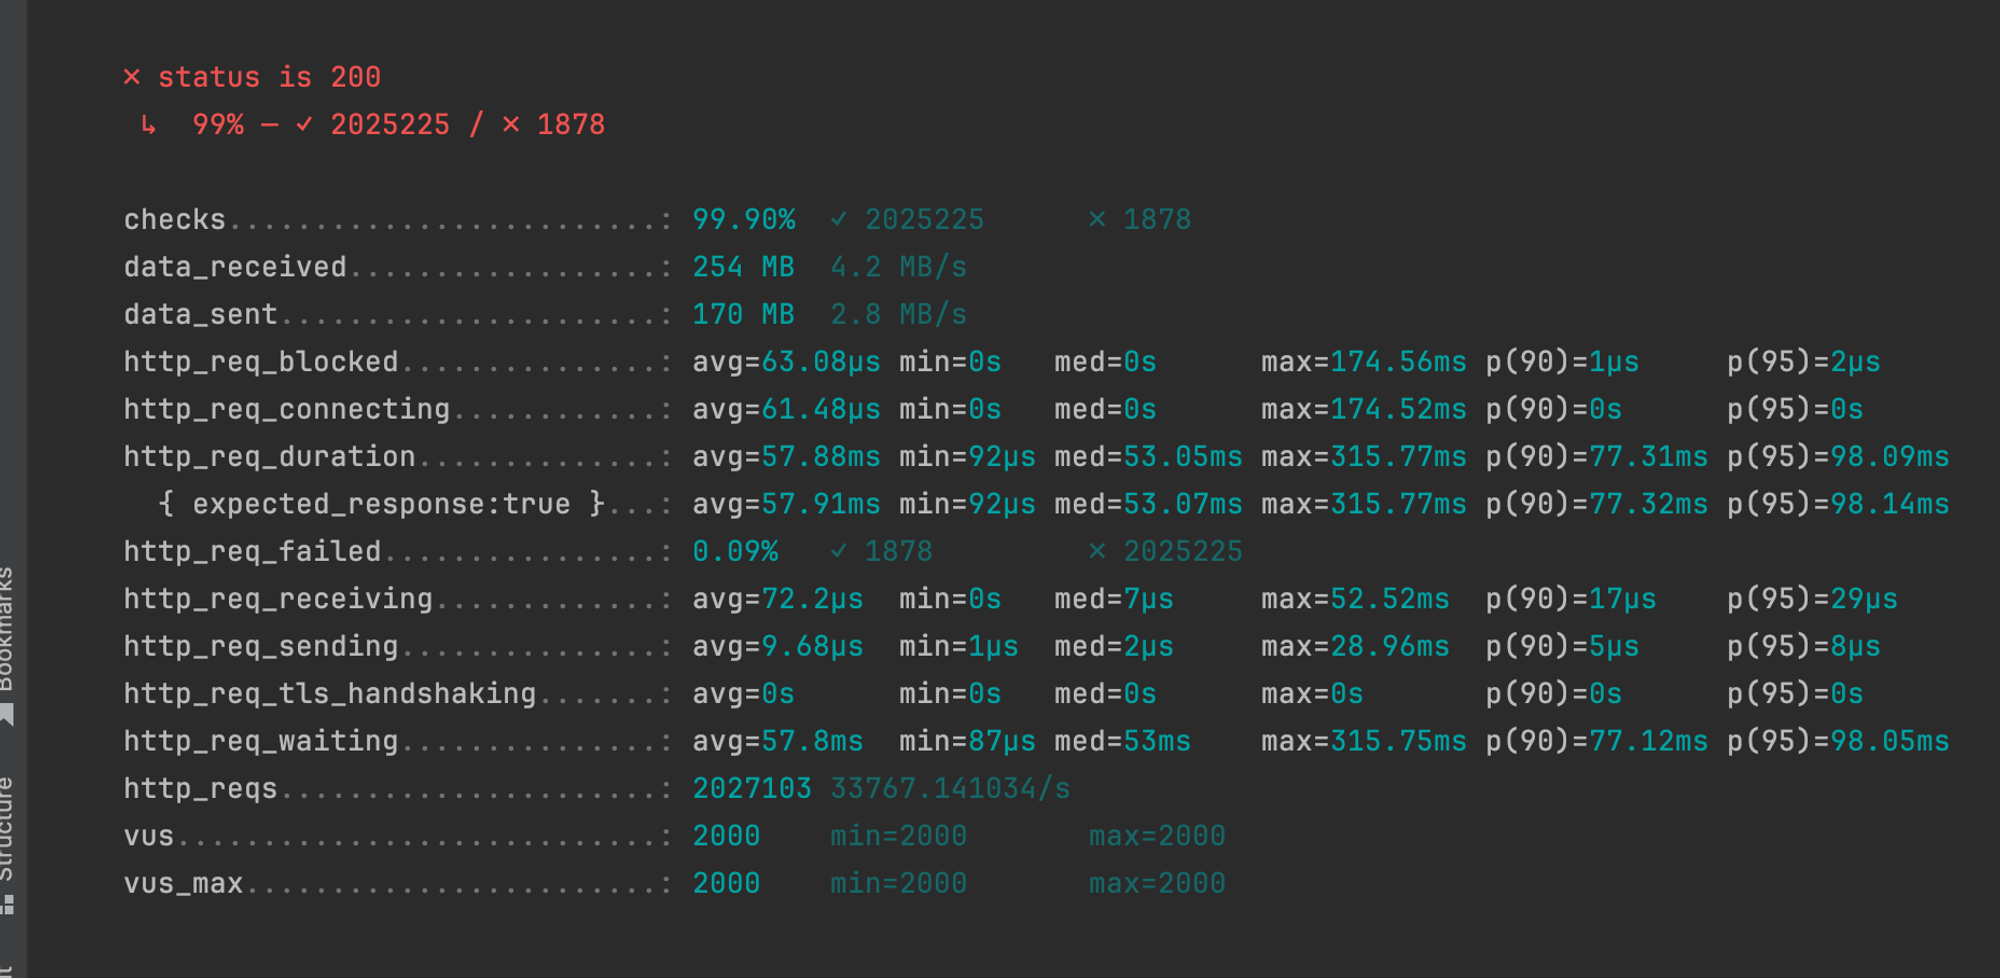
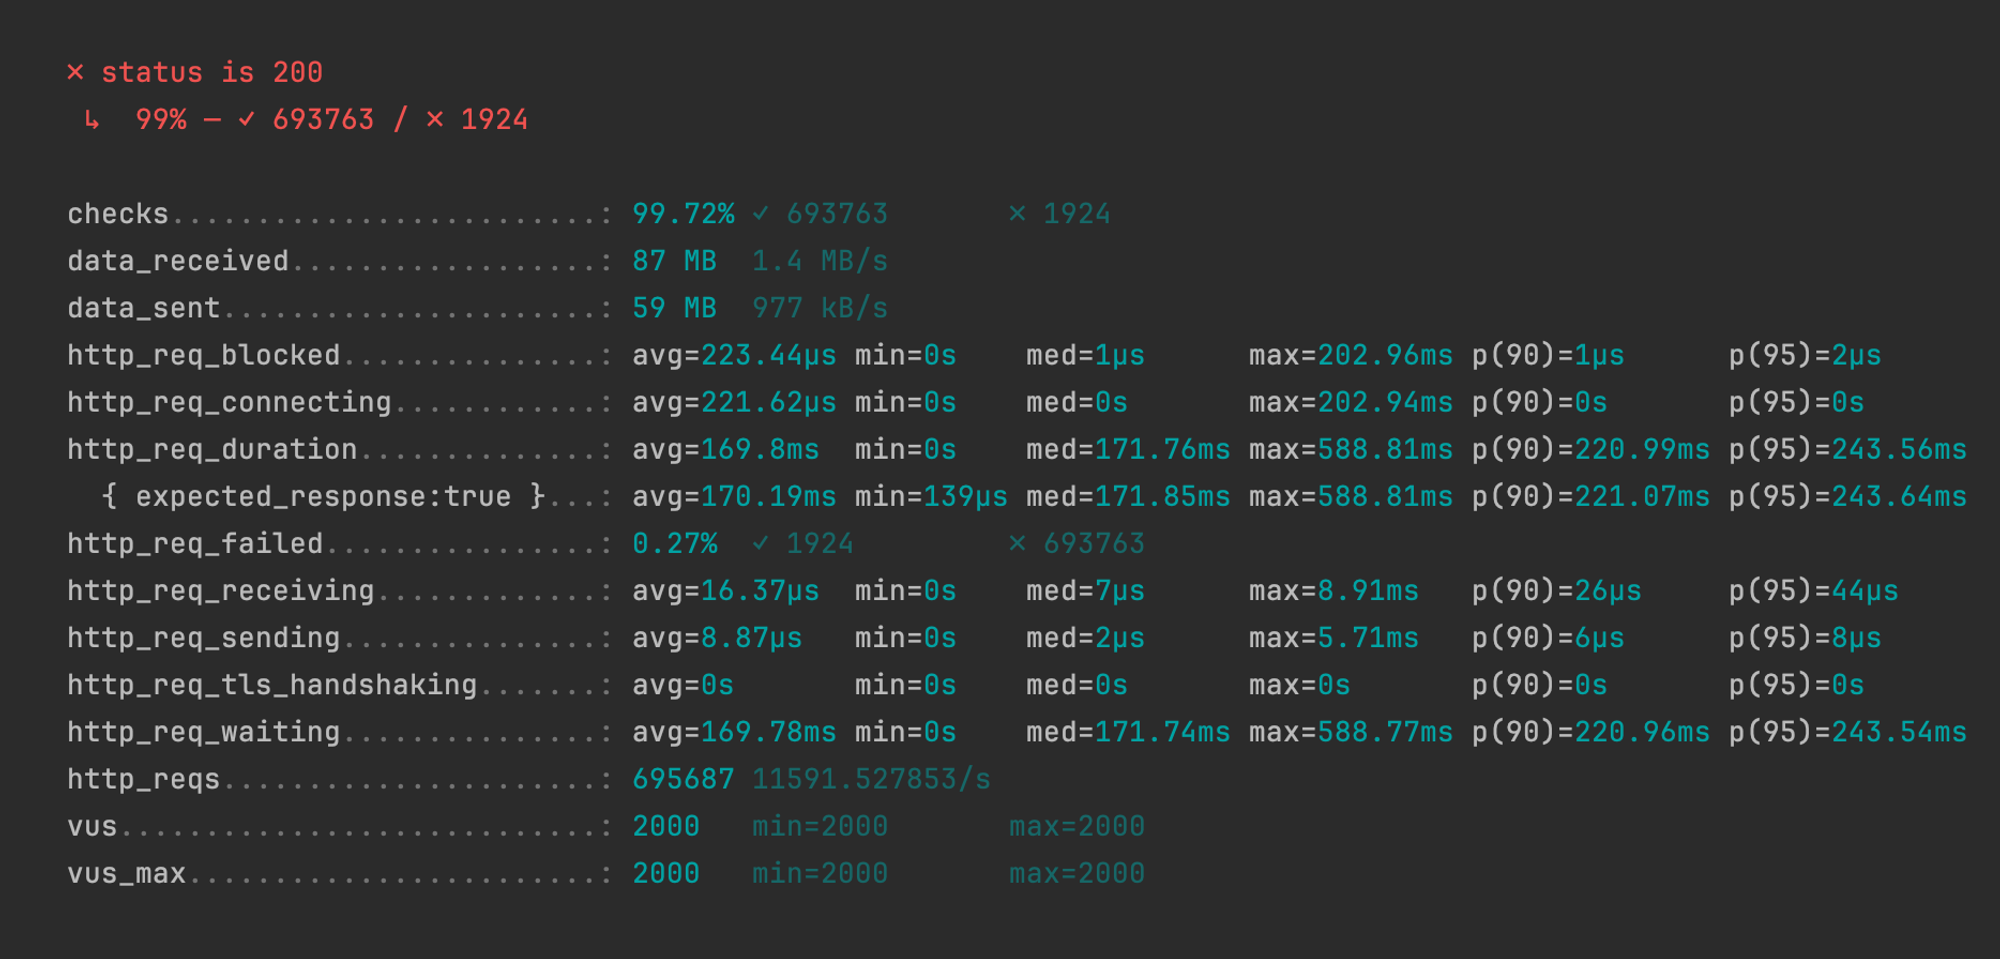
Using a standard load testing tool, we subjected a server application to a high number of HTTP requests. The goal was to observe how the application performed under two different memory allocations—256 MB and 512 MB. Here's what we found:
Test Results and Analysis
1. Increased Capacity to Handle Requests
256 MB Limit: Processed approximately 695,687 requests.
512 MB Limit: Handled about 2,027,103 requests.
Insight: More than doubling the memory allowed the server to process almost three times the number of requests. This substantial increase indicates that the server was less constrained by memory and could manage more concurrent processes.
2. Improved Success Rates
256 MB Limit: 99.72% success rate.
512 MB Limit: 99.90% success rate.
Insight: The slight increase in success rate with more memory suggests better stability and fewer errors related to memory constraints, crucial for maintaining user trust and application reliability.
3. Enhanced Response Times
256 MB Limit: Average response time was 170.19 milliseconds.
512 MB Limit: Improved to 57.91 milliseconds.
Insight: The response time improved by approximately 66% with increased memory. This improvement highlights faster processing times, leading to better user experiences during high traffic periods.
4. Peak Load Handling
256 MB Limit: Maximum response time peaked at 588.81 milliseconds.
512 MB Limit: Reduced to 315.77 milliseconds.
Insight: The application under a higher memory limit demonstrated a better capacity to handle peak loads, which is vital for applications expecting variable traffic.
Resource Utilization
The data throughput also saw a significant increase:
Data Received: From 87 MB to 254 MB.
Data Sent: From 59 MB to 170 MB.
Insight: The server was able to send and receive more data, indicating more efficient use of network resources.
Reduction in Failures
Failure Rate: Dropped from 0.27% to 0.09%.
Insight: Fewer failed requests indicate a more robust system less likely to encounter disruptions during critical operations.
Conclusion
The case study clearly demonstrates that for applications under significant load, increasing the memory allocation can lead to substantial improvements in performance, reliability, and user satisfaction. While doubling the memory in our tests led to notable gains across various metrics, it's important for system administrators and developers to consider the cost versus benefits of such upgrades in their specific environments.
Understanding the resource needs of your application through thorough testing and analysis like this helps in making informed decisions that balance performance, cost, and reliability effectively.
| 성능 지표 | 256 MB 한도 | 512 MB 한도 | 설명 |
|---|---|---|---|
| 처리 요청 수 | 695,687 요청 | 2,027,103 요청 | 처리량 약 193% 증가. |
| 성공률 | 99.72% 성공 | 99.90% 성공 | 성공률 향상은 안정성 개선과 오류 감소를 나타냅니다. |
| 평균 응답 시간 | 170.19 ms | 57.91 ms | 약 66% 개선; 고트래픽 시 빠른 처리 시간. |
| 최대 응답 시간 | 588.81 ms | 315.77 ms | 약 46% 감소; 피크 부하 관리 개선. |
| 수신 데이터 | 87 MB | 254 MB | 약 192% 증가, 처리량 향상을 나타냅니다. |
| 송신 데이터 | 59 MB | 170 MB | 약 188% 증가, 메모리 증가로 네트워크 처리량 증가 |
| 실패율 | 0.27% | 0.09% | 실패율 약 67% 감소 시스템 안정성 개선 |


Tips for load test with K6
We can easily create k6 load test scripts using Swagger or Postman.
Here are the official documentation links for reference
https://k6.io/blog/load-testing-your-api-with-swagger-openapi-and-k6/
