GeoDjango
django의 지리학적 모듈인 geodjango를 이제 사용해볼것이다.
이를 사용하기 위해서는 필수적으로 GDAL을 깔아주어야한다.
GDAL
GDAL은 래스터 및 벡터 지리 공간 데이터를 조작 할 수 있는 오픈 소스 라이브러리이다.
- 라이브러리로서 지원되는 모든 형식의 호출 응용 프로그램에 단일 추상 데이터 모델을 제공한다
- 데이터 변환 및 처리를 위한 다양한 명령 행 인터페이스 유틸리티가 제공된다
맥에서의 GDAL설치 명령어는 매우 간단하다. 맥 최고😭!! 옆에서 윈도우 사용하는 분은 이거 설치하는데 오류가 너무 많이 나서 아예 포맷하고 다시 깔았다고 한다...
brew install gdal
INSTALLED_APPS에 django.contrib.gis모듈을 추가 해주어서 geodjango를 활성화시켜준다.
dis_map/dis_map/settings.py
INSTALLED_APPS = [
    "django.contrib.admin",
    "django.contrib.auth",
    "django.contrib.contenttypes",
    "django.contrib.sessions",
    "django.contrib.messages",
    "django.contrib.staticfiles",
    "django.contrib.gis",
    "markers",
]
PostGIS

- PostGIS는 PostgreSQL의 확장 기능이며 GeoDjango를 위한 최고의 데이터베이스 백엔드이기도 하다
- 공간 데이터를 내부적으로 통합하며, 공간 데이터 유형, 인덱스 및 기능을 가지고 있다
PostGIS을 사용하기 위해서 PostgreSQL을 먼저 깔아주어야 하고 그 외에도 django나 psycopg2를 깔아주어야 한다.
psycopg2 설치 명령어는 위에랑 동일하게 brew install psycopg2이다.
dis_map/dis_map/settings.py
DATABASES = {
    "default": {
        "ENGINE": "django.contrib.gis.db.backends.postgis",
        "HOST": "database",
        "NAME": "mymap",
        "PASSWORD": "password",
        "PORT": 5432,
        "USER": "postgres",
    }
}
그 후에 생성한 데이터베이스로 settings.py를 설정 해주면 된다.
Mark 모델 생성하기
지도에 좌표를 표시할 Mark 모델을 이제 만들어보면
dis_map/markers/models.py
from django.contrib.gis.db import models

class Mark(models.Model):
    name = models.CharField(max_length=255) #좌표의 이름
    location = models.PointField() #좌표의 위치

    def __str__(self):
        return self.name
그 후에 어드민에서 인스턴스를 추가하거나 삭제할 수 있게 모델을 admin.py에도 추가해주었다.
dis_map/markers/admin.py
from django.contrib.gis import admin
from markers.models import Mark
@admin.register(Mark)
class MarkAdmin(admin.OSMGeoAdmin):
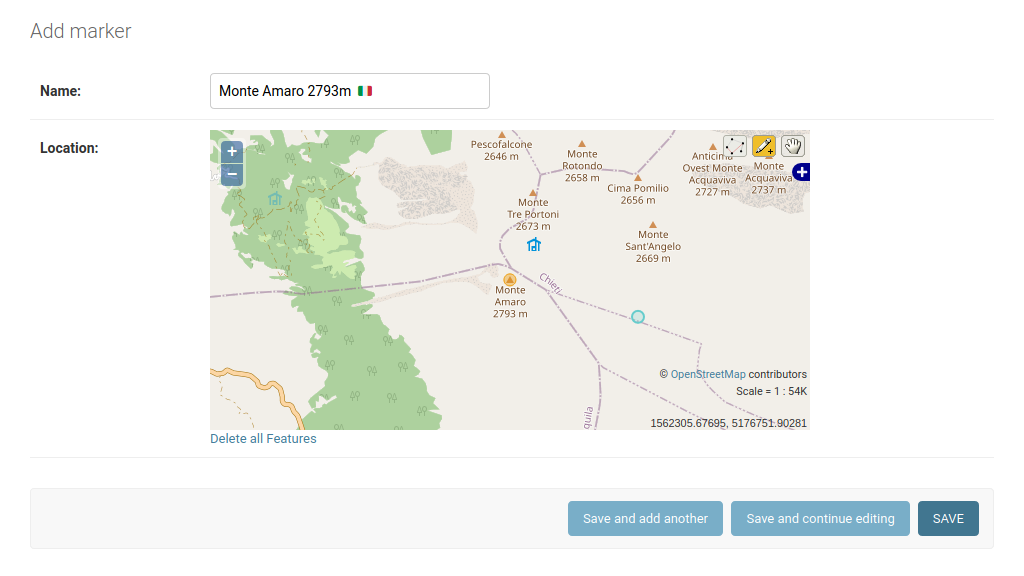
list_display = ("name", "location")마이그레이션하고 서버를 실행해서 어드민에 들어가면 이제 자신이 원하는 곳에 마크를 생성할 수 있다.
Mark를 지도에 표시하기
우선 밑에 표시되어 있는 것들을 다 설치해야 하고
dis_map/requirements.txt
django-filter~=21.1.0
djangorestframework-gis~=0.18.0
djangorestframework~=3.13.0
django~=4.0.0
psycopg2-binary~=2.9.0
그 후에 활성화 해주어야한다.
dis_map/dis_map/settings.py
INSTALLED_APPS = [
    "django.contrib.admin",
    "django.contrib.auth",
    "django.contrib.contenttypes",
    "django.contrib.sessions",
    "django.contrib.messages",
    "django.contrib.staticfiles",
    "django.contrib.gis",
    "rest_framework",
    "rest_framework_gis",
    "markers",
]
이제 Mark를 위한 serializer를 만들어 보겠다.
dis_map/markers/serializers.py
from rest_framework_gis import serializers
from markers.models import Mark

class MarkSerializer(serializers.GeoFeatureModelSerializer):
    class Meta:
        fields = ("id", "name")
        geo_field = "location"
        model = Mark
'rest_framework_gis' serializer를 상속받으면 Marker 모델, 지리적 필드 'location' 및 선택적 필드만 정의하면 추가 속성으로 표시된다.
여기까지 잘 따라 왔으면 이제 viewset만 만들어주고 url도 추가해주면 된다.
dis_map/markers/views.py
from rest_framework import viewsets
from rest_framework_gis import filters
from markers.models import Mark
from markers.serializers import MarkSerializer


class MarkViewSet(viewsets.ReadOnlyModelViewSet):
    bbox_filter_field = "location"
    filter_backends = (filters.InBBoxFilter,)
    queryset = Mark.objects.all()
    serializer_class = MarkSerializer
dis_map/markers/urls.py
from django.urls import path, include
from .views import MapView, MarkViewSet, TweetView, BoundarySet
from rest_framework import routers

app_name = "markers"

router = routers.DefaultRouter()
router.register(r"markers", MarkViewSet)

urlpatterns = [
    path('', include(router.urls)),
    path("map/", MapView.as_view())
]
이제 django에서는 모든 준비가 끝났다. 마지막으로 javascript에서 연결만 해주면된다.
우선 사용자의 위치를 정해주었다. 긍정적인 경우에는 사용자의 위치를 사용하여 지도를 중앙에 배치하고, 부정적인 경우에는 지도의 임의의 지점에서 낮은 확대/축소 레벨로 위치를 지정했다.
또한 마커 layer를 구축하기 위해 엔드포인트에 데이터를 비동기적으로 요청하고 팝업에서 표시할 속성을 추출했다.
dis_map/markers/static/map.js
const copy = "© <a href='https://www.openstreetmap.org/copyright'>OpenStreetMap</a> contributors";
const url = "https://{s}.tile.openstreetmap.org/{z}/{x}/{y}.png";
const osm = L.tileLayer(url, { attribution: copy });
const map = L.map("map", { layers: [osm], minZoom: 7 });
map.
locate()
.on("locationfound", (e) => map.setView(e.latlng, 11))
.on("locationerror", () => map.setView([37.5664700, 126.9779630], 11)); //임의의 위치 서울로 지정
// To build the marker layer, we ask our endpoint for data asynchronously and extract the properties we want to show in the pop-ups.
async function load_markers() {
const markers_url = `/api/markers/?in_bbox=${map.getBounds().toBBoxString()}`
const response = await fetch(markers_url)
const geojson = await response.json()
return geojson
}
async function render_markers() {
const markers = await load_markers();
L.geoJSON(markers)
.bindPopup((layer) => layer.feature.properties.name)
.addTo(map);
}
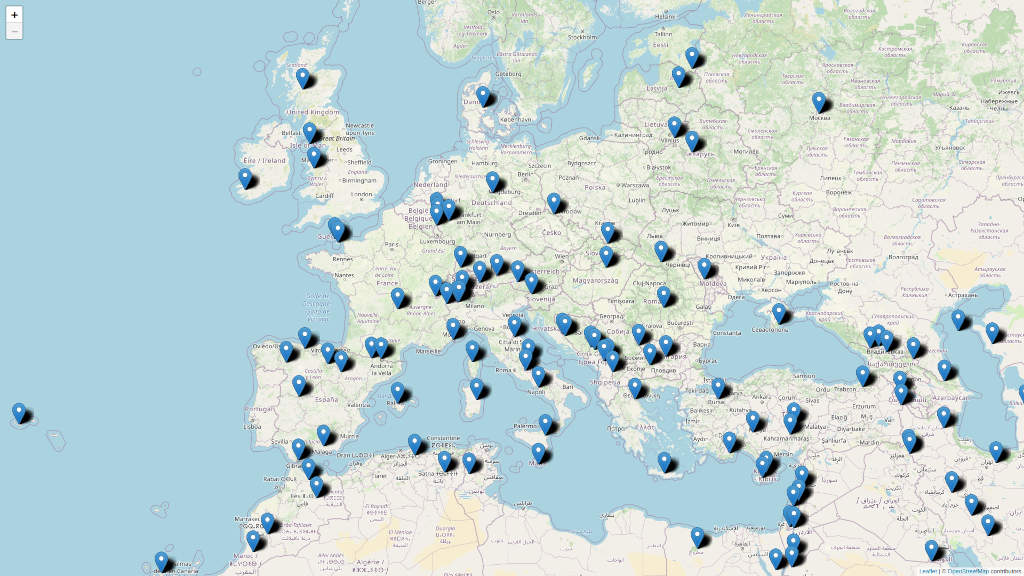
map.on("moveend", render_markers);이제 서버를 실행하면 자신이 찍은 좌표들이 지도에 나타날 것이다.