
[ 개요 ]
최근에 친구와 둘이서 제작한 토이 프로젝트를 AWS Lightsail에 배포했다.
그런데 Lightsail CPU 정책에 따른 문제점이 있었고, 이에 따라 k3s Cluster에 있는 리소스들이 죽는 경험을 했다.
뿐만 아니라, 비즈니스 로직에서 예외가 발생하는 경우도 종종 있었다.
결론적으로, 운영 환경에서 ubuntu 서버, k3s cluster, spring app 에 대한 모니터링의 필요성을 느꼈다.
이번 글에서는 모니터링을 구성하기 위해 했던 작업들을 정리하고자 한다.
[ Prometheus ]
프로메테우스는 메트릭 수집, 시각화, 알림, 서비스 디스커버리 기능을 모두 제공하는 오픈 소스 모니터링 시스템이다.
- AppOptics
- CloudWatch
- Atlas
등 다양한 모니터링 시스템을 찾아볼 수 있었지만,
필자는 오픈 소스이고 많은 곳에서 활용 사례가 있는 프로메테우스를 선택했다.
[ Grafana ]
프로메테우스가 메트릭 수집을 담당하는 데이터베이스 같은 역할을 수행했다면,
그라파나는 프로메테우스에 저장된 데이터를 화면에 이쁘게 보여주는 대시보드 역할을 수행한다.
- Kibana
- Superset
등 다양한 대시보드 툴을 찾아볼 수 있었지만,
필자는 프로메테우스와 같은 이유로 오픈 소스이고 많은 곳에서 활용 사례가 있고 프로메테우스와 호환성이 좋은 그라파나를 선택했다.
[ 실습 ]
환경 : ubuntu 20.04 LTS, k3s
크게 2가지 대시보드를 구성했다.
1. Ubuntu Server Metrics
2. Spring Application Metrics
1. Ubuntu Server Metrics (Ubuntu metrics -> prometheus 형식)
Ubuntu Server의 Metrics를 수집해서 Prometheus 형식으로 변환하고 endpoint를 제공하기 위한 도구가 필요하다.
프로메테우스 진영에서는 node_exporter 도구를 제공한다.
node_exporter_github
apiVersion: apps/v1
kind: Deployment
metadata:
  name: node-exporter
spec:
  selector:
    matchLabels:
      app: node-exporter
  template:
    metadata:
      labels:
        app: node-exporter
    spec:
      containers:
        - name: node-exporter
          image: prom/node-exporter:latest
          ports:
            - containerPort: 9100

---
# node-exporter service (cluster IP)
apiVersion: v1
kind: Service
metadata:
  name: node-exporter
spec:
  selector:
    app: node-exporter
  ports:
    - protocol: TCP
      port: 9100
      targetPort: 9100
9100번 포트로 endpoint를 설정했다.
2. Spring Application Metrics (Spring metrics -> prometheus 형식)
Spring Actuator를 사용해서 Application Metrics를 Prometheus 형식으로 변환 해줄 수 있다.
먼저 build.gradle 에 의존성을 추가해준다.
// spring actuator
implementation 'org.springframework.boot:spring-boot-starter-actuator'
// prometheus
implementation 'io.micrometer:micrometer-registry-prometheus'
이어서 application.yml 에 설정을 추가해준다.
server:
  port: 8000

---
management:
  endpoints:
    web:
      exposure:
        include: prometheus
정상적으로 등록이 되었다면 /actuator/prometheus endpoint에서 metrics를 확인할 수 있다.
Prometheus 작업 설정 및 Metrics 수집
이제 위에서 작업한 Ubuntu, Spring endpoint에서 제공하는 metrics를 Prometheus가 가져오도록 설정하면 된다.
apiVersion: v1
kind: ConfigMap
metadata:
  name: prometheus-config
data:
  prometheus.yml: |
    global:
      scrape_interval: 1m # Scraping 간격을 1분으로 설정

    scrape_configs:
      - job_name: "node"
        static_configs:
          - targets: ["node-exporter:9100"]

      - job_name: "spring-actuator"
        metrics_path: "/actuator/prometheus"
        scrape_interval: 1m
        static_configs:
- targets: ["gateway-svc:8000"]apiVersion: apps/v1
kind: Deployment
metadata:
name: prometheus
spec:
selector:
matchLabels:
app: prometheus
template:
metadata:
labels:
app: prometheus
spec:
containers:
- name: prometheus
image: prom/prometheus:latest
ports:
- containerPort: 9090
envFrom:
- configMapRef:
name: prometheus-config # configMap에 등록된 리소스를 적용
---
# prometheus service (clusterIp)
apiVersion: v1
kind: Service
metadata:
name: prometheus
spec:
selector:
app: prometheus
ports:
- protocol: TCP
port: 9090
targetPort: 90909090 포트로 endpoint를 설정했다.
Grafana 대시보드 구축
이제 프로메테우스에 저장된 metrics를 화면에 이쁘게 보여줄 작업만 남았다.
apiVersion: apps/v1
kind: Deployment
metadata:
  name: grafana-dp
spec:
  selector:
    matchLabels:
      app: grafana
  template:
    metadata:
      labels:
        app: grafana
    spec:
      containers:
        - name: grafana
          image: grafana/grafana:latest
          ports:
            - containerPort: 3000
          env:
            - name: GF_SECURITY_ADMIN_USER
              value: "admin"
            - name: GF_SECURITY_ADMIN_PASSWORD
              value: "admin"

---
# grafana service (nodePort)
apiVersion: v1
kind: Service
metadata:
  name: grafana-svc
spec:
  type: NodePort
  ports:
    - port: 3000
      targetPort: 3000
      nodePort: 31000
  selector:
    app: grafana
31000으로 외부에서 접속할 수 있도록 설정했다. (nodeport)
접속하면 /login 페이지로 이동하게 된다.
위에서 설정한 아이디(admin) / 비밀번호(admin)을 입력해서 들어갈 수 있다.
접속 후에 DataSource를 설정해준다.
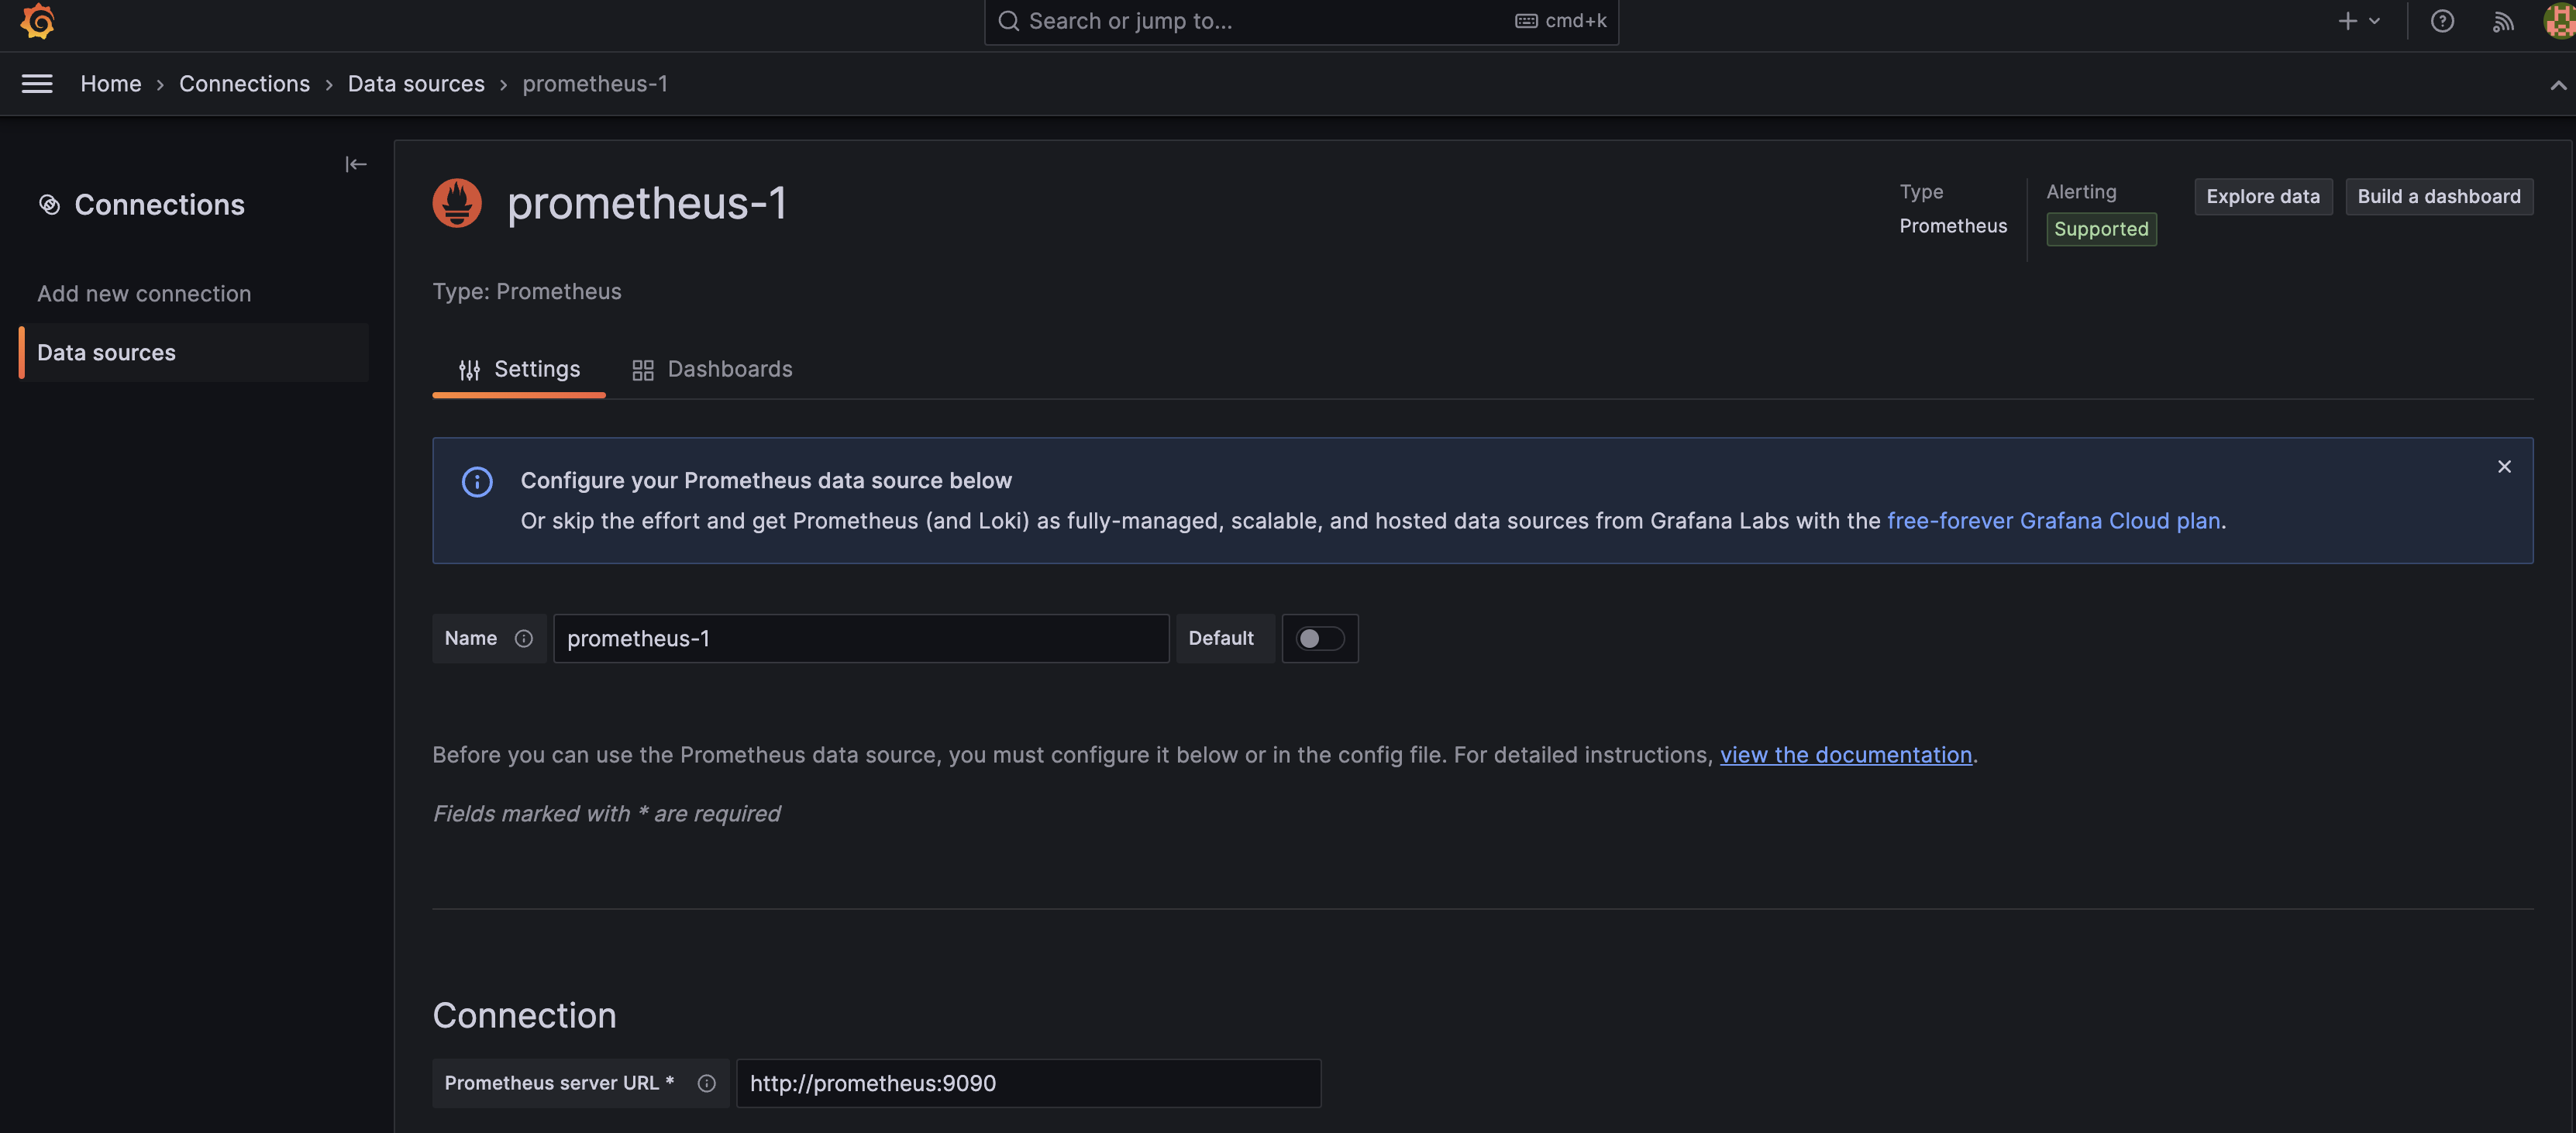
정상적으로 설정했는지 확인.

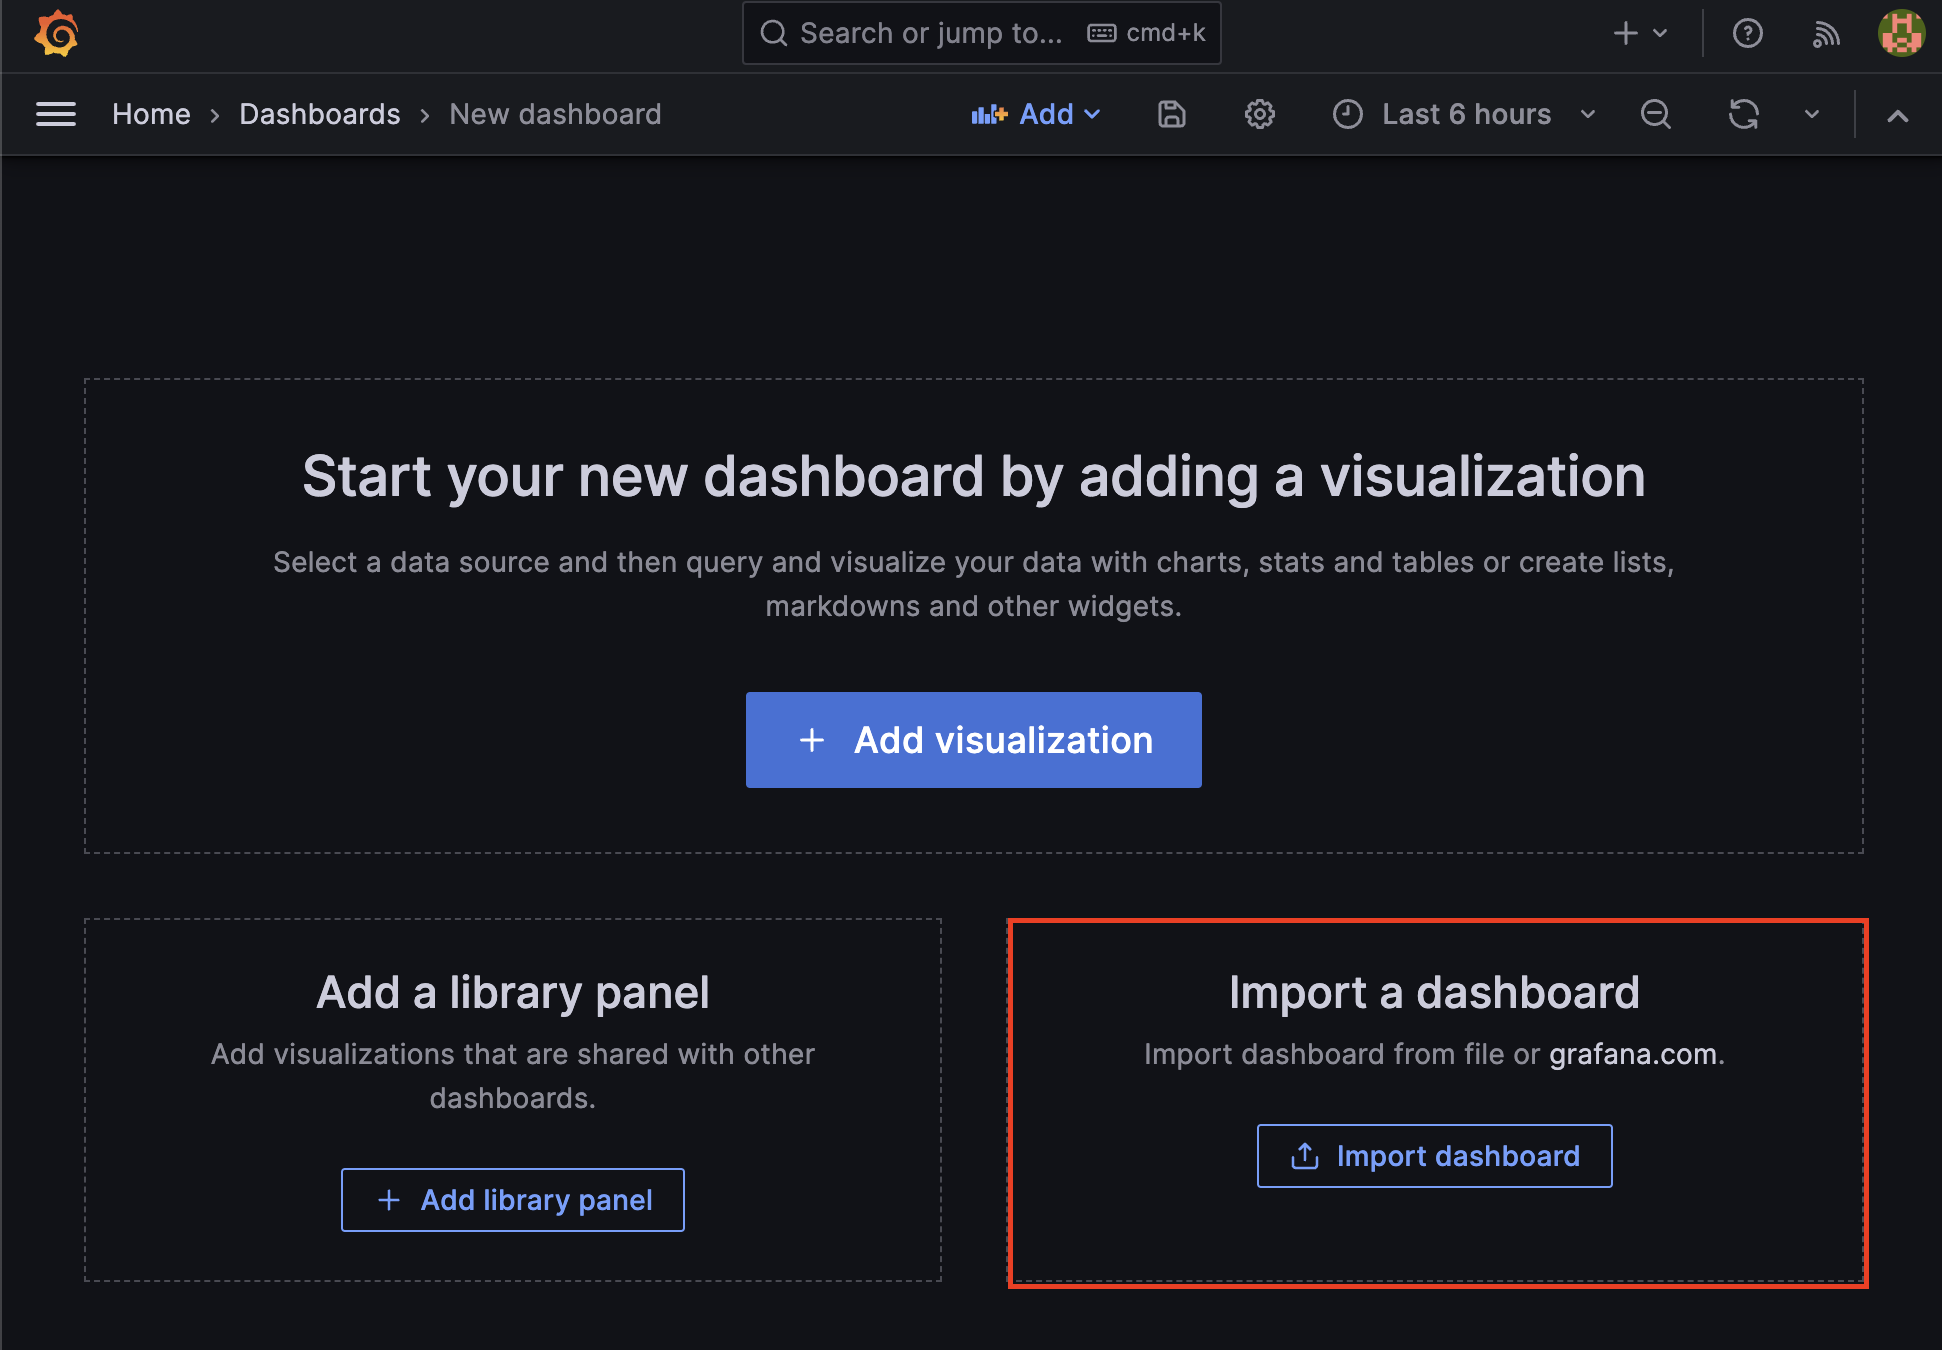
데이터를 이쁘게 보여주기 위해 잘 만들어진 대시보드를 사용할 수 있다.
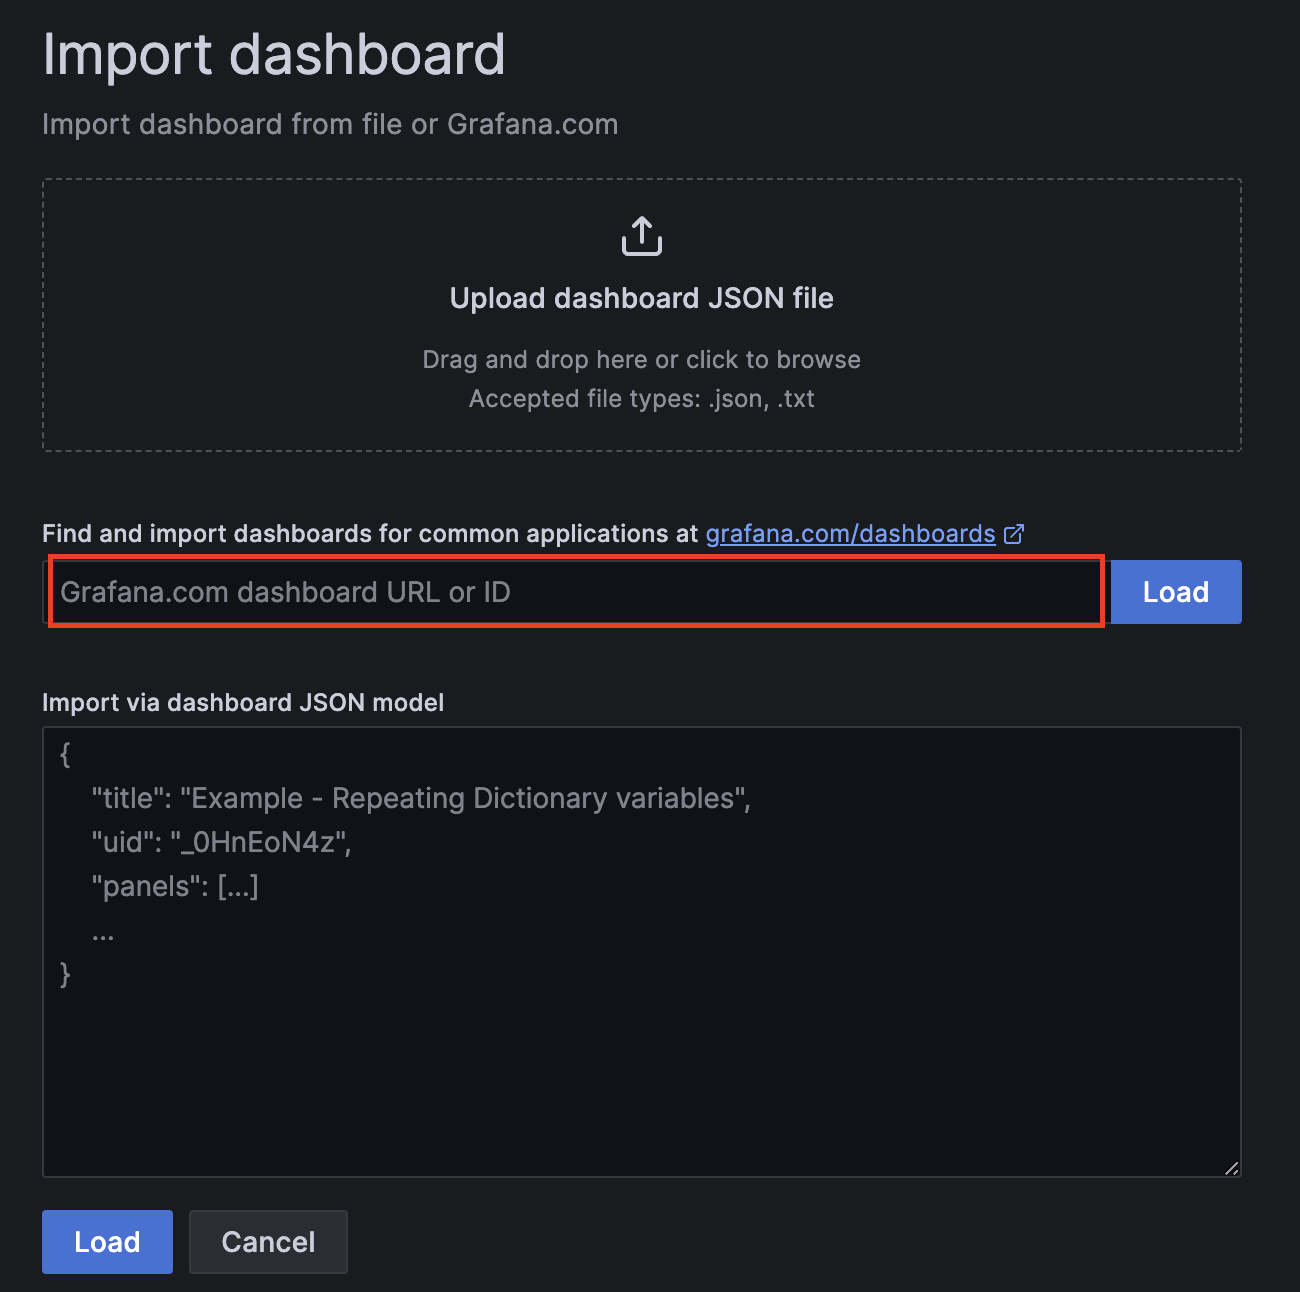
https://grafana.com/grafana/dashboards/
위 사이트에서 맘에드는 대시보드를 선택 & ID 복사
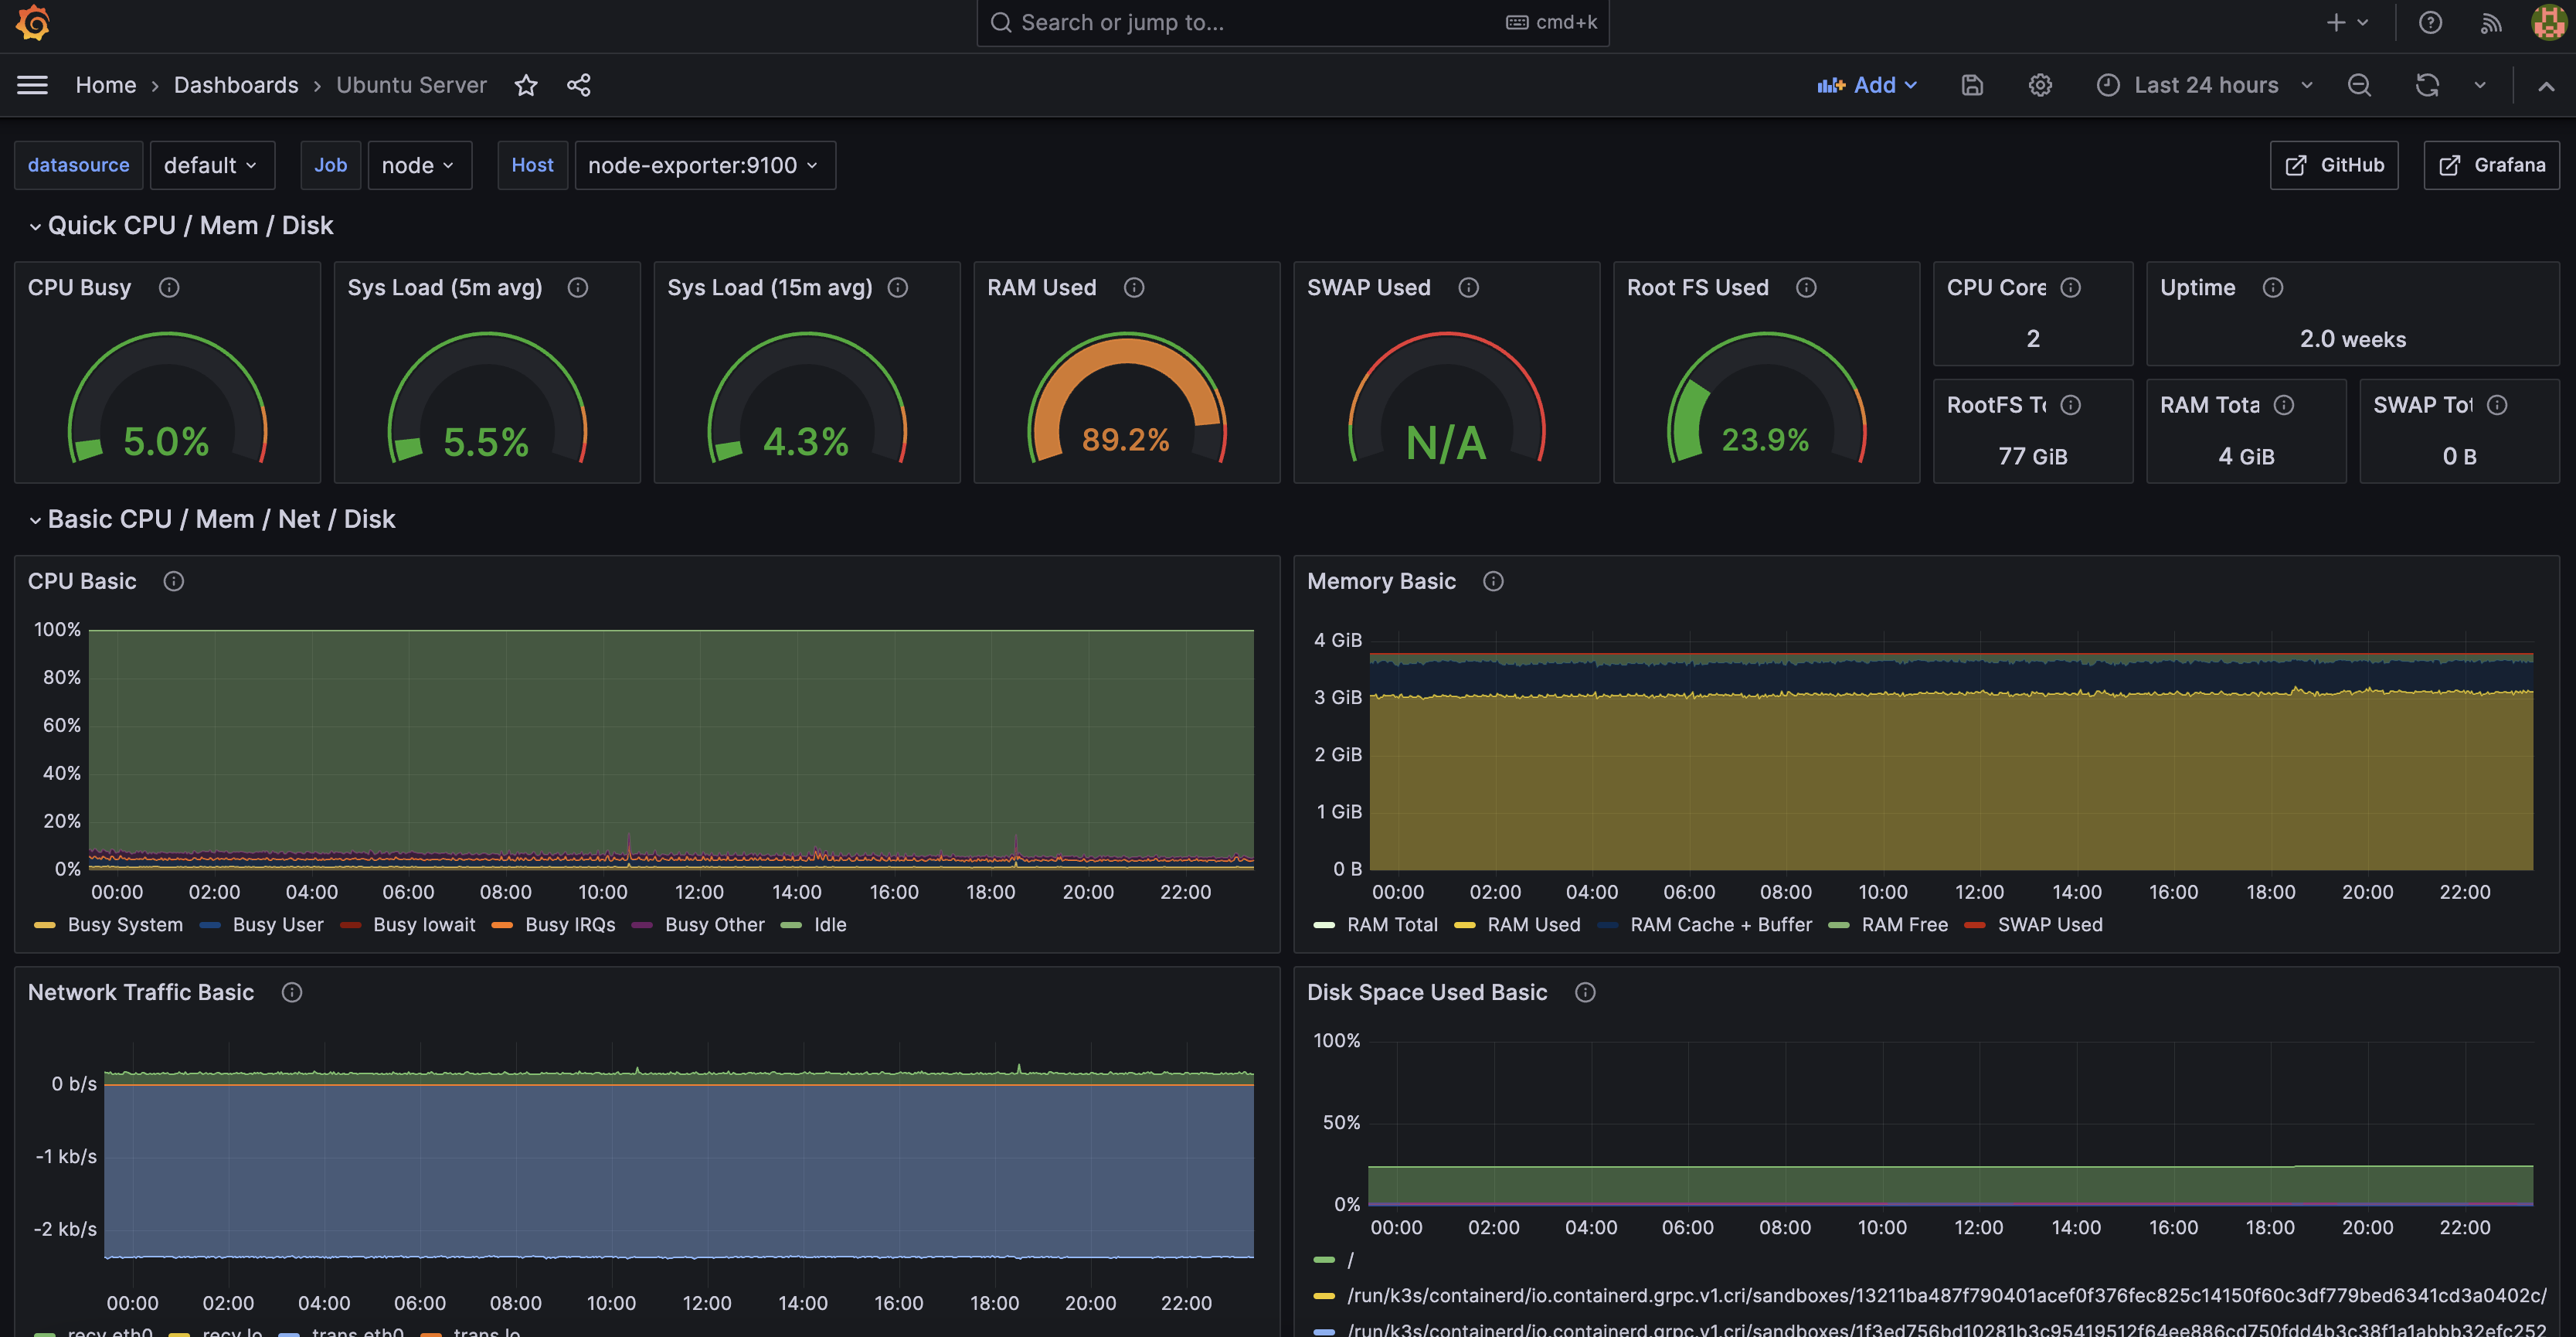
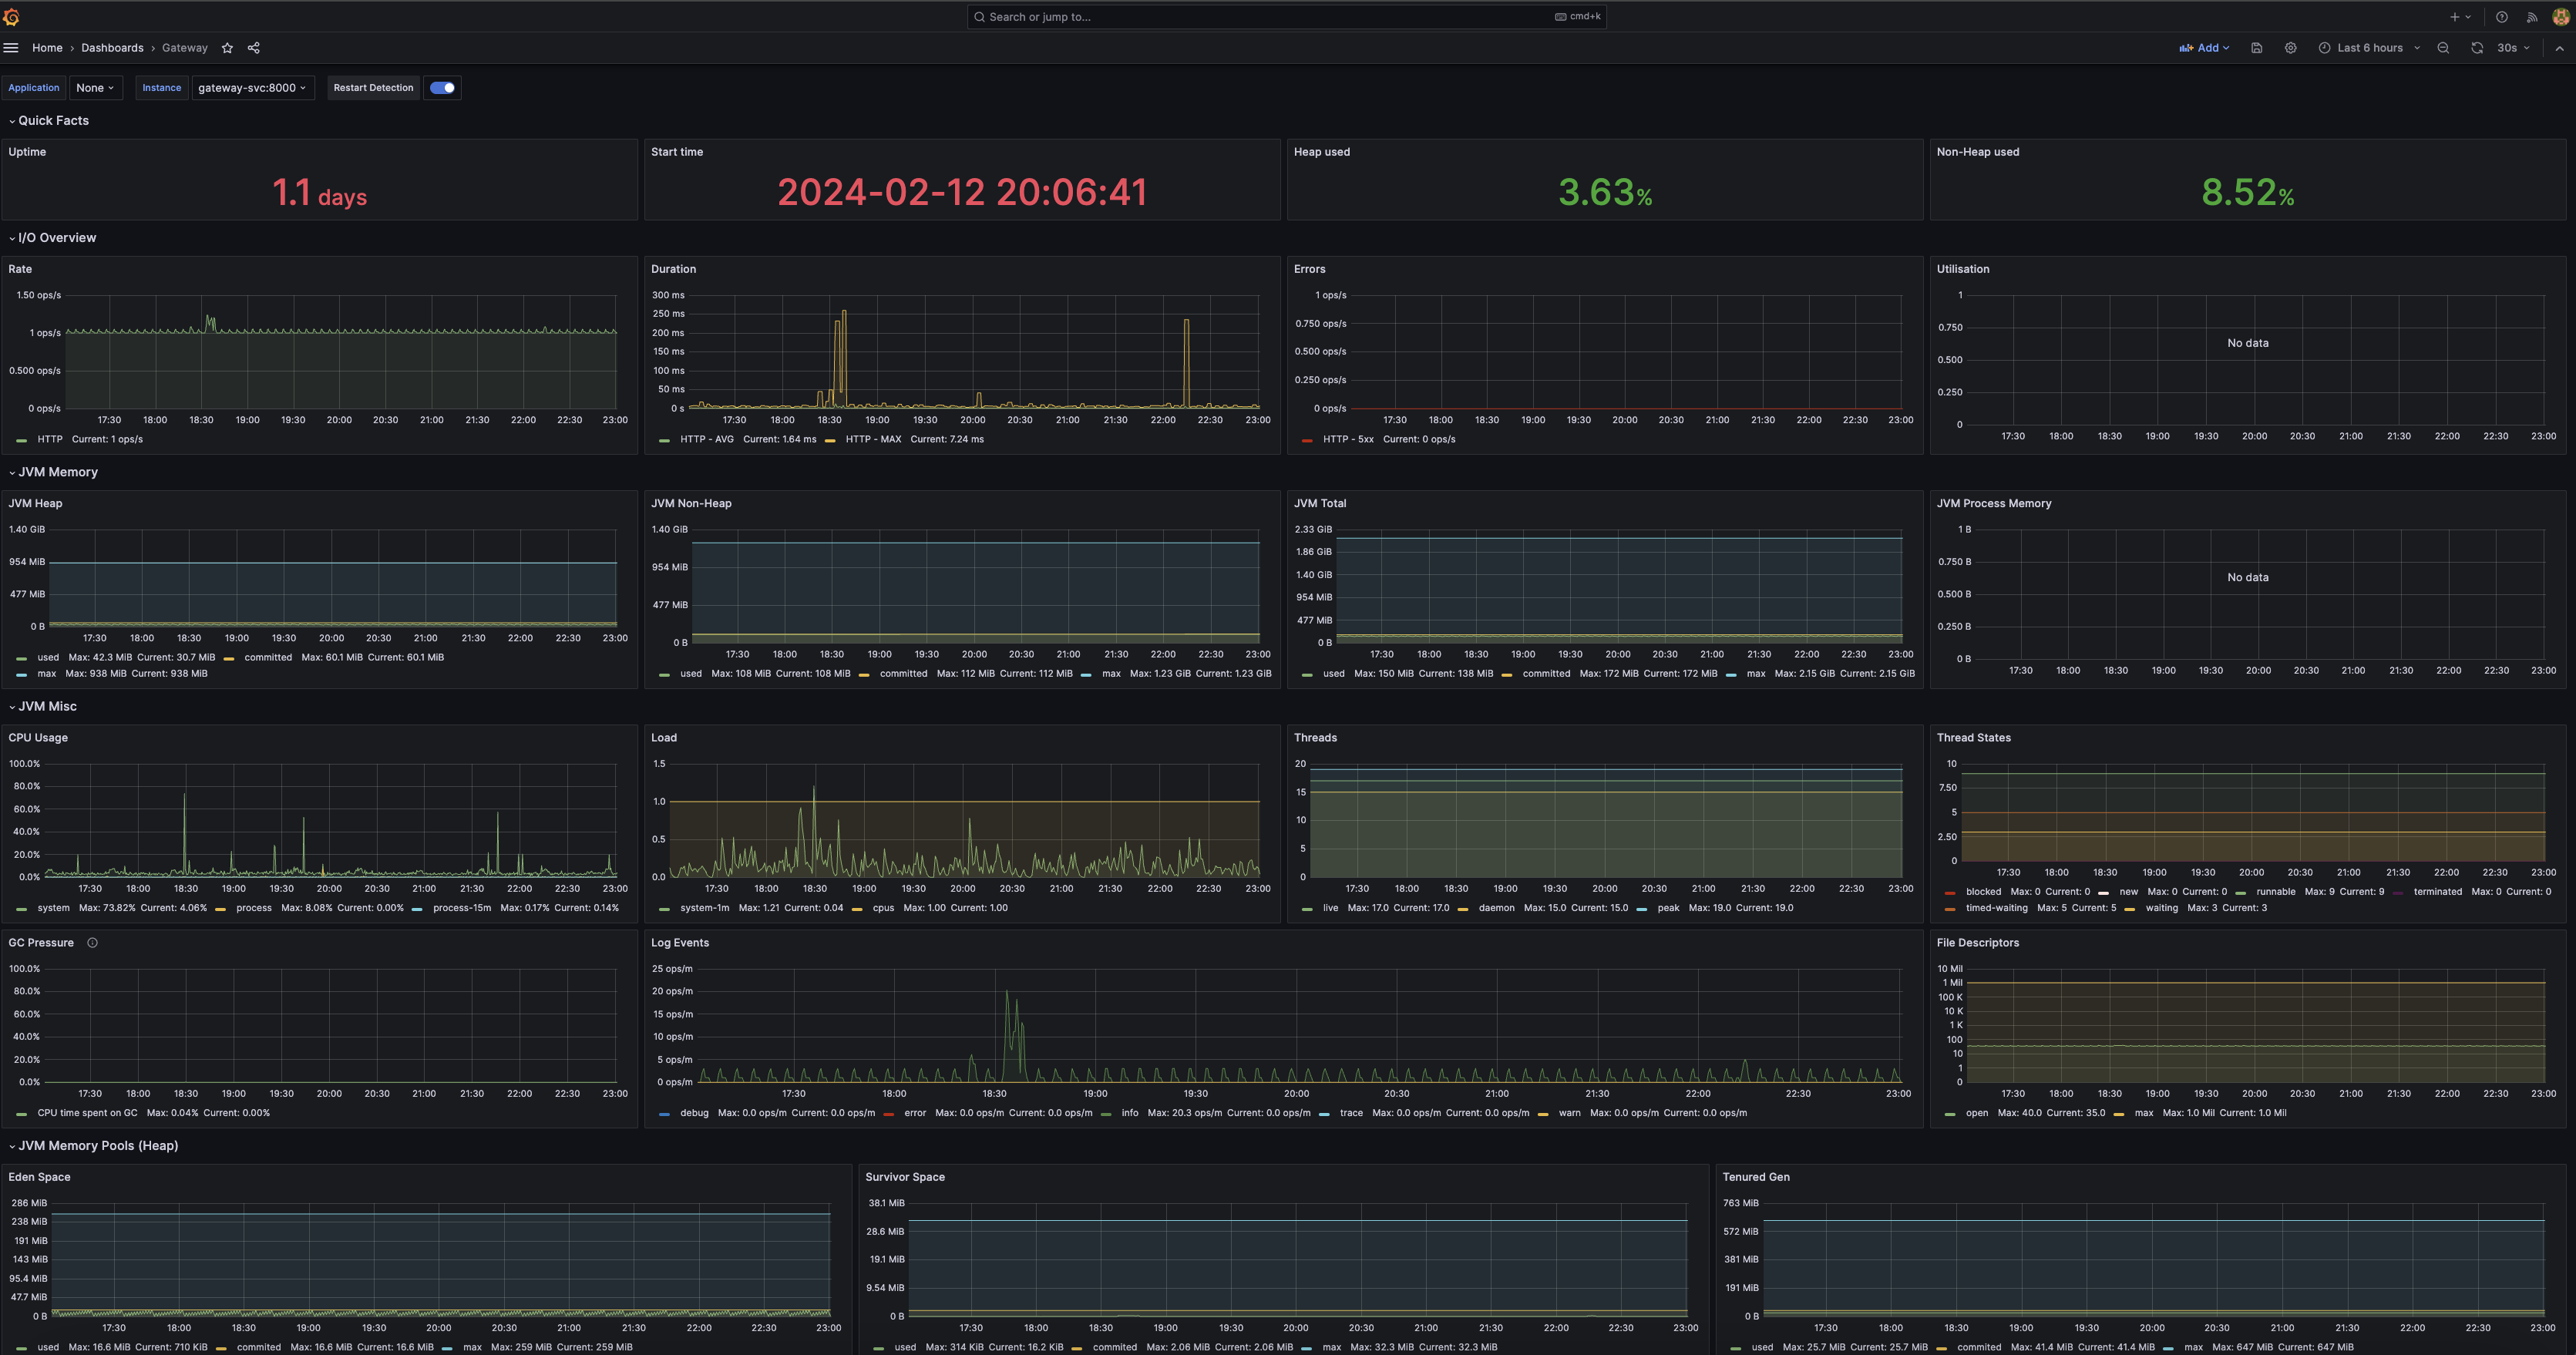
최종적으로 아래와 같이 이쁜 모니터링 화면을 만나볼 수 있다. :)
참고
- 참고로 Pod이 delete 되면 Metrics 또는 대시보드 설정이 사라지기 때문에 volume 설정이 필요하다.
- 또한 회원가입 숫자 등 비즈니스 로직의 메트릭을 수집하기 위해서는 Application에 추가적인 설정을 해주면 되니 필요한 경우 찾아보면 좋다.