Intro
이번 게시글은 JSON 형식으로 출력된 로그를 promtail에서 라벨링하여 grafana로 띄우는 작업을 진행하겠다.
promtail pipeline
promtail은 pipeline을 통해 데이터 parsing, transform, action, filtering 작업을 수행할 수 있다. 위 일련의 과정을 pipeline stages라 부른다. 각 과정에 대해 간략히 살펴보자.
parsing stages
여러 형식(standard docker format, regular expression, JSON 등)의 log line을 분석하고 데이터를 추출하는 단계이다. 대표적으로 regular expression을 활용하여 로그 데이터를 의미에 따라 나누거나 json 형식의 데이터를 분석하고 데이터를 추출할 수 있다. 또한, 데이터를 replace하거나 multiline을 통해 여러 log line을 하나의 log로 합칠 수 있다.(보통 stack trace를 합칠 때 유용할거 같다)
transform stages
이전 단계에서 추출한 데이터를 변환하는 단계이다. 대표적으로 Go templates을 활용하여 추출된 데이터를 수정하거나 추출된 값과 레이블을 로그 줄 내부에 배치할 수 있도록 JSON 개체에 로그 줄을 압축하는 작업(pack)을 할 수 있다.
action stages
이전 단계에서 추출된 데이터를 가져와서 이를 사용하여 작업을 수행한다.
- log line에서 label을 추가하거나 수정
- log line의 timestamp 변경
- log line의 content 변경
- 추출된 데이터를 기반으로 metric 생성
filtering stages
선택적으로 subset of stages를 적용하거나 일부 조건에 따라 항목을 삭제한다.
위 과정은 공식 문서에서 자세히 확인할 수 있다.
promtail config
server:
  http_listen_port: 9080
  grpc_listen_port: 0

positions:
  filename: /tmp/positions.yaml

clients:
  - url: http://loki:3100/loki/api/v1/push

scrape_configs:
  - job_name: info
    static_configs:
      - targets:
          - localhost
        labels:
          job: test_info_logs
          __path__: /logs/*/json-info-*.log
    pipeline_stages:
      - json:
          expressions:
            timestamp: timestamp
            logger: logger
            message: message
            thread: thread
            level: level
            mdc: mdc
      - labels:
          timestamp: ''
          logger: ''
          message: ''
          thread: ''
          level: ''
          mdc: ''
      - template:
          source: output_msg
          template: '{{ .timestamp }} {{ .message }}'
      - output:
          source: output_msg

  - job_name: warn
    static_configs:
      - targets:
          - localhost
        labels:
          job: test_warn_logs
          __path__: /logs/*/json-warn-*.log
    pipeline_stages:
      - json:
          expressions:
            timestamp: timestamp
            logger: logger
            message: message
            thread: thread
            level: level
            exception: exception
            mdc: mdc
      - labels:
          timestamp: ''
          logger: ''
          message: ''
          thread: ''
          level: ''
          mdc: ''
      - template:
          source: output_msg
          template: '{{ .timestamp }} {{ .message }} / stack trace: {{ .exception }}'
      - output:
          source: output_msg


  - job_name: error
    static_configs:
      - targets:
          - localhost
        labels:
          job: test_error_logs
          __path__: /logs/*/json-error-*.log
    pipeline_stages:
      - json:
          expressions:
            timestamp: timestamp
            logger: logger
            message: message
            thread: thread
            level: level
            exception: exception
            mdc: mdc
      - labels:
          timestamp: ''
          logger: ''
          message: ''
          thread: ''
          level: ''
          mdc: ''
      - template:
          source: output_msg
          template: '{{ .timestamp }} {{ .message }} / stack trace: {{ .exception }}'
      - output:
          source: output_msg
promtail config 설정은 이미 이전 게시글에서 설명했기에 이번에는 pipeline stages에 대해 설명하겠다.
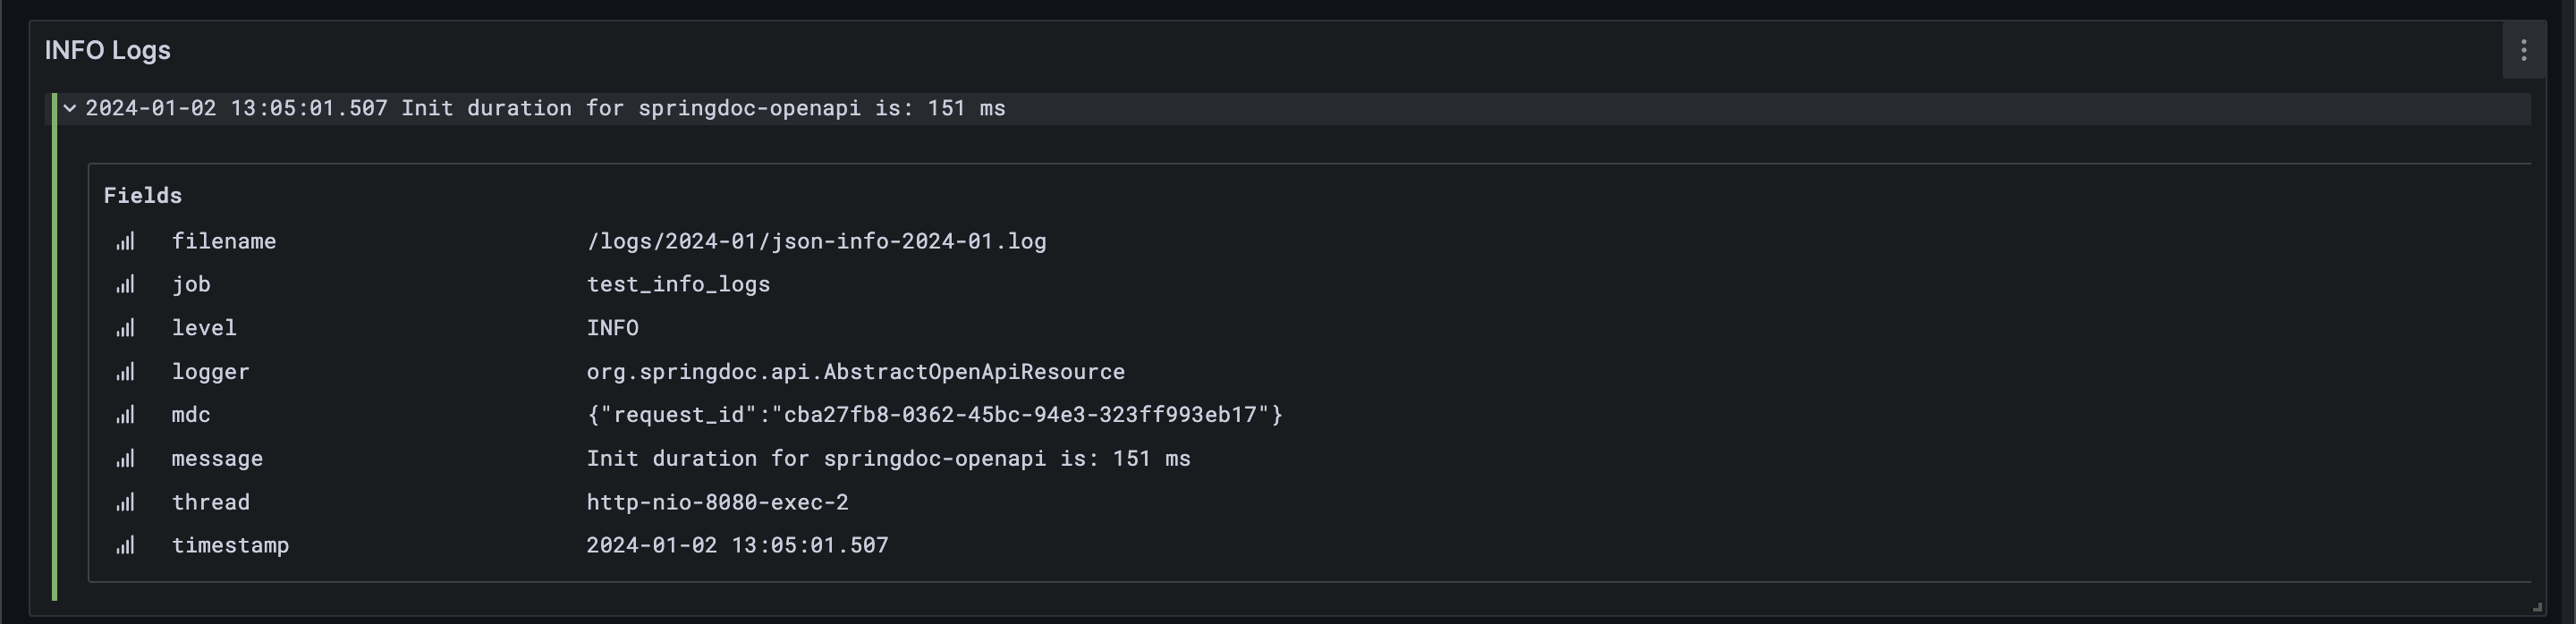
- parsing stage의 json 설정을 통해 json 구문을 분석하여 데이터를 추출한다. 오른쪽 값은 json key가 들어간다.
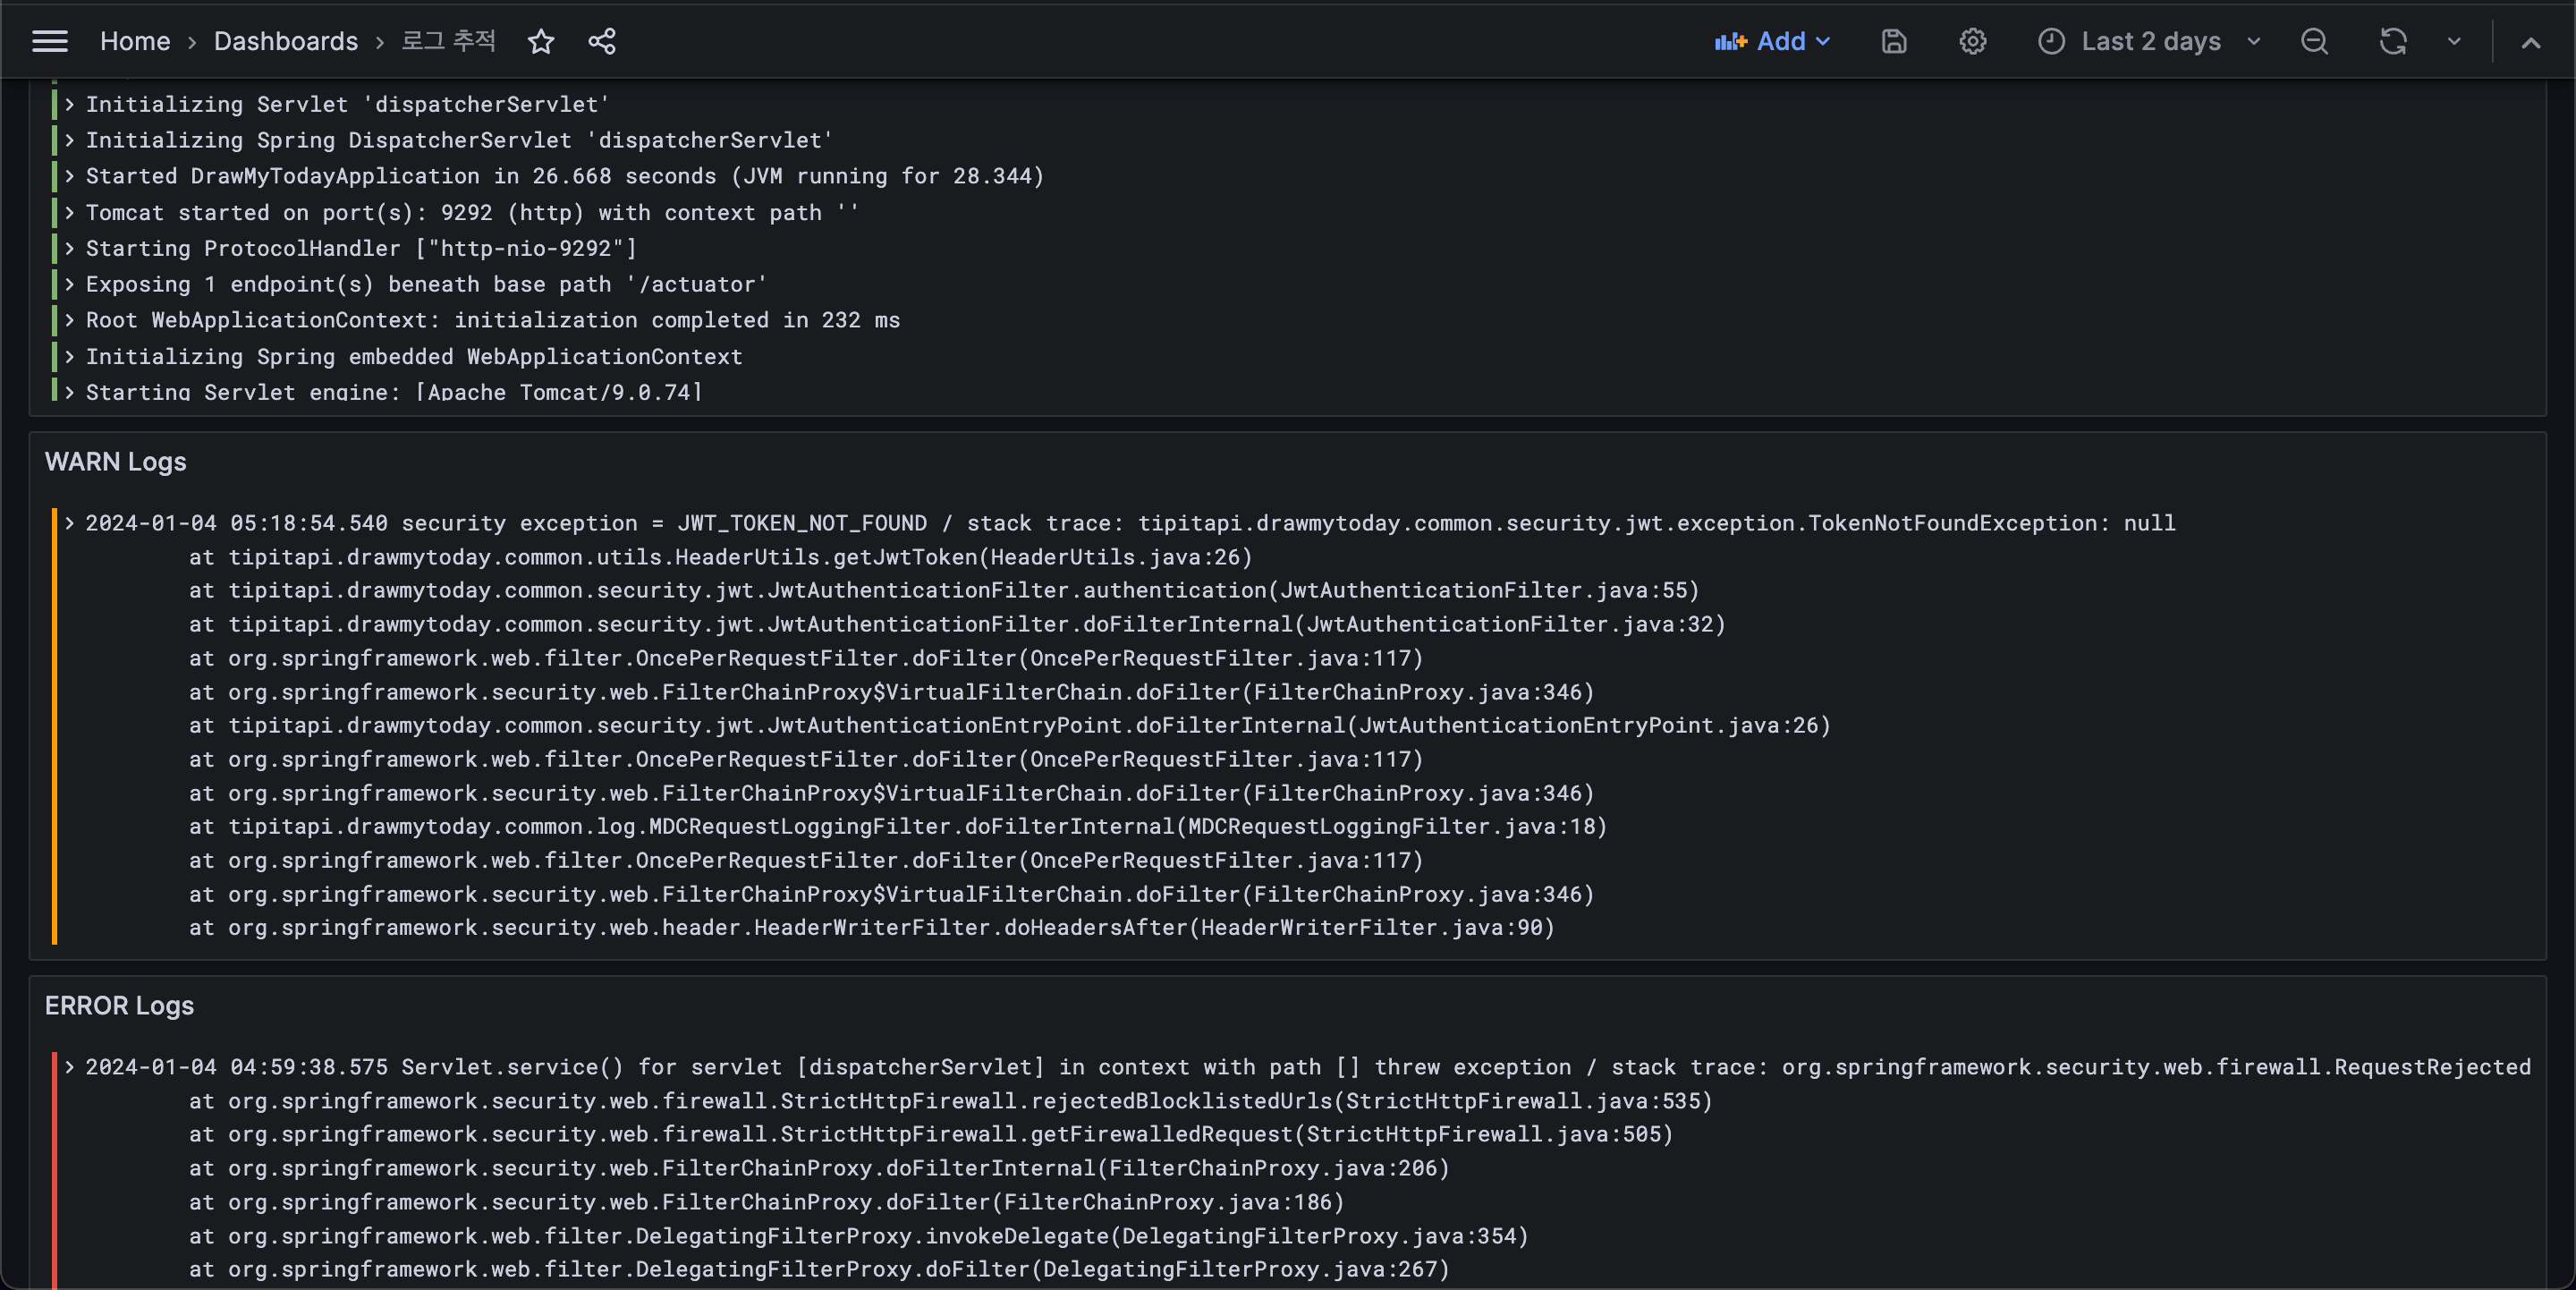
- transform stage의 template 설정을 통해 output message를 만들었다. warn과 error 로그는 stack trace까지 출력하도록 구성했다.
- action stage의 labels 설정을 통해 라벨링하거나 output으로 내보낼 데이터를 지정했다.
위처럼 설정한 이후 gradfana로 시각화하면 다음과 같은 결과를 얻을 수 있다.
참고