vsCode에서 Debugger for chrome Extension을 지원 중단하고, 자체 Js debug 도구를 사용 권장함.
JavaScript Debugger 을 설치하면 이전 Extension과 동일하게 사용 가능.
초기 세팅
launch.json
.vscode 폴더 내 launch.json 을 열어 url을 리액트 기본 포트인 3000으로 변경한다.
{
    "version": "0.2.0",
    "configurations": [
        {
            "type": "pwa-chrome",
            "request": "launch",
            "name": "Launch Chrome against localhost",
            "url": "http://localhost:3000",
            "webRoot": "${workspaceFolder}"
        }
    ]
}
package.json
package.json 스크립트에 start가 없으면 추가해준다.
  "scripts": {
    "start": "react-scripts start",
  },
실행
vscode Debug 탭에서 ‘Launch Chrome against localhost’와 ‘Run Script: start’를 두 개 모두 실행하면 오픈된 브라우저를 통해 vscode내에서 디버깅이 가능하다.
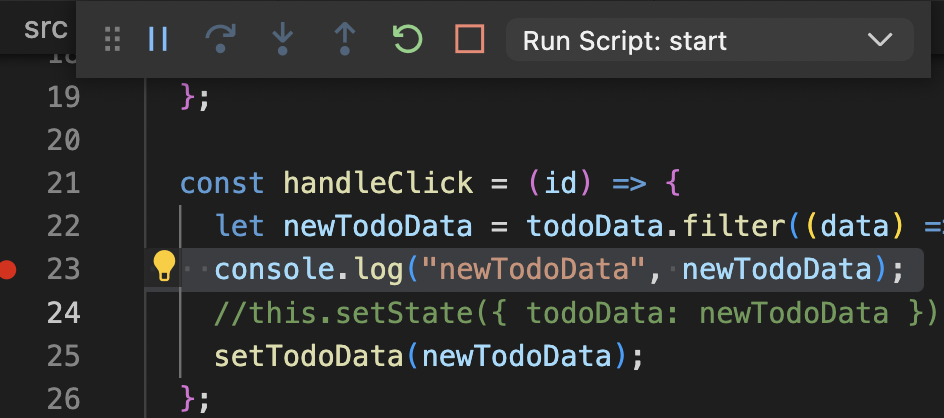
원하는 곳에 breakpoint를 찍어 디버깅 할 수 있으며, Variavles 값들도 확인 할 수 있어 유용하다.

꾸준한 성장