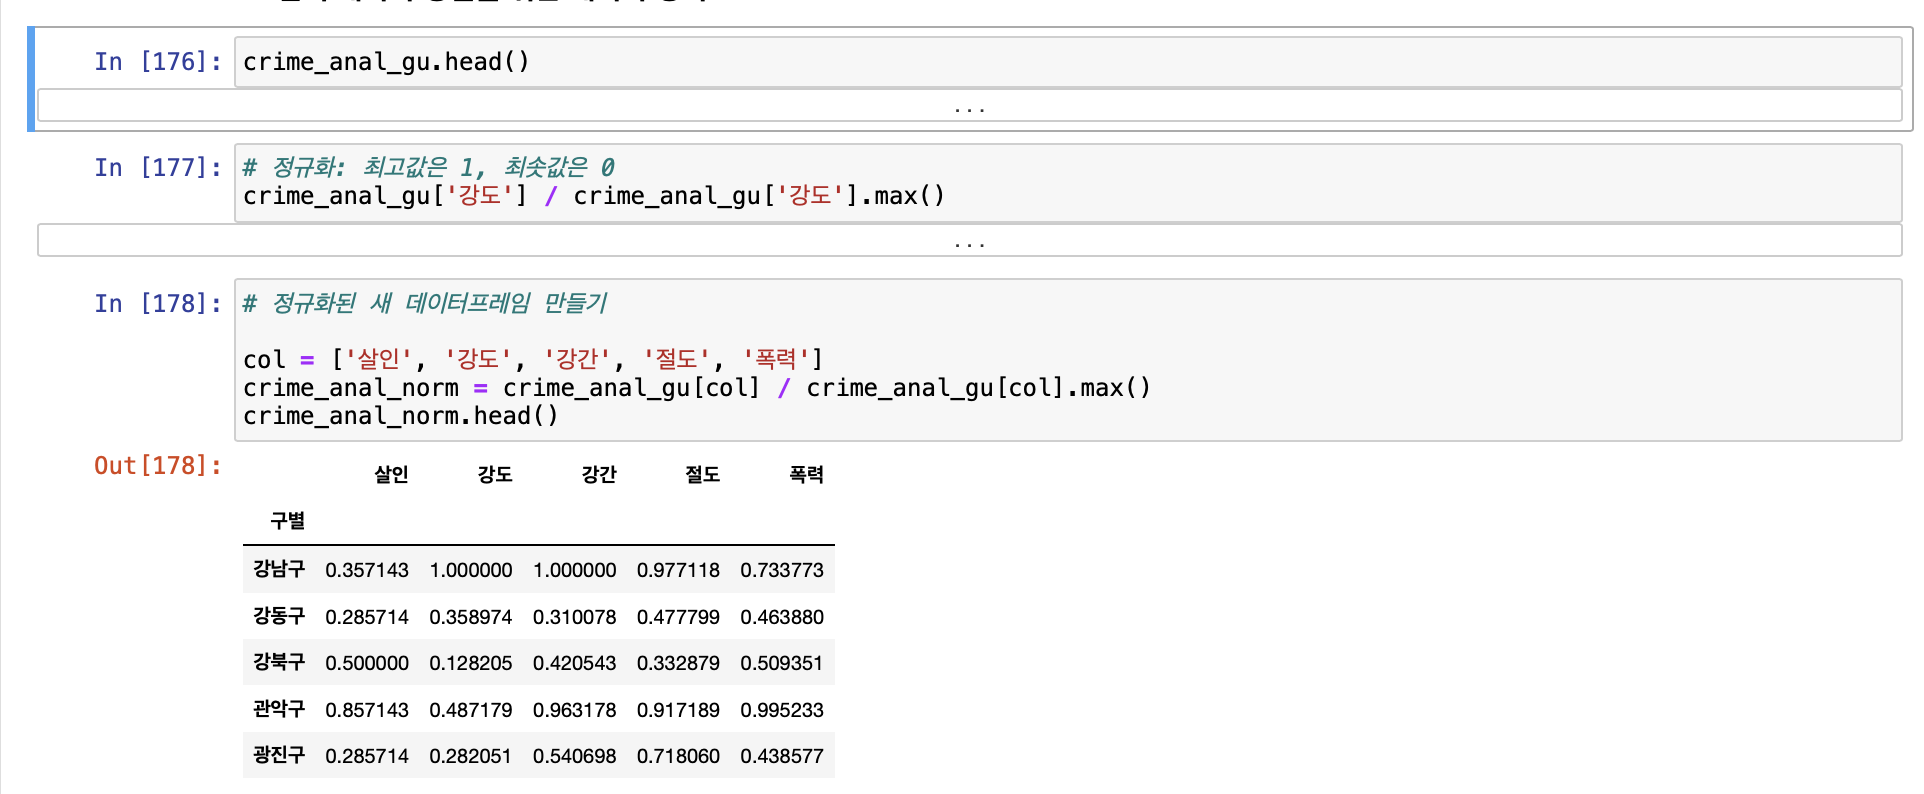
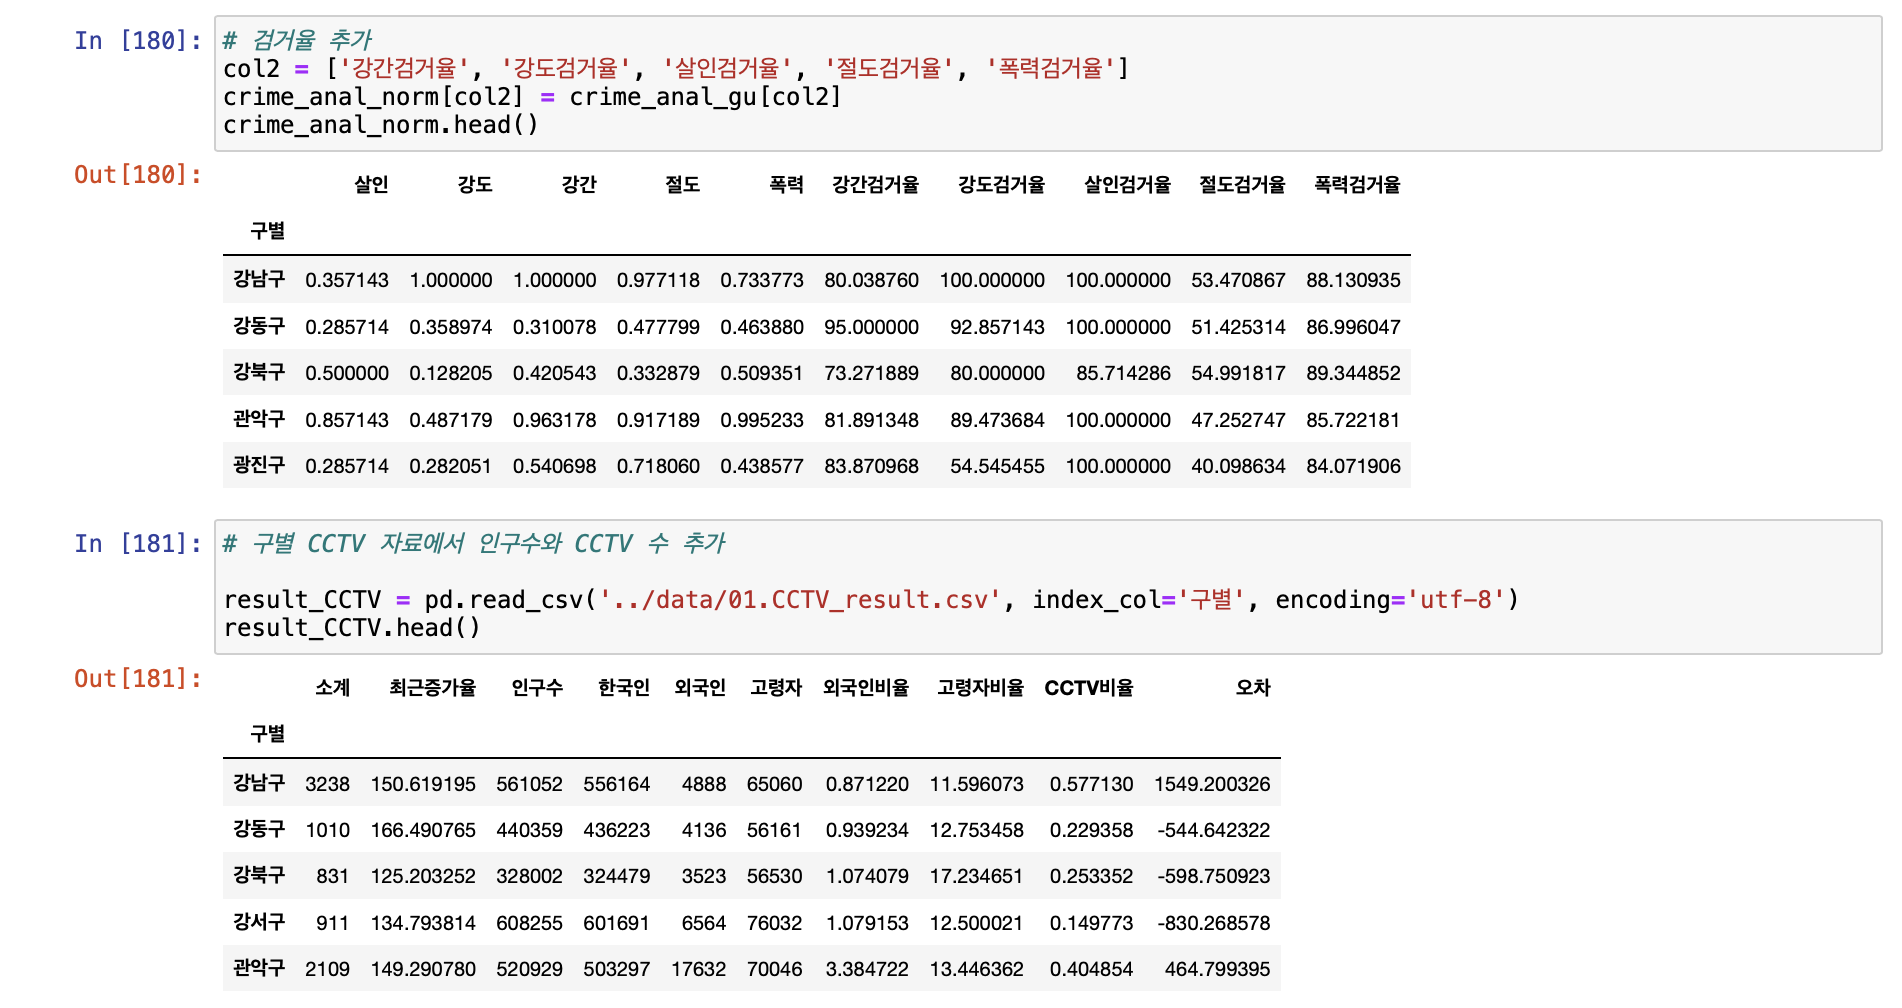
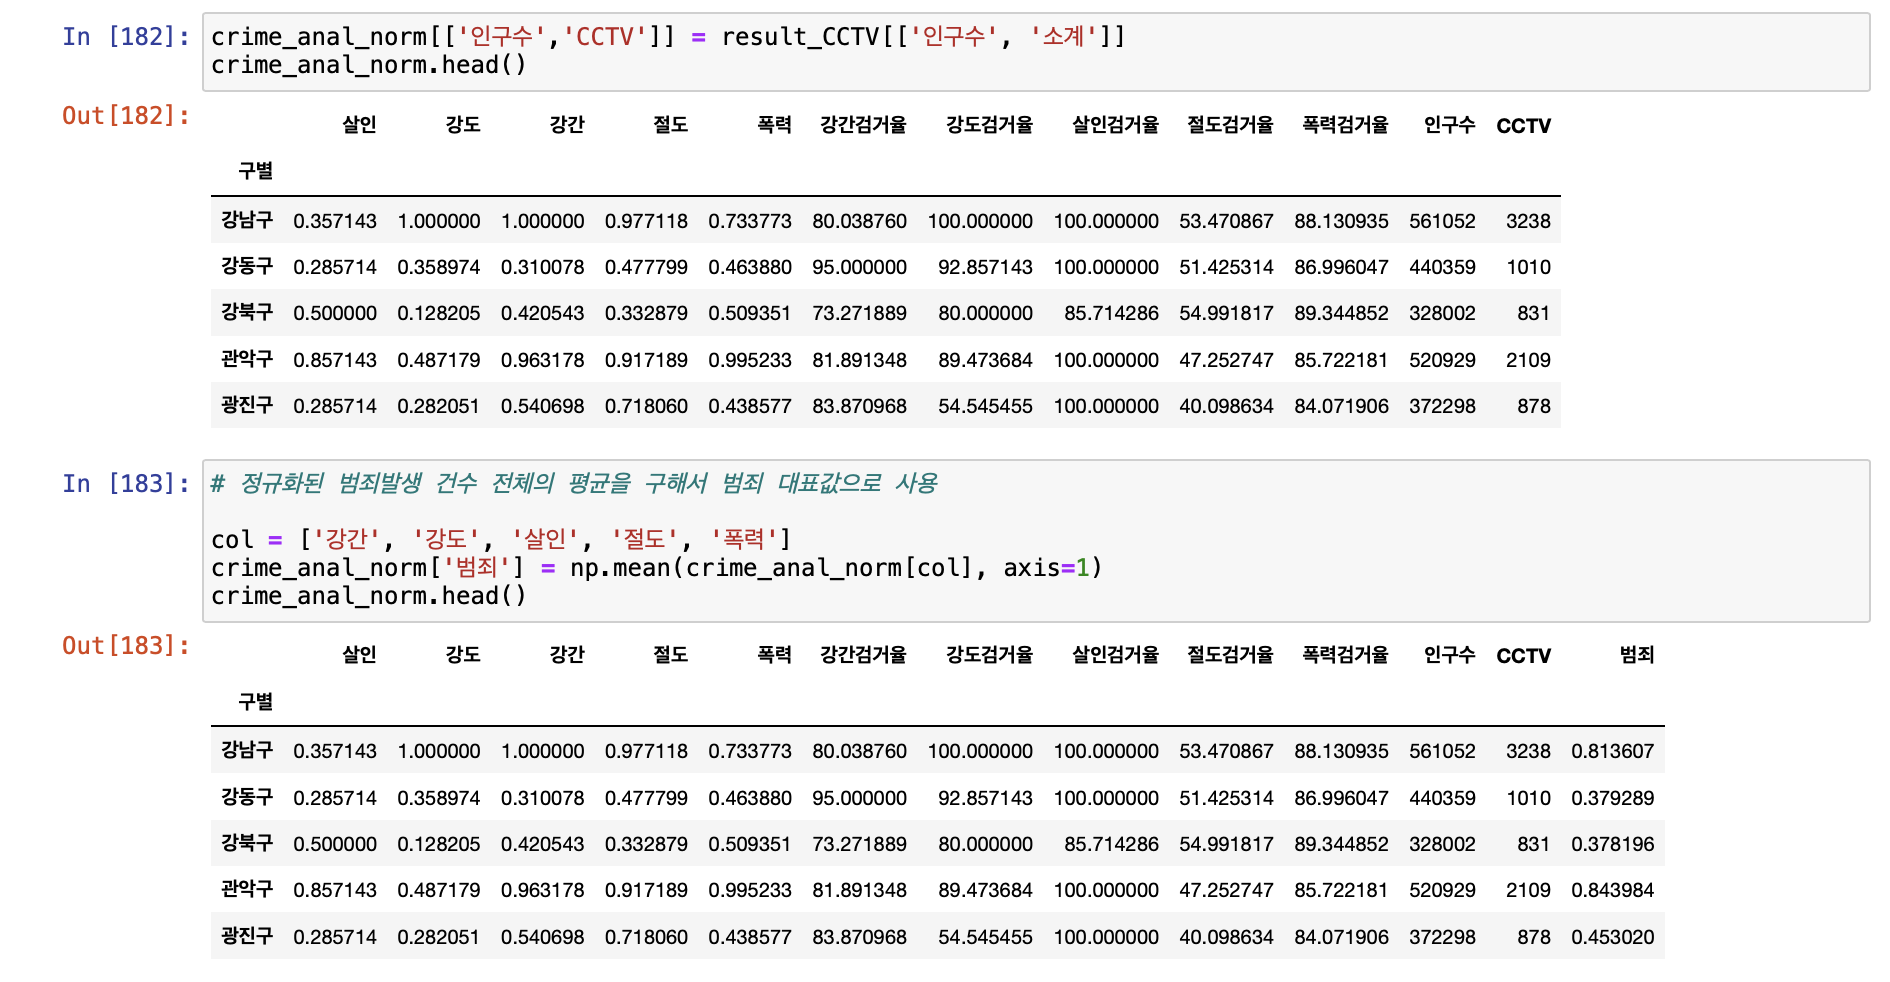
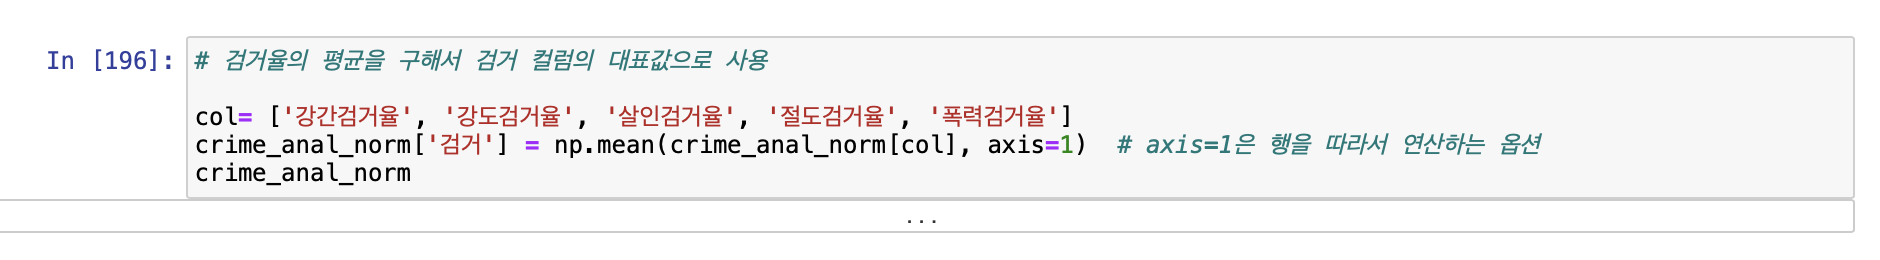
[구별 데이터 정리하기]
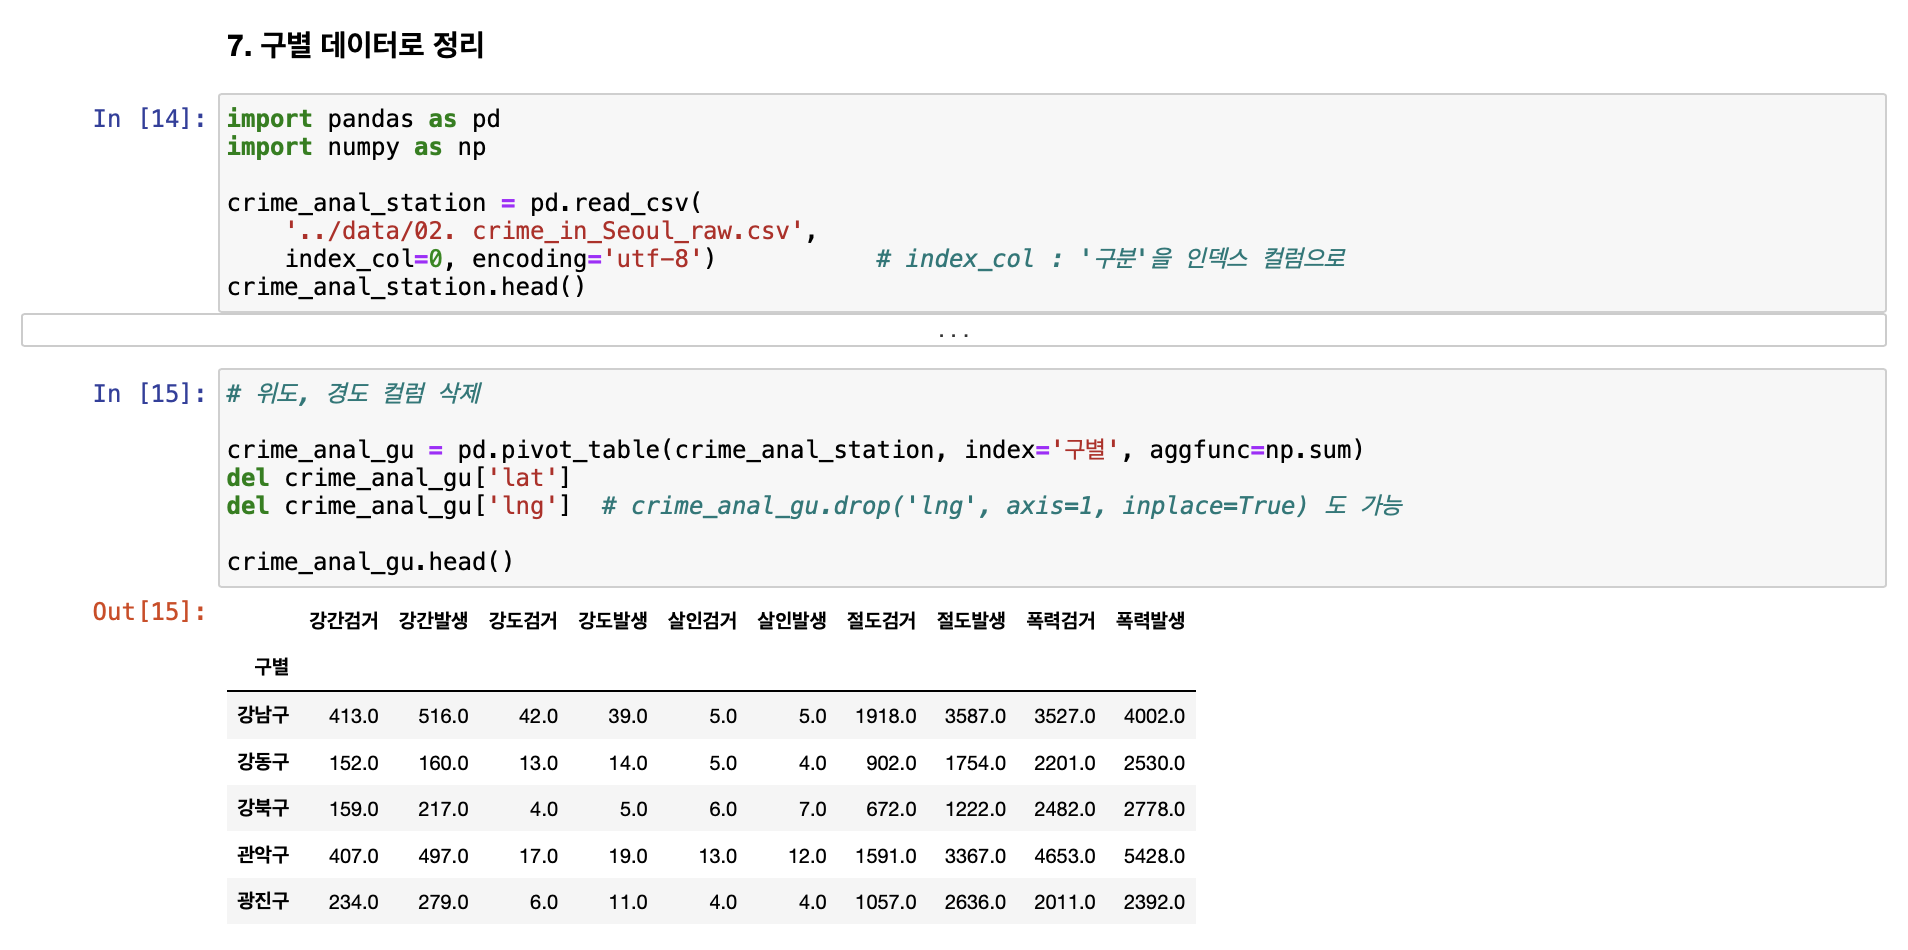
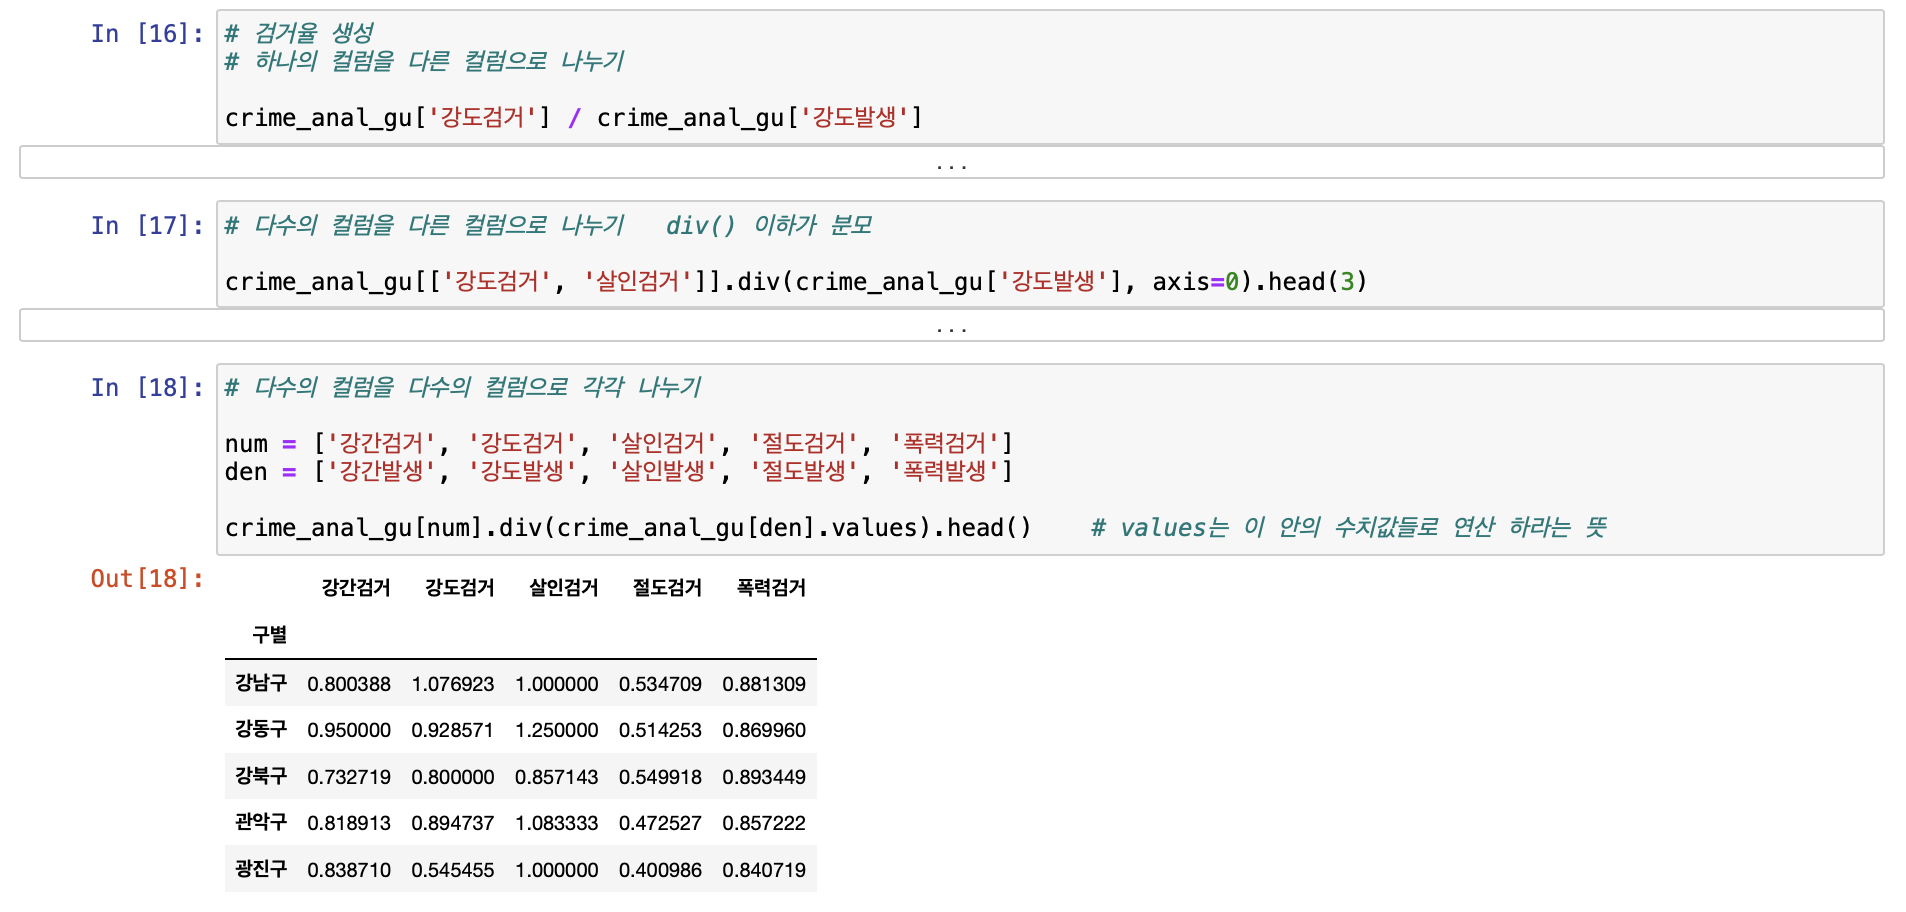
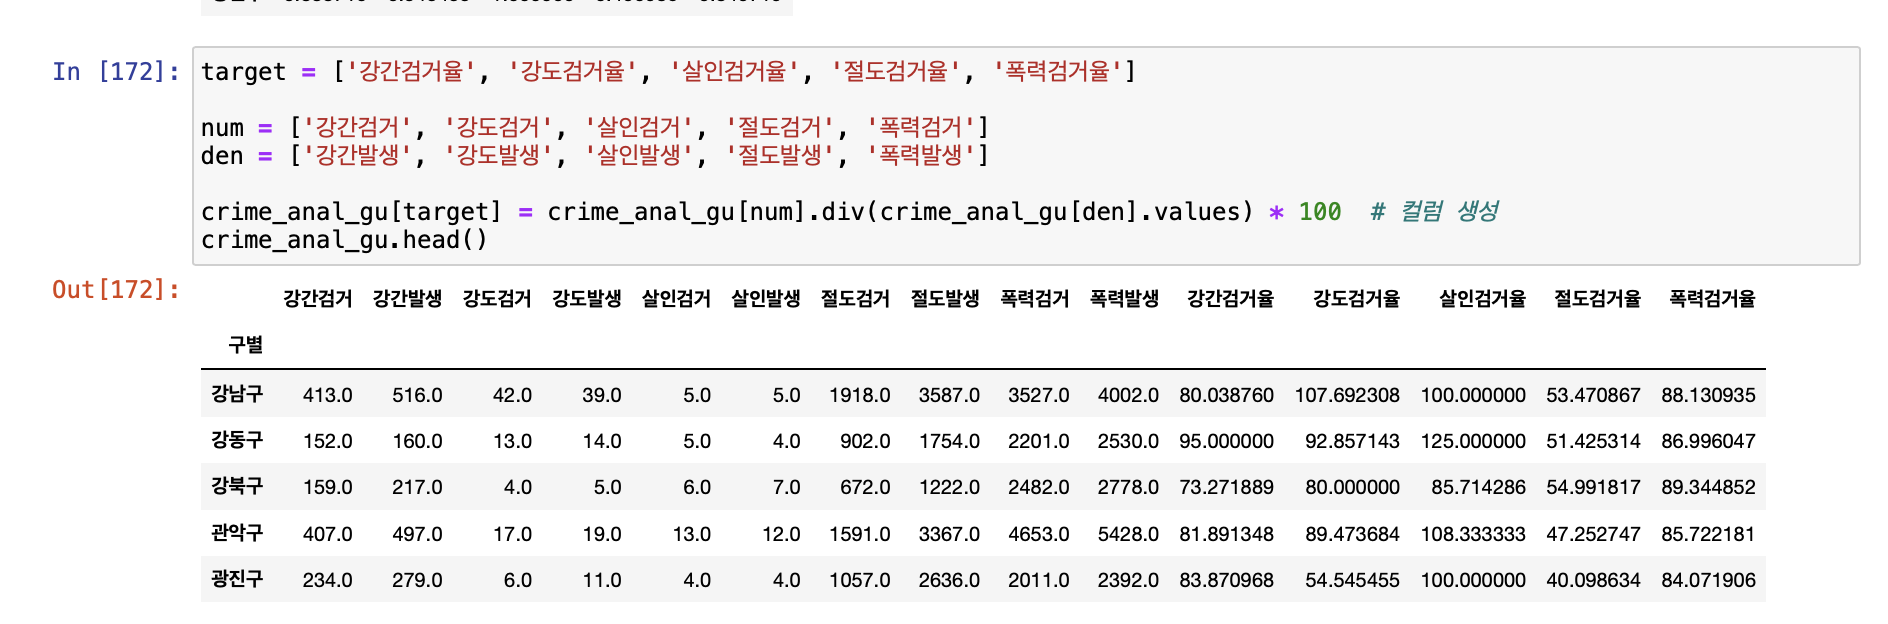
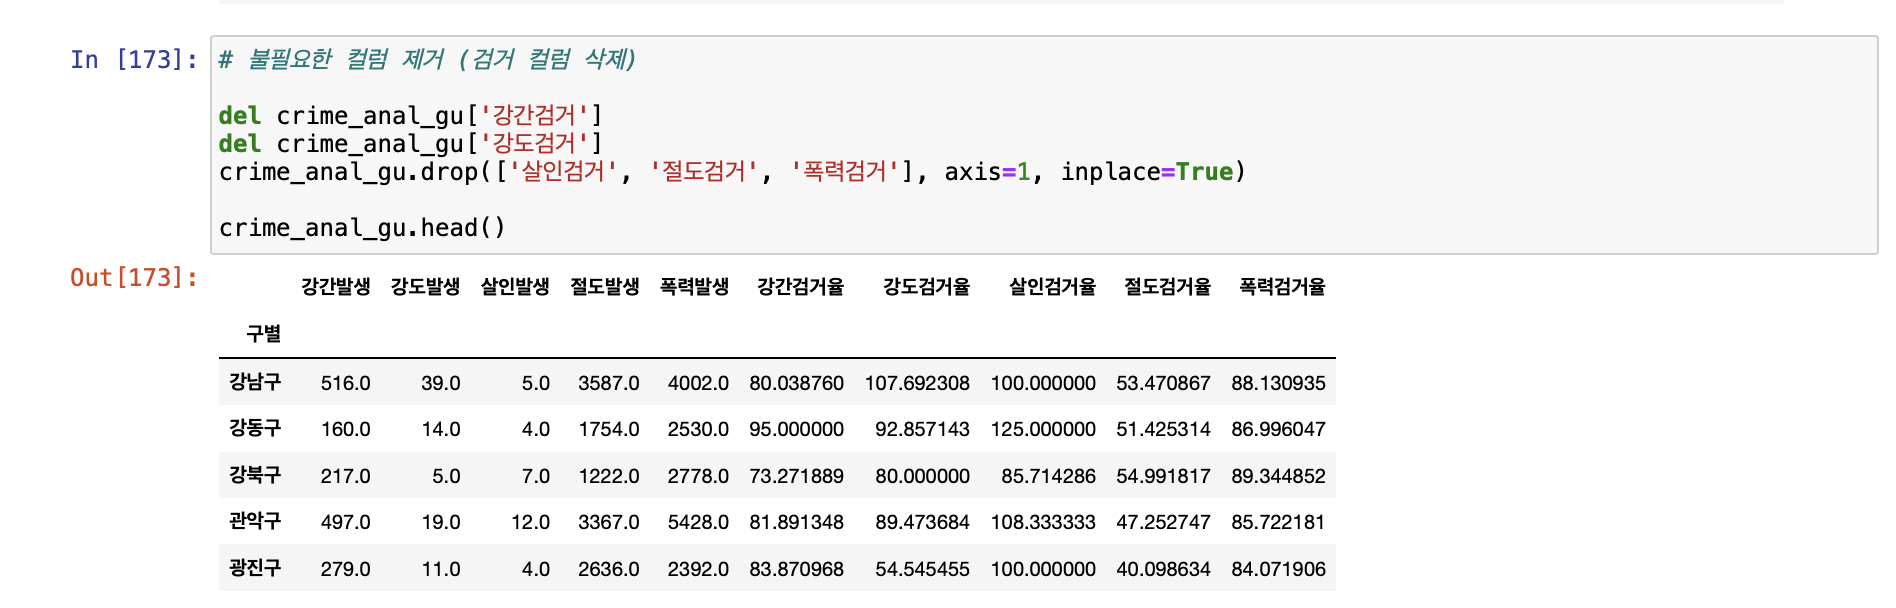
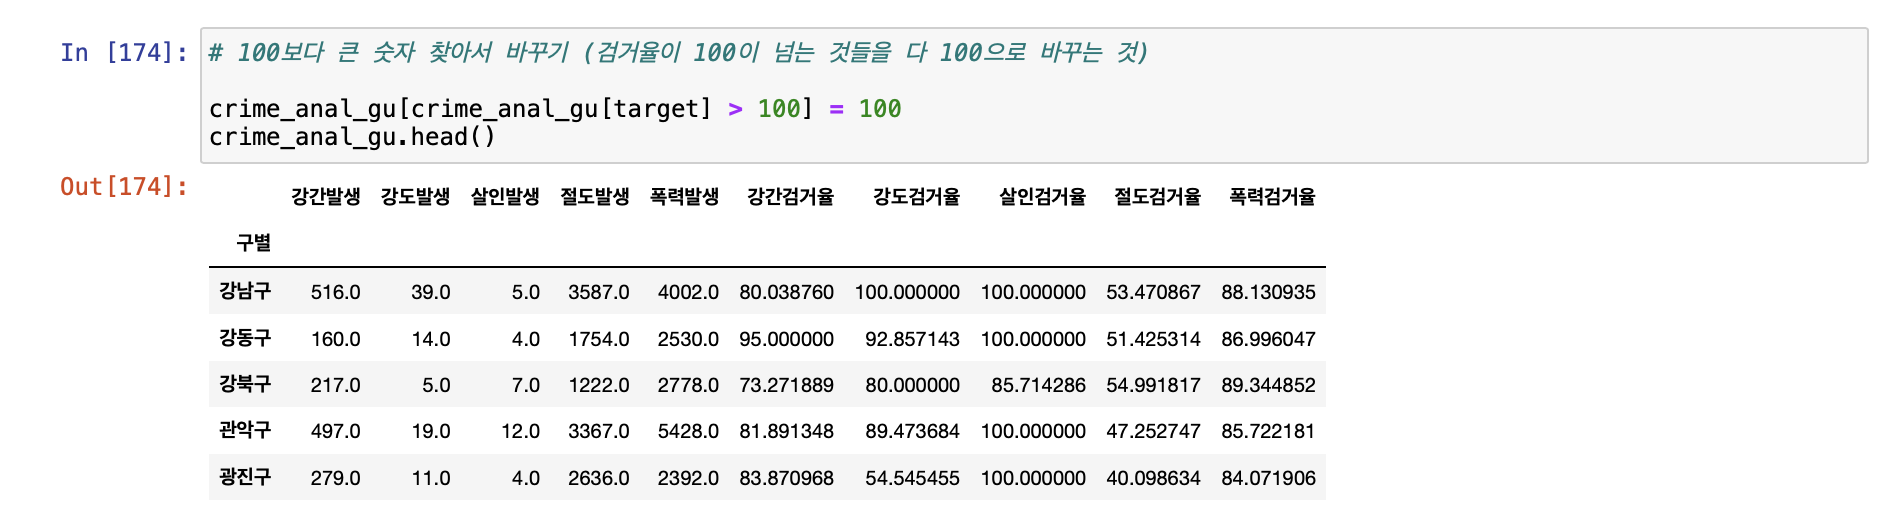
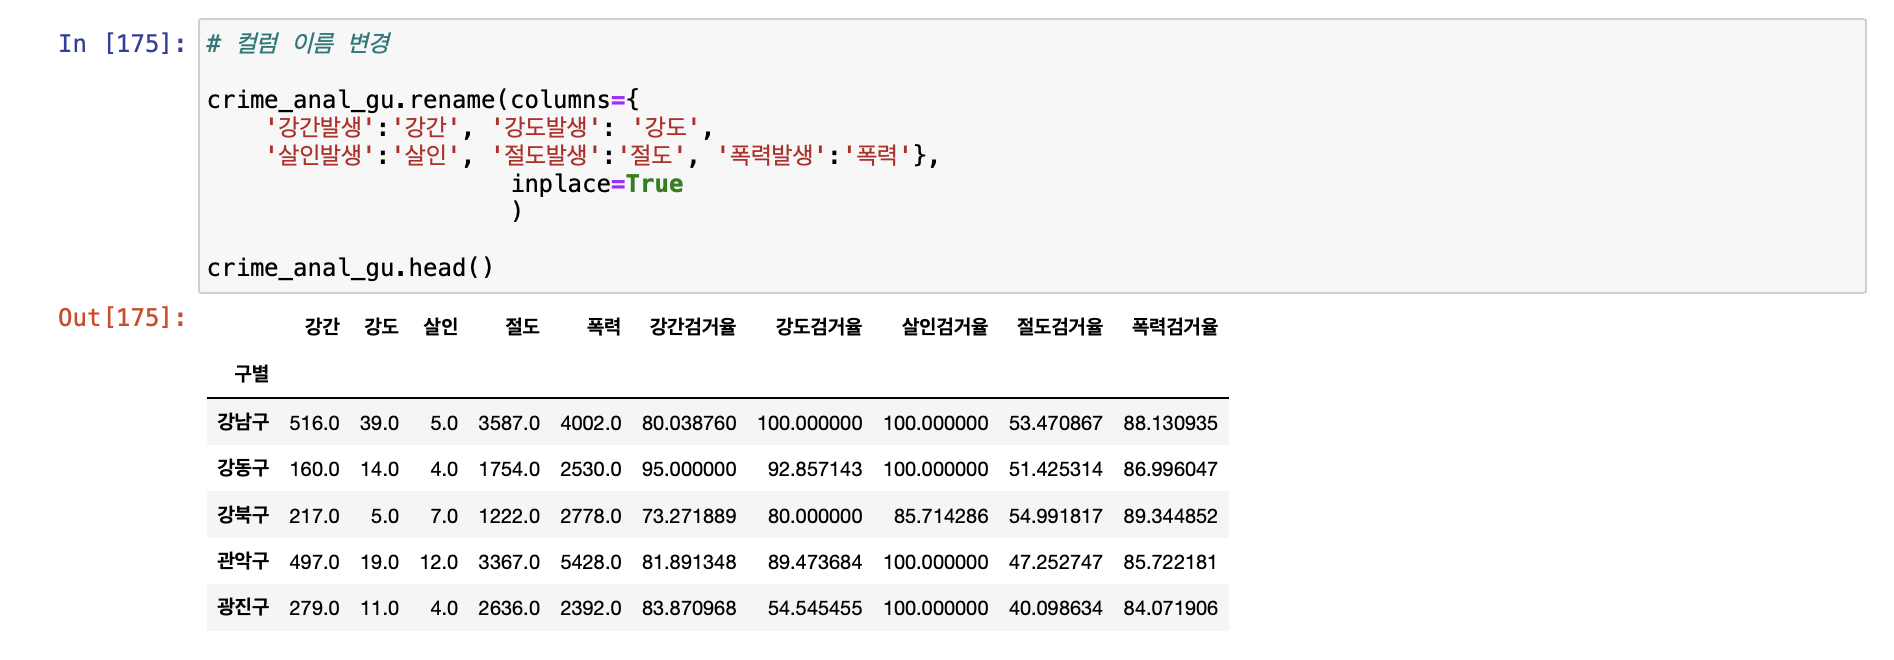
[서울시 범죄현황 데이터 최종 정리]
[seaborn]
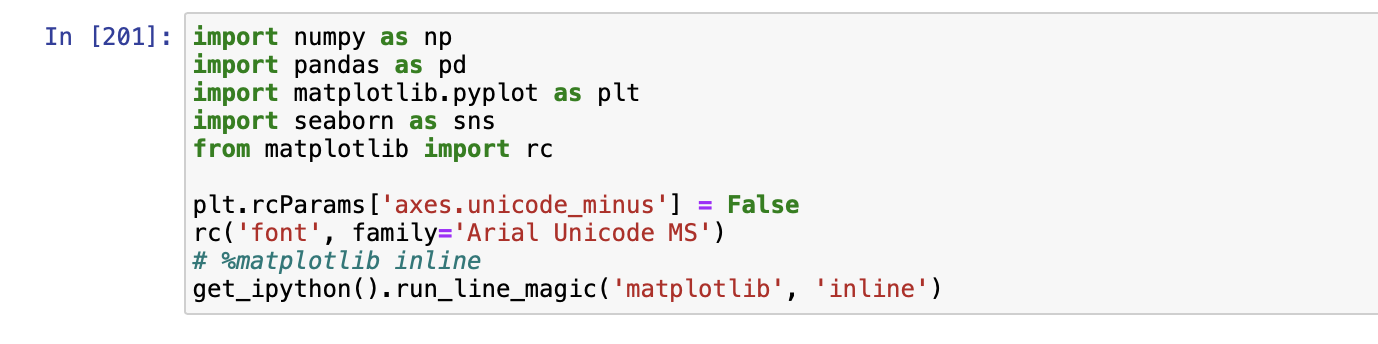
- 예제 1) seaborn 기초
x = np.linspace(0, 14, 100)
y1 = np.sin(x)
y2 = 2 * np.sin(x+0.5)
y3 = 3 * np.sin(x+1.0)
y4 = 4 * np.sin(x+1.5)
# sns.set_style()
# 'white', 'grid', 'dark', 'darkgrid'
sns.set_style('darkgrid')
plt.figure(figsize=(10,6))
plt.plot(x, y1, x, y2, x, y3, x, y4)
plt.show()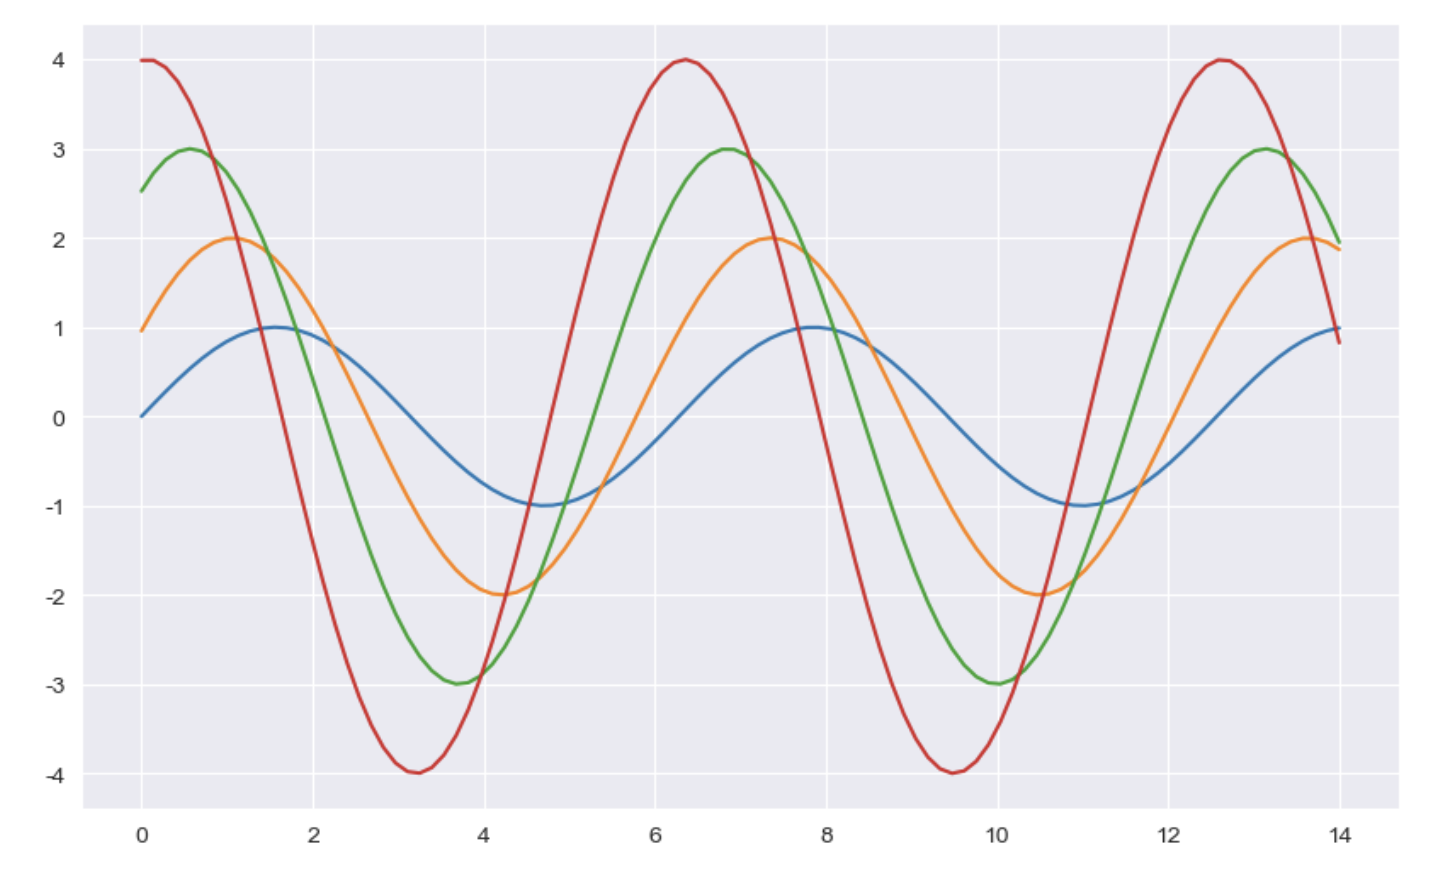
- 예제2) seaborn tips data
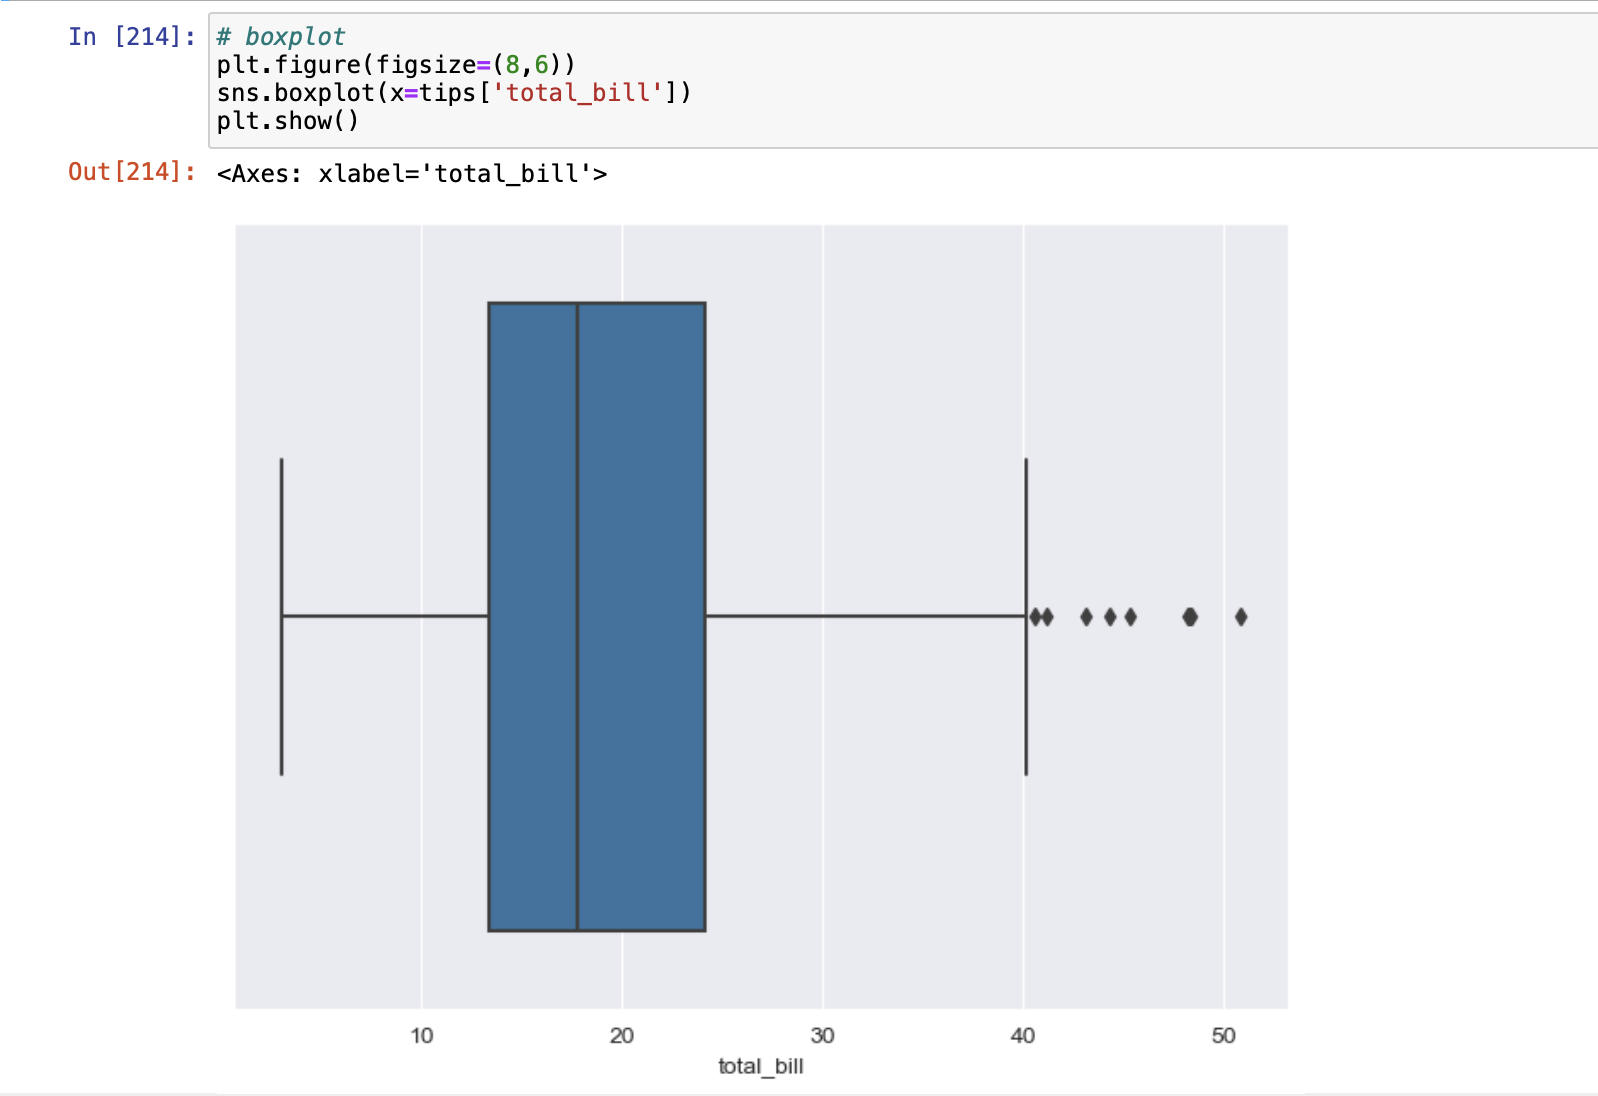
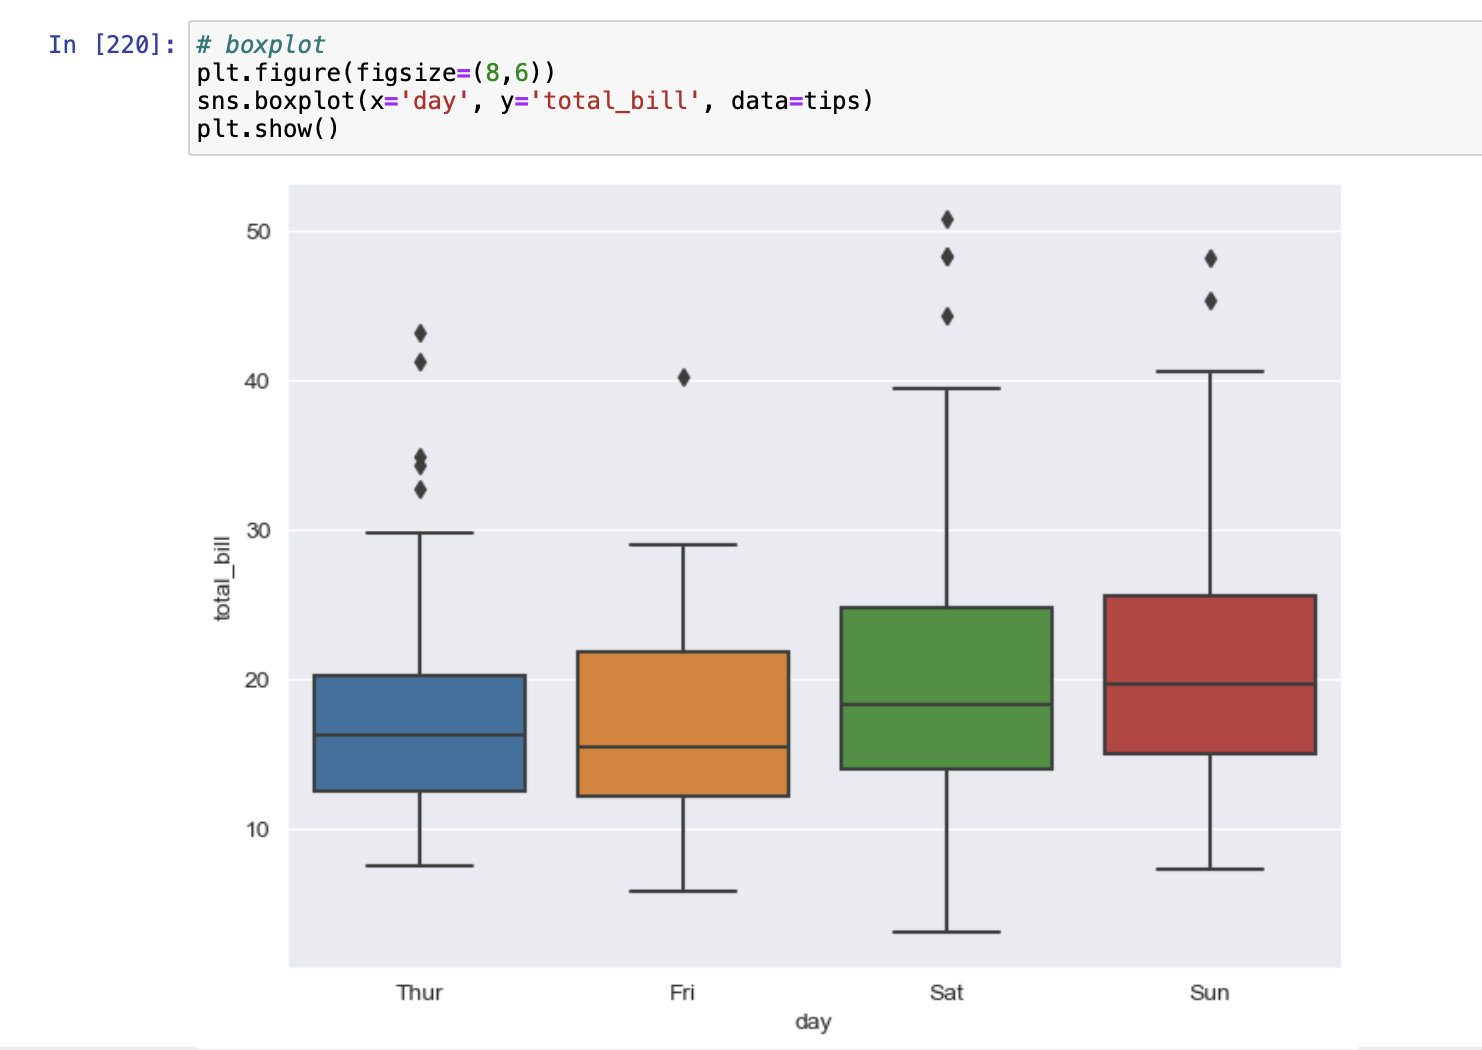
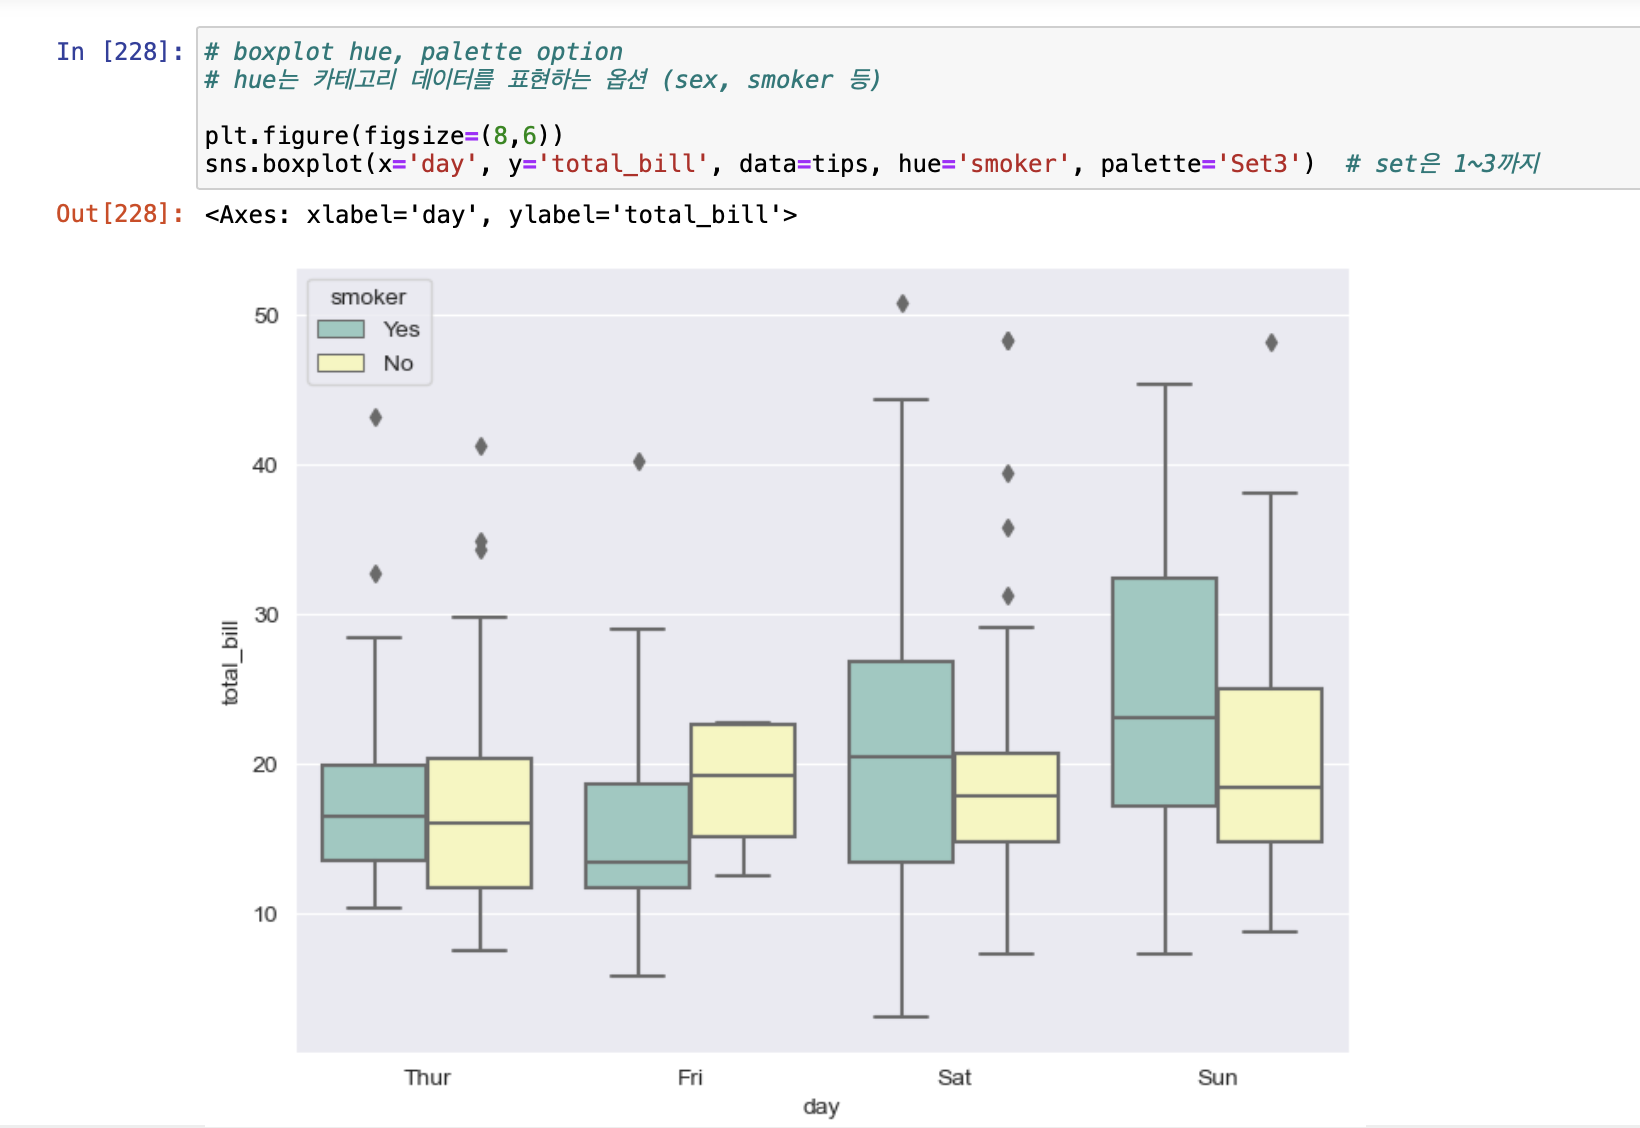
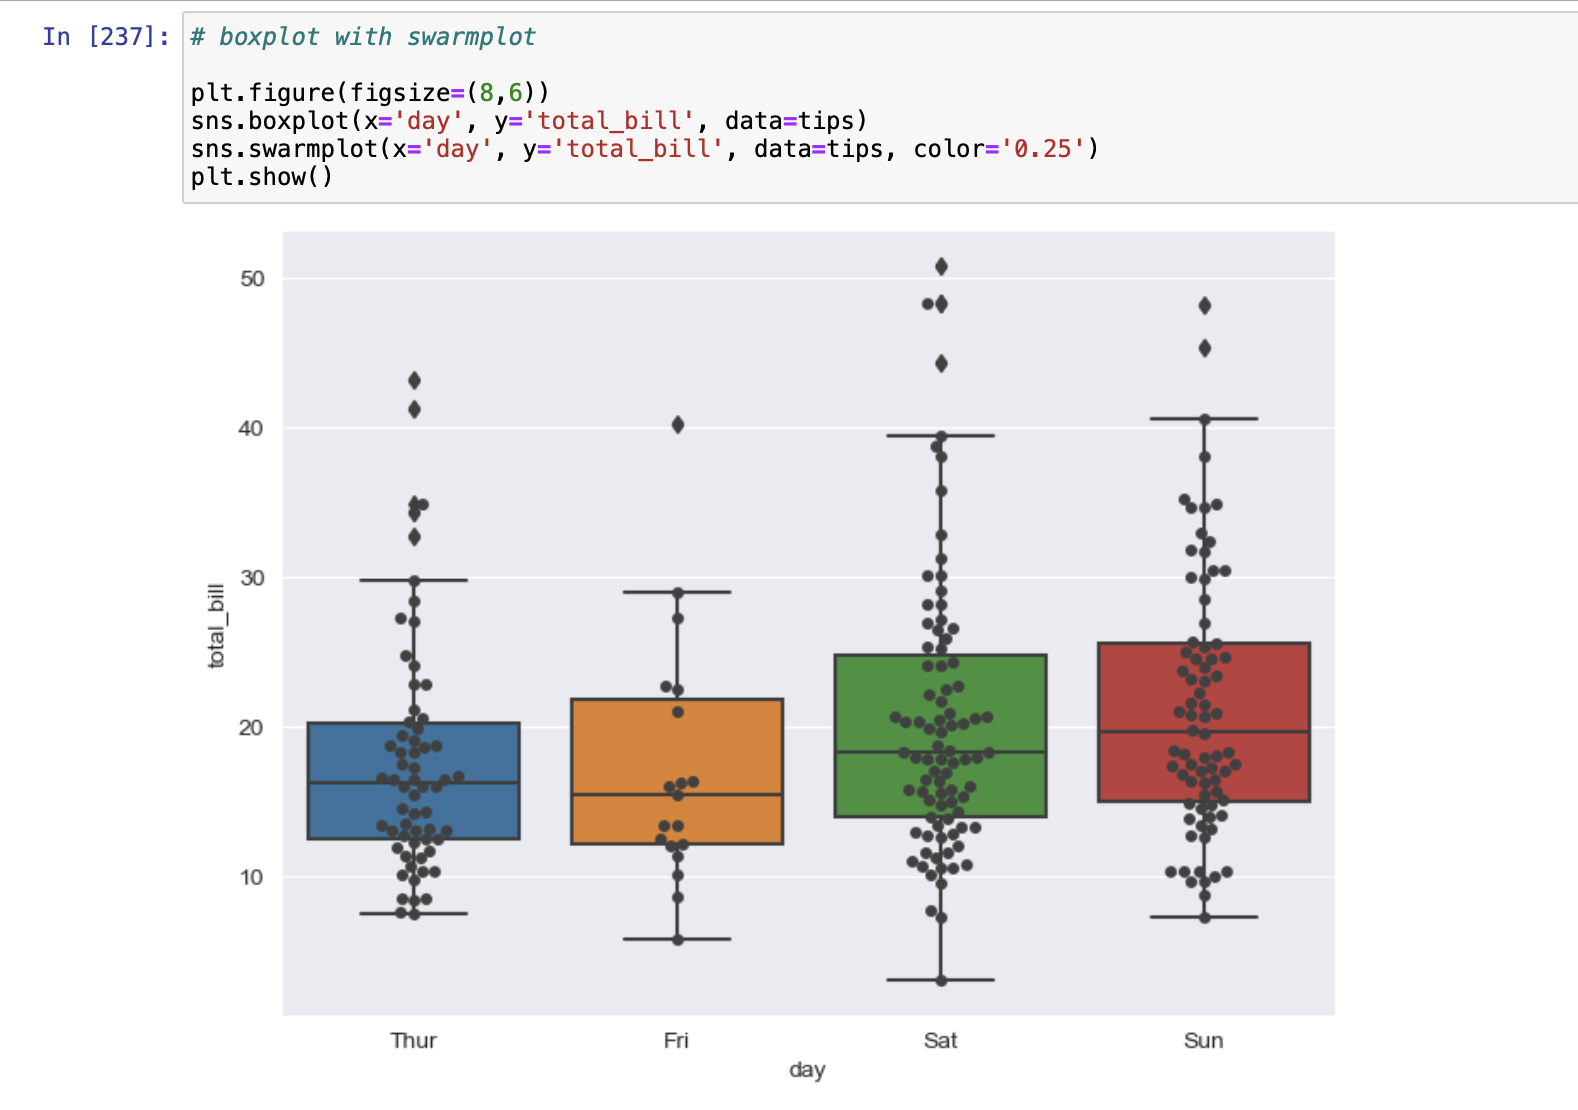
- boxplot
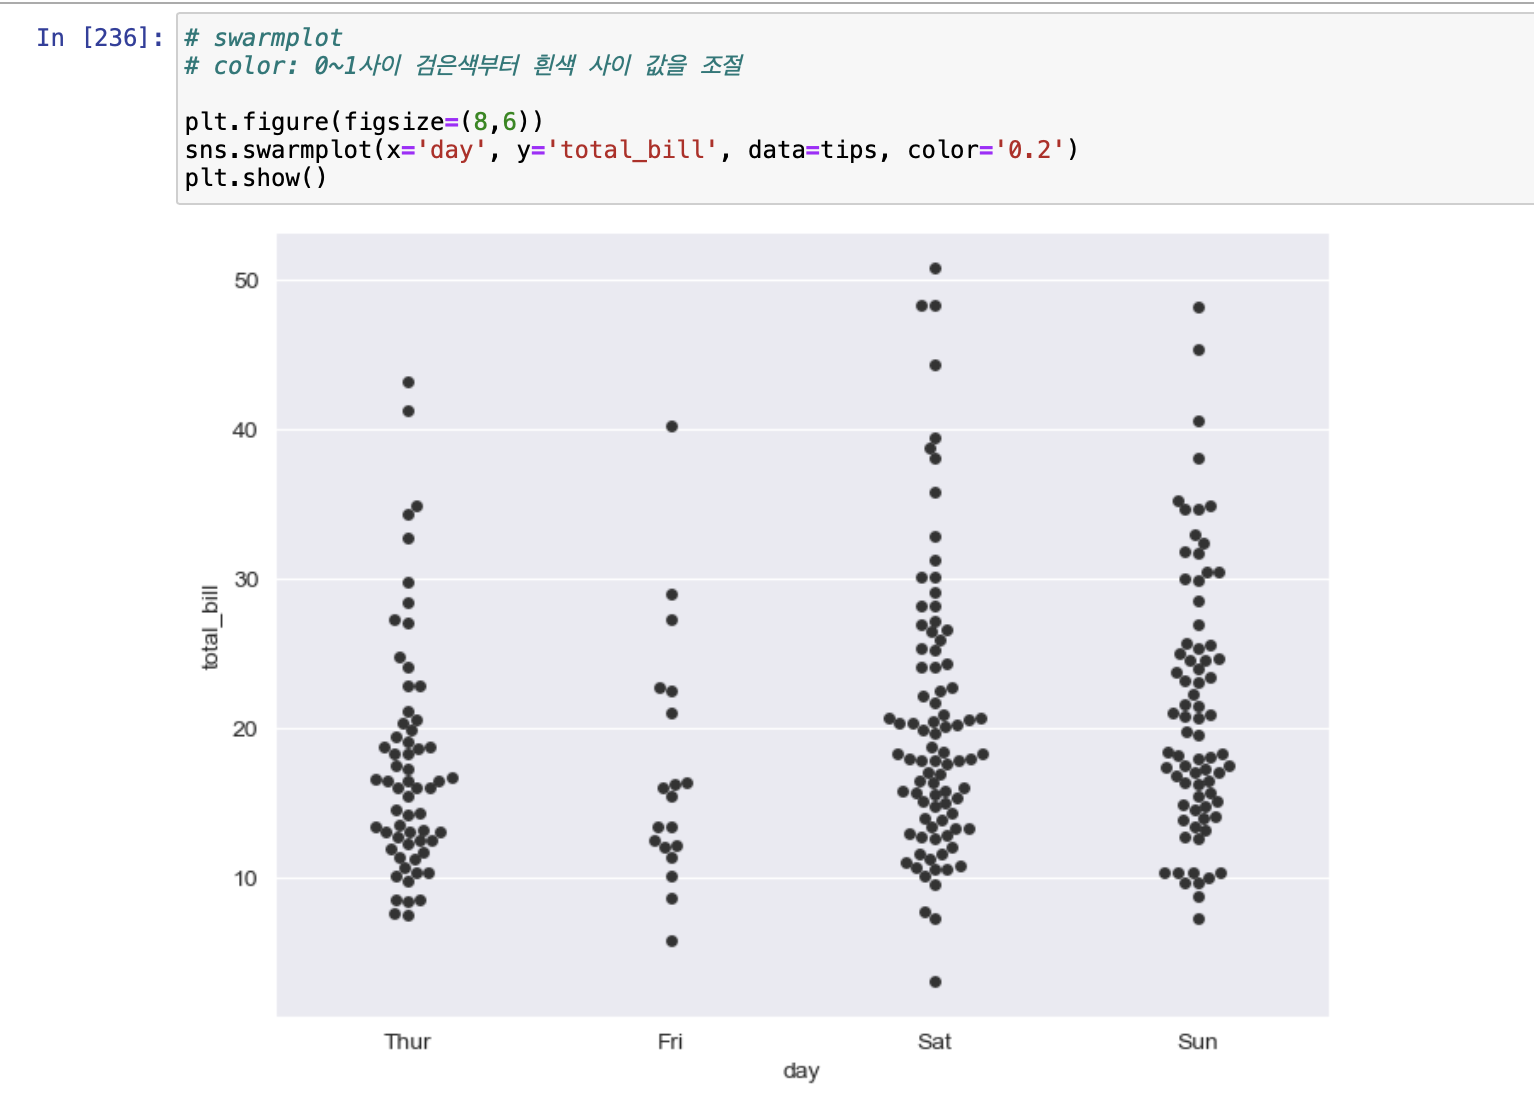
- swarmplot
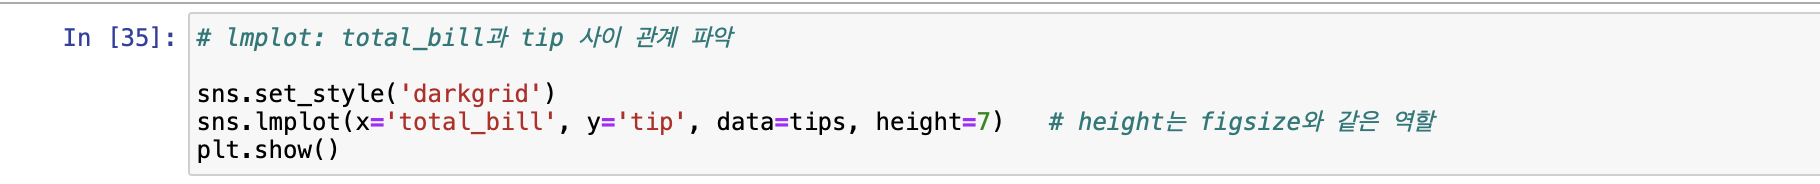
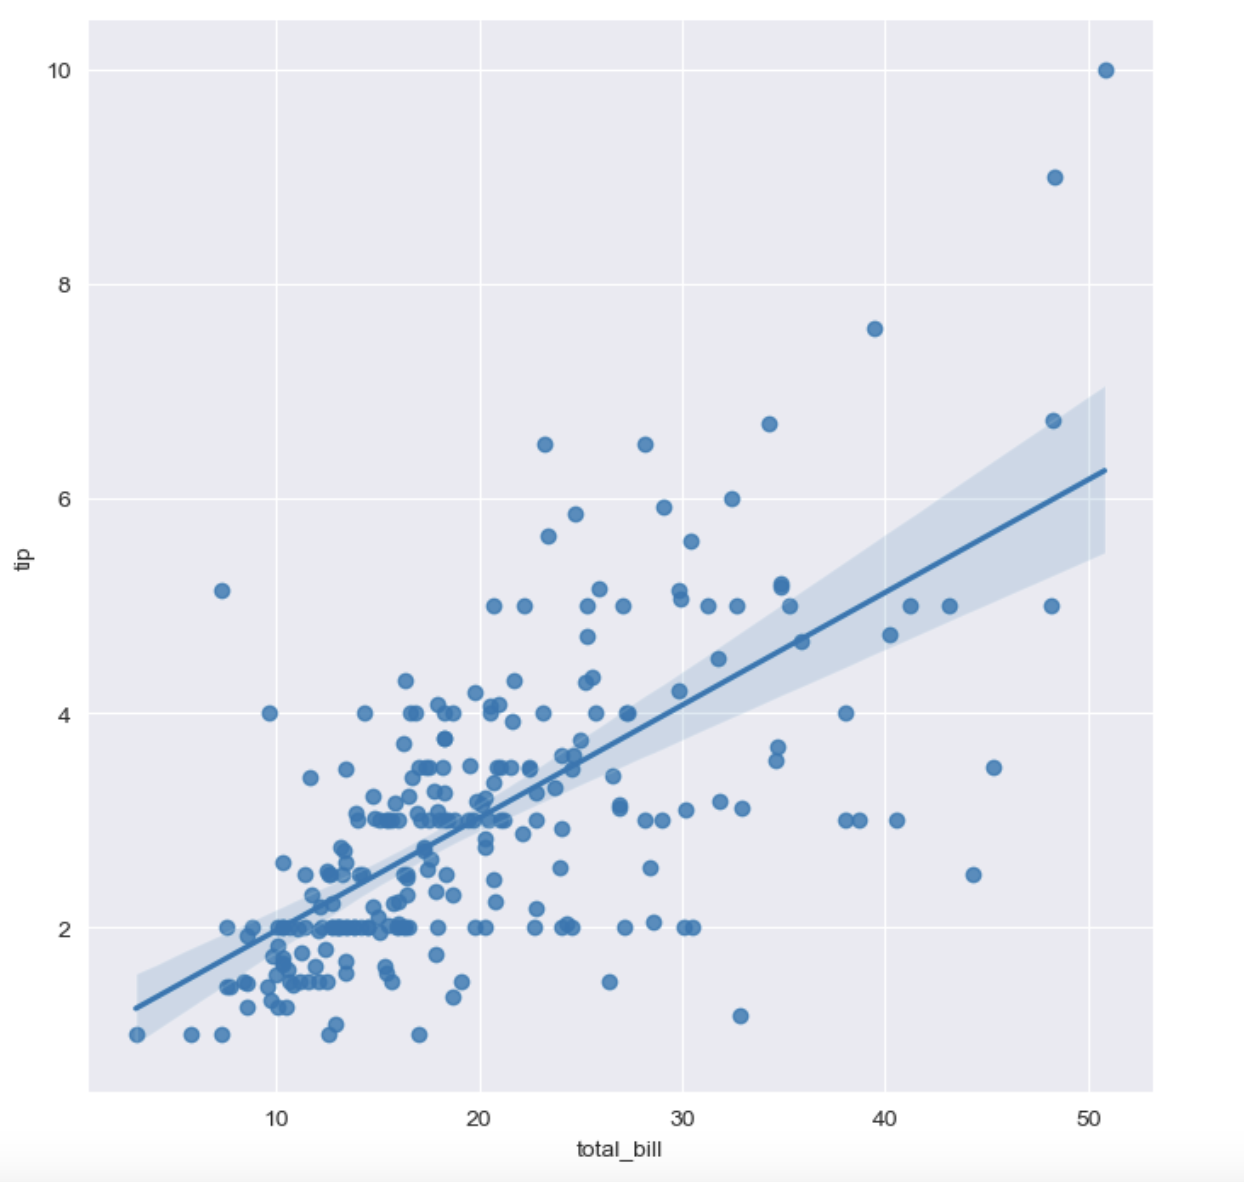
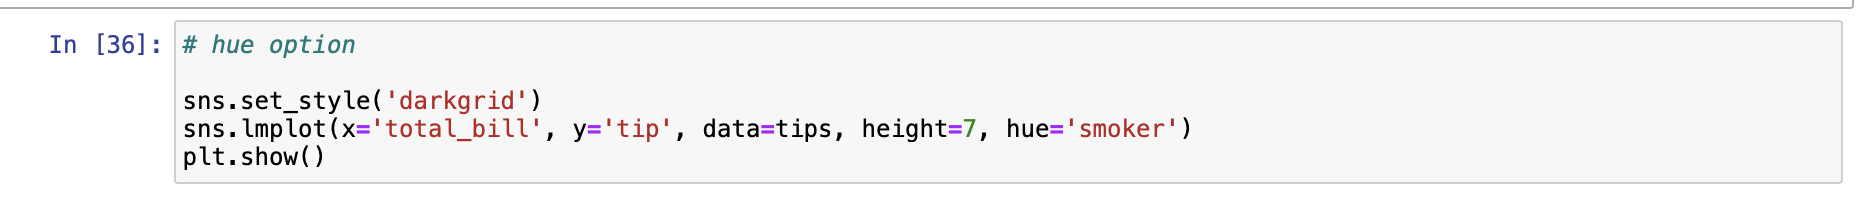
- lmplot
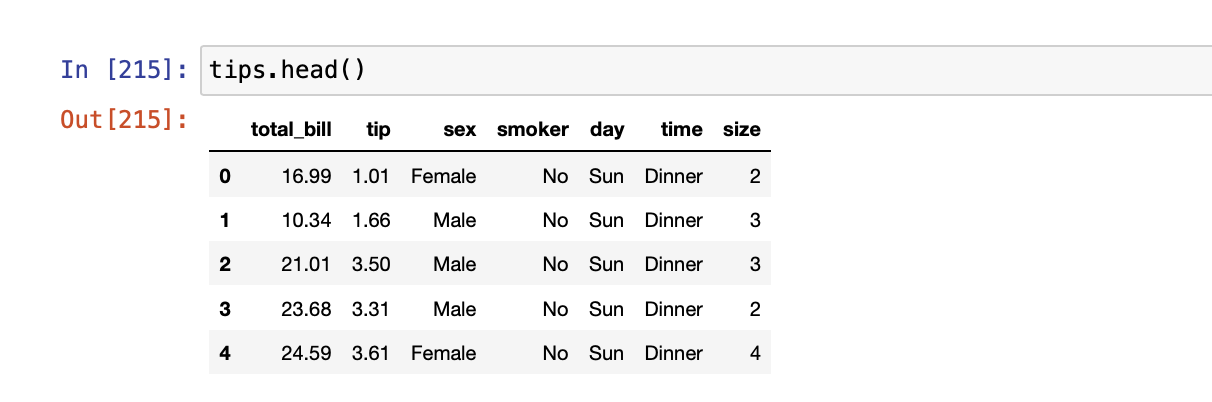
- tips = sns.load_dataset('tips')
- boxplot
- swarmplot
- lmplot
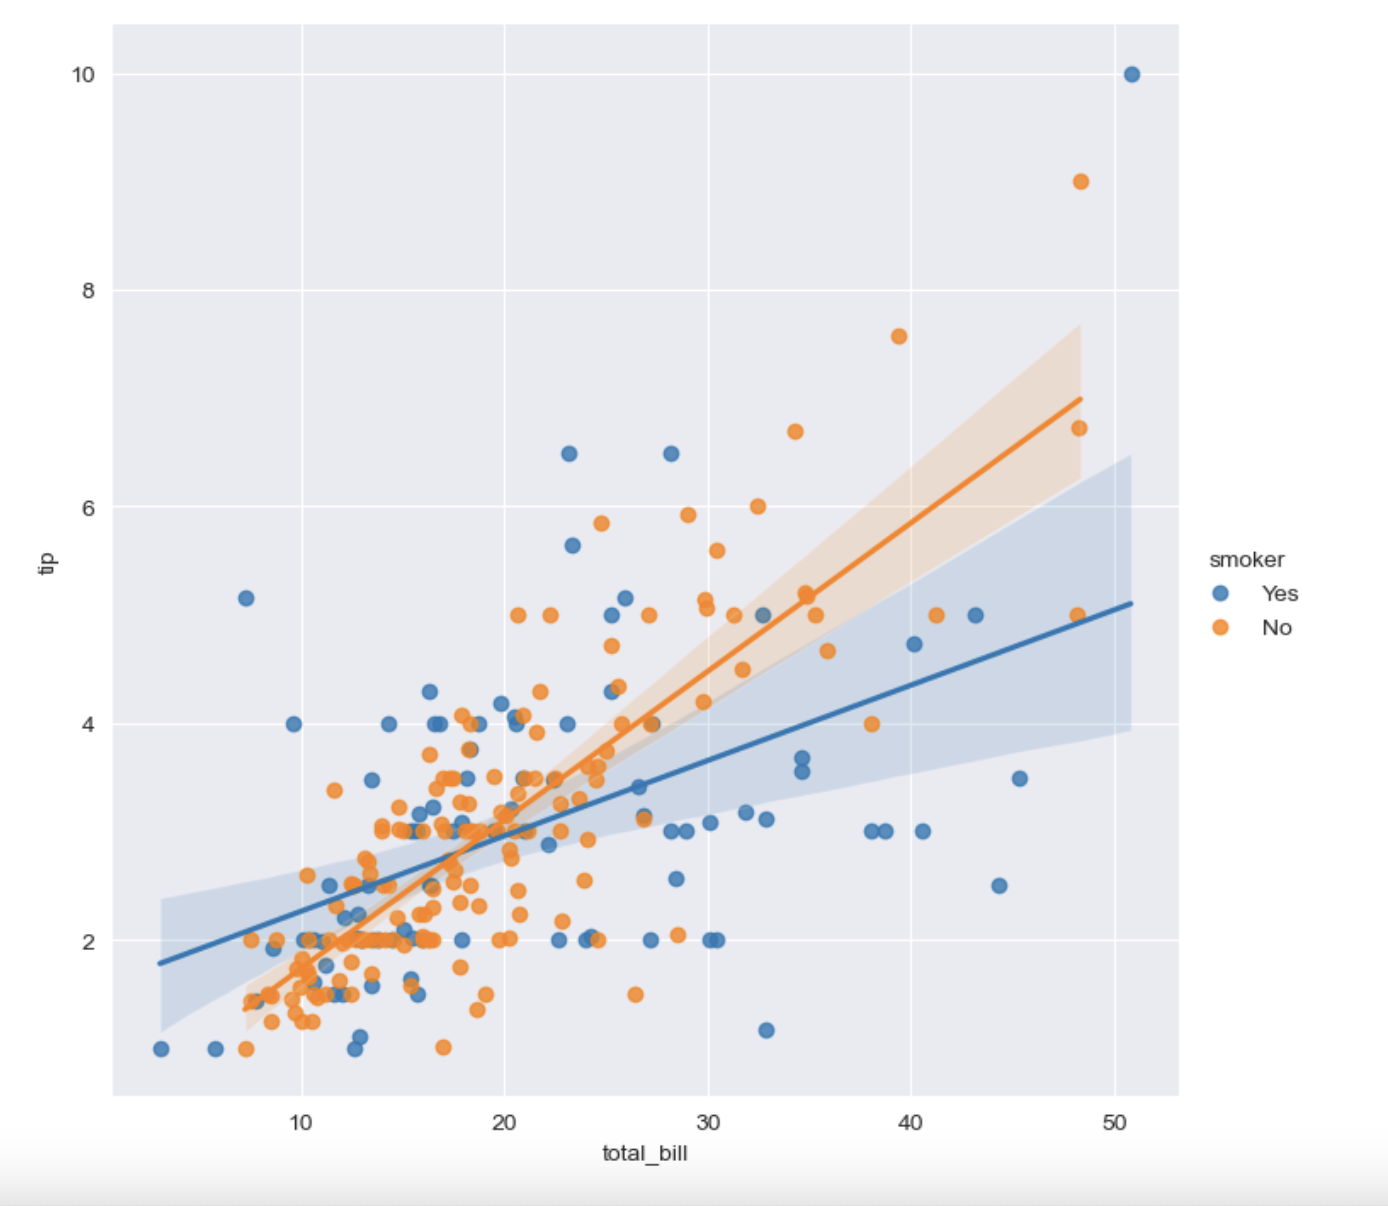
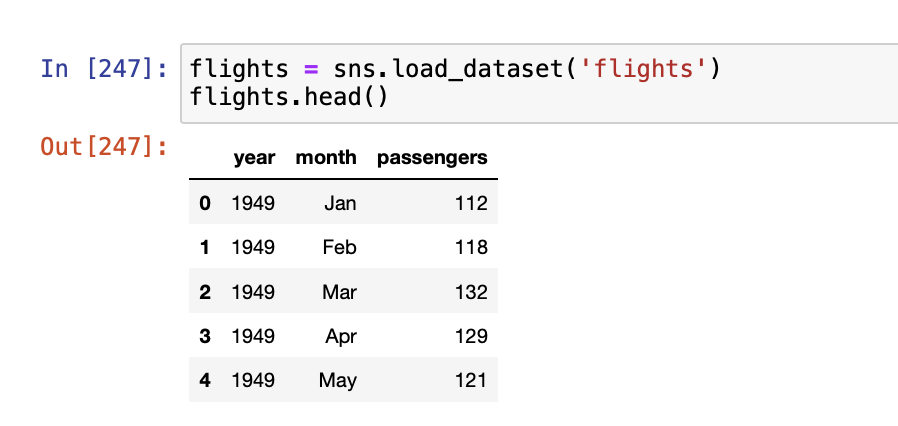
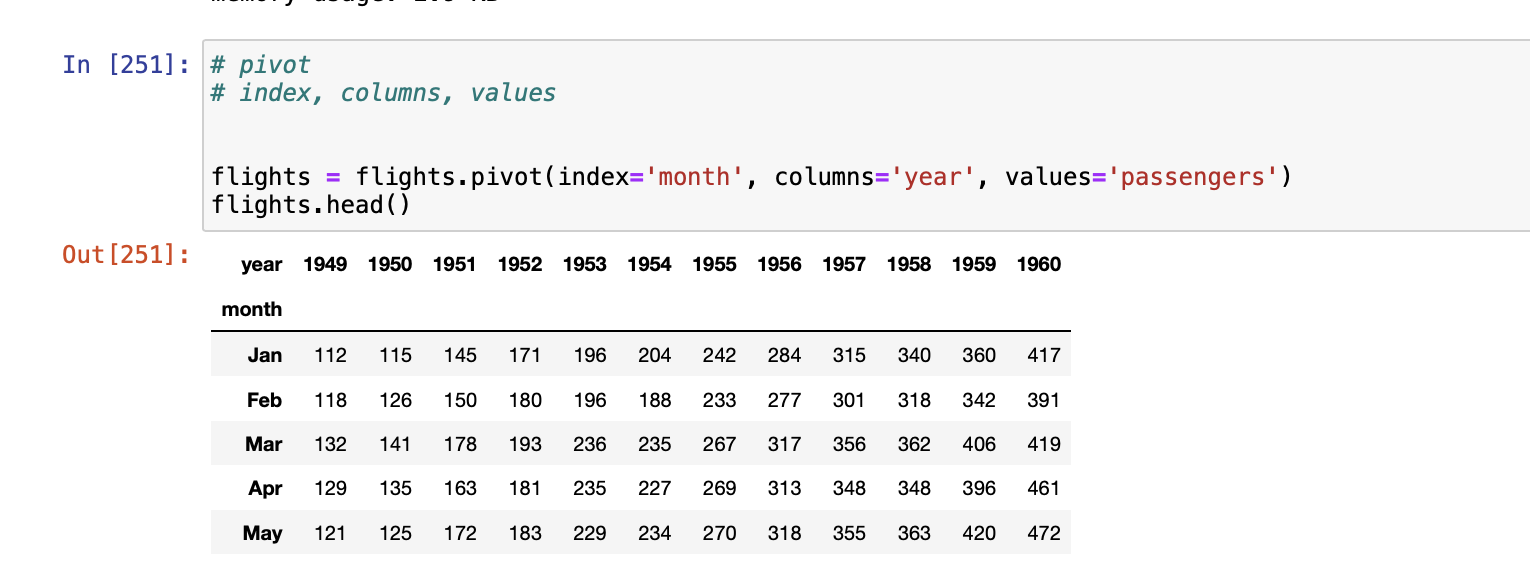
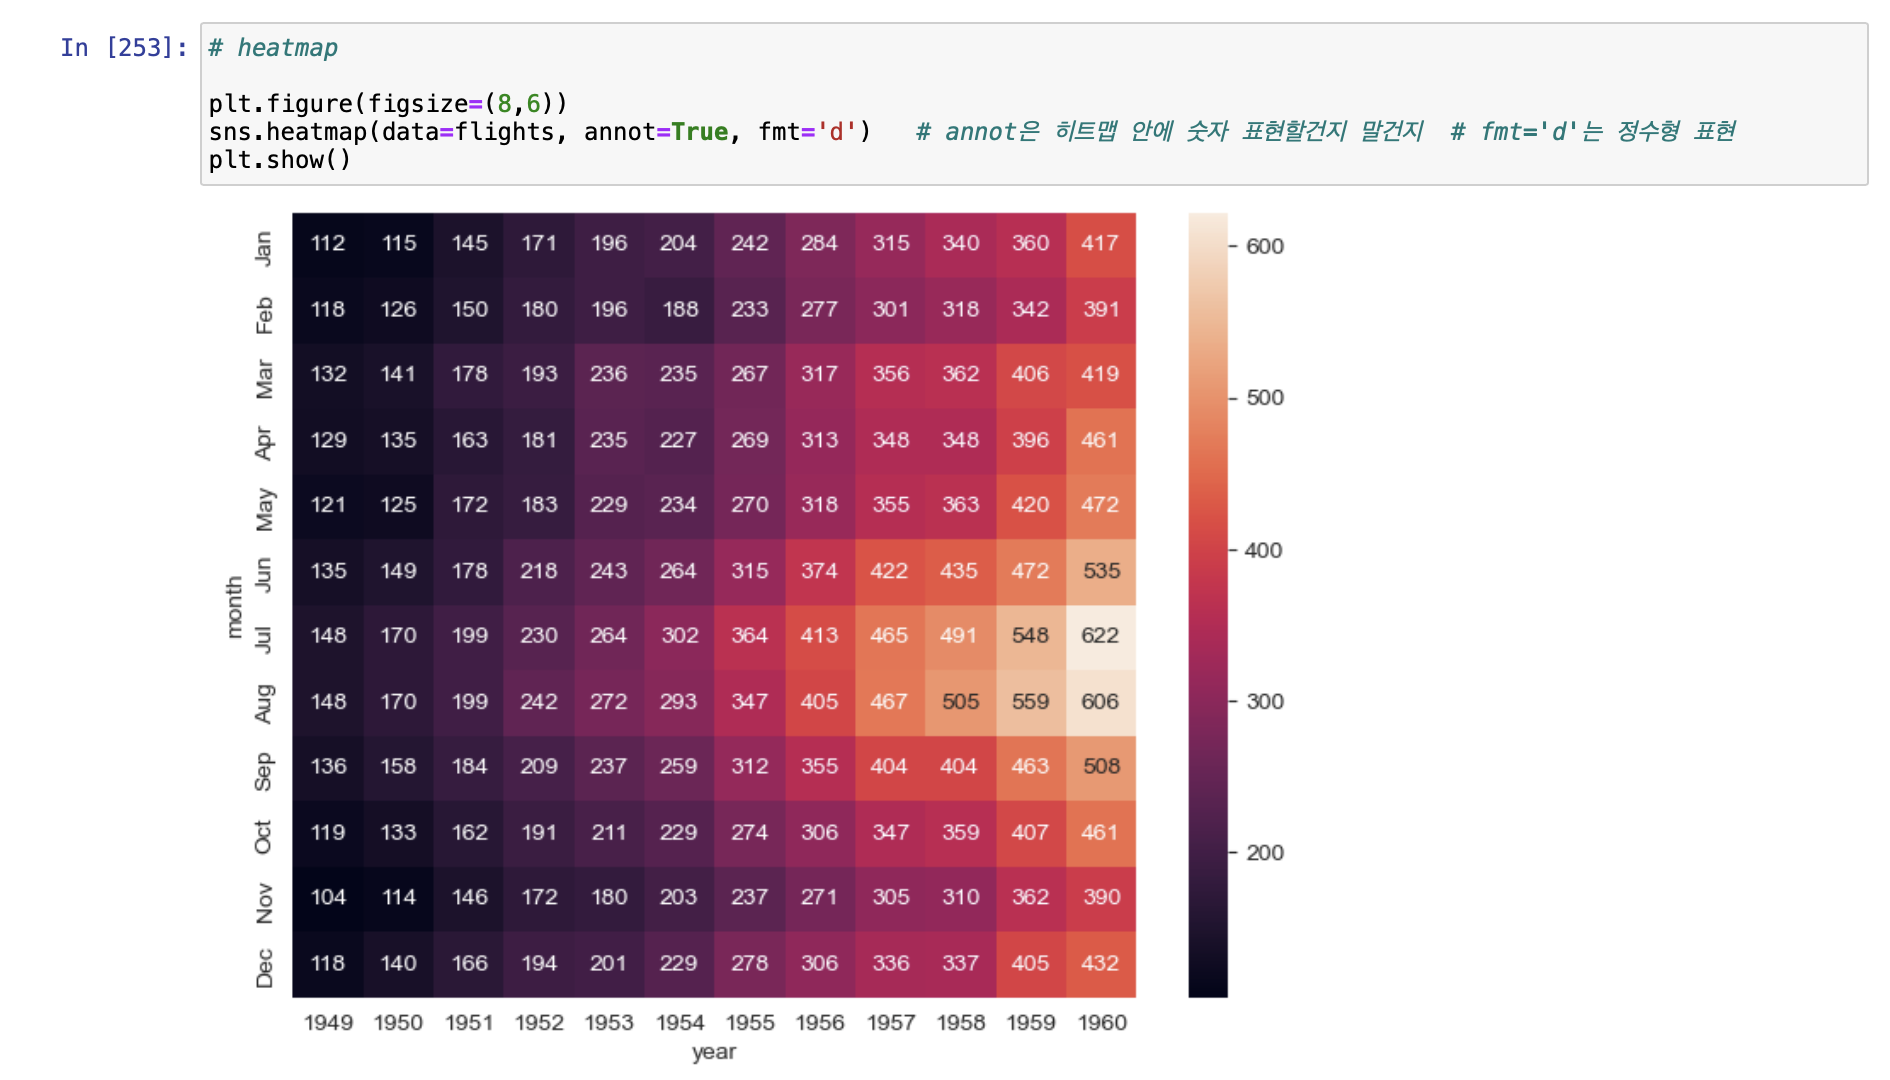
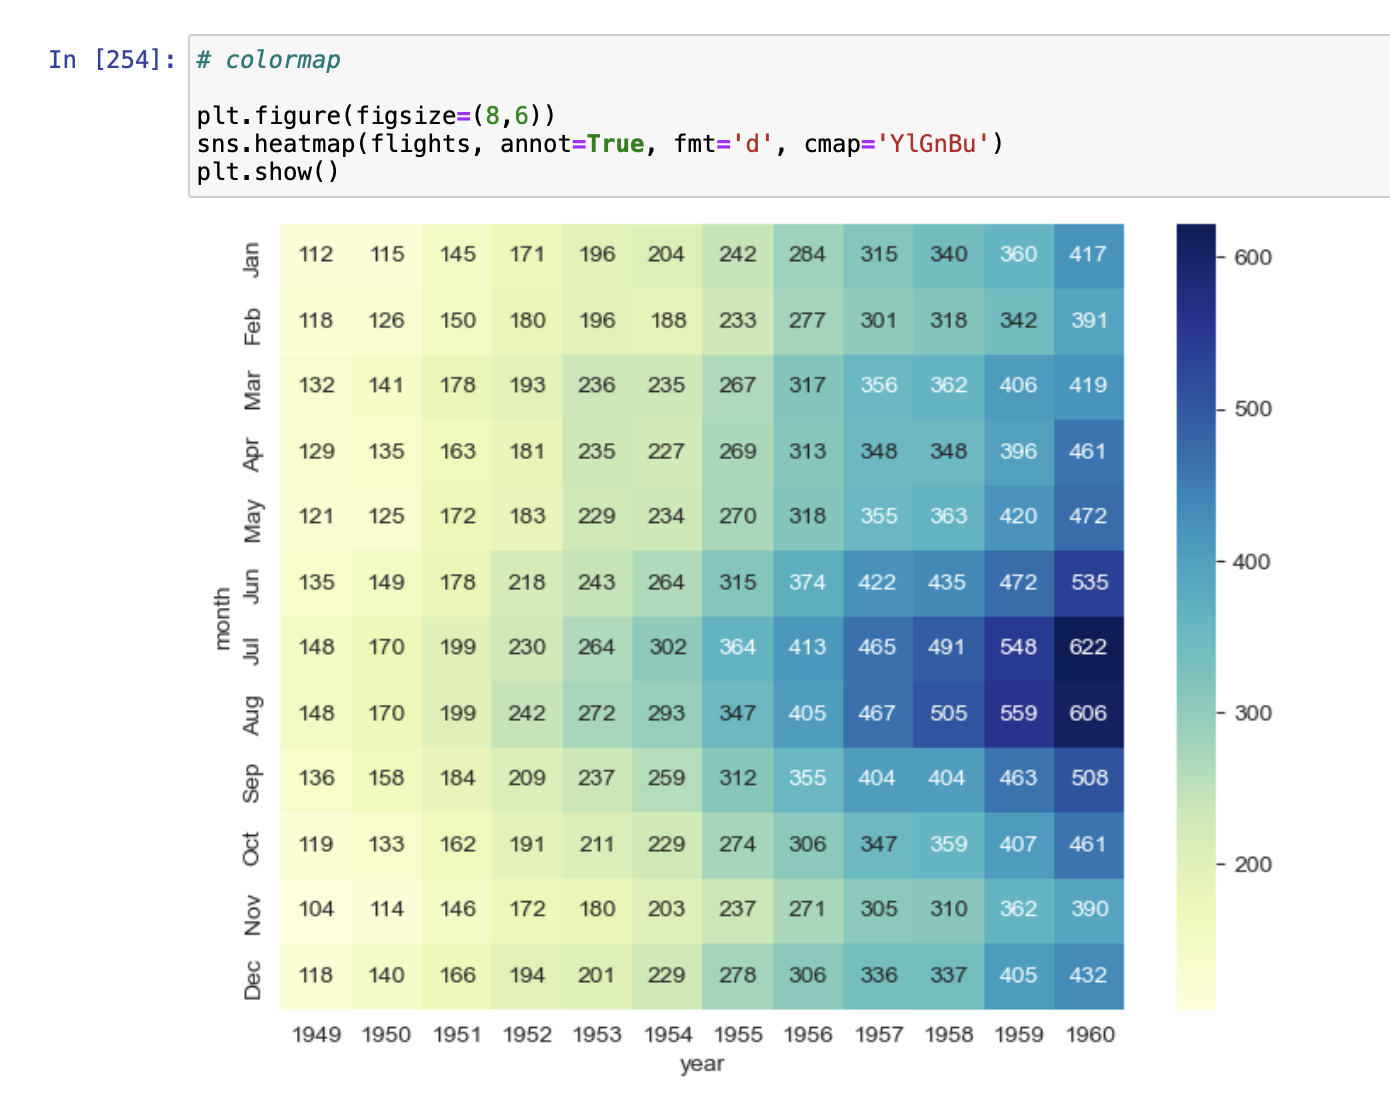
- 예제3) flights data
- heatmap
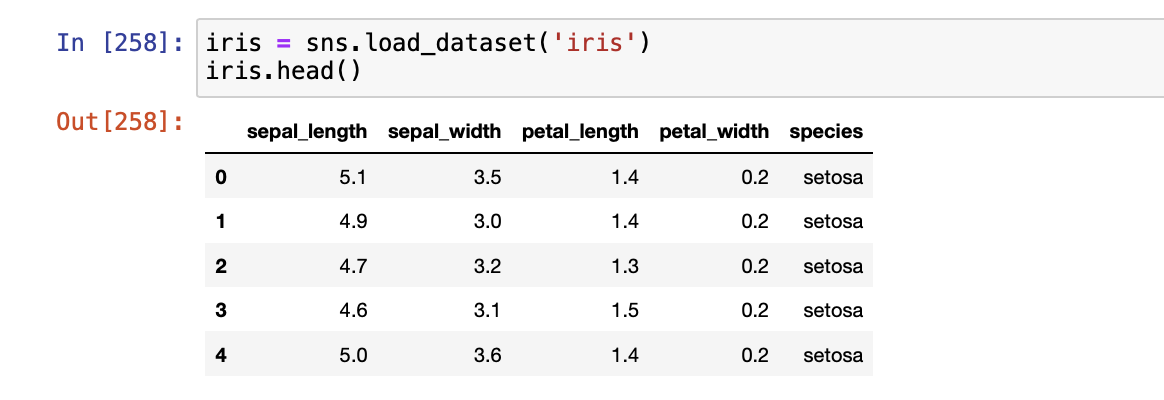
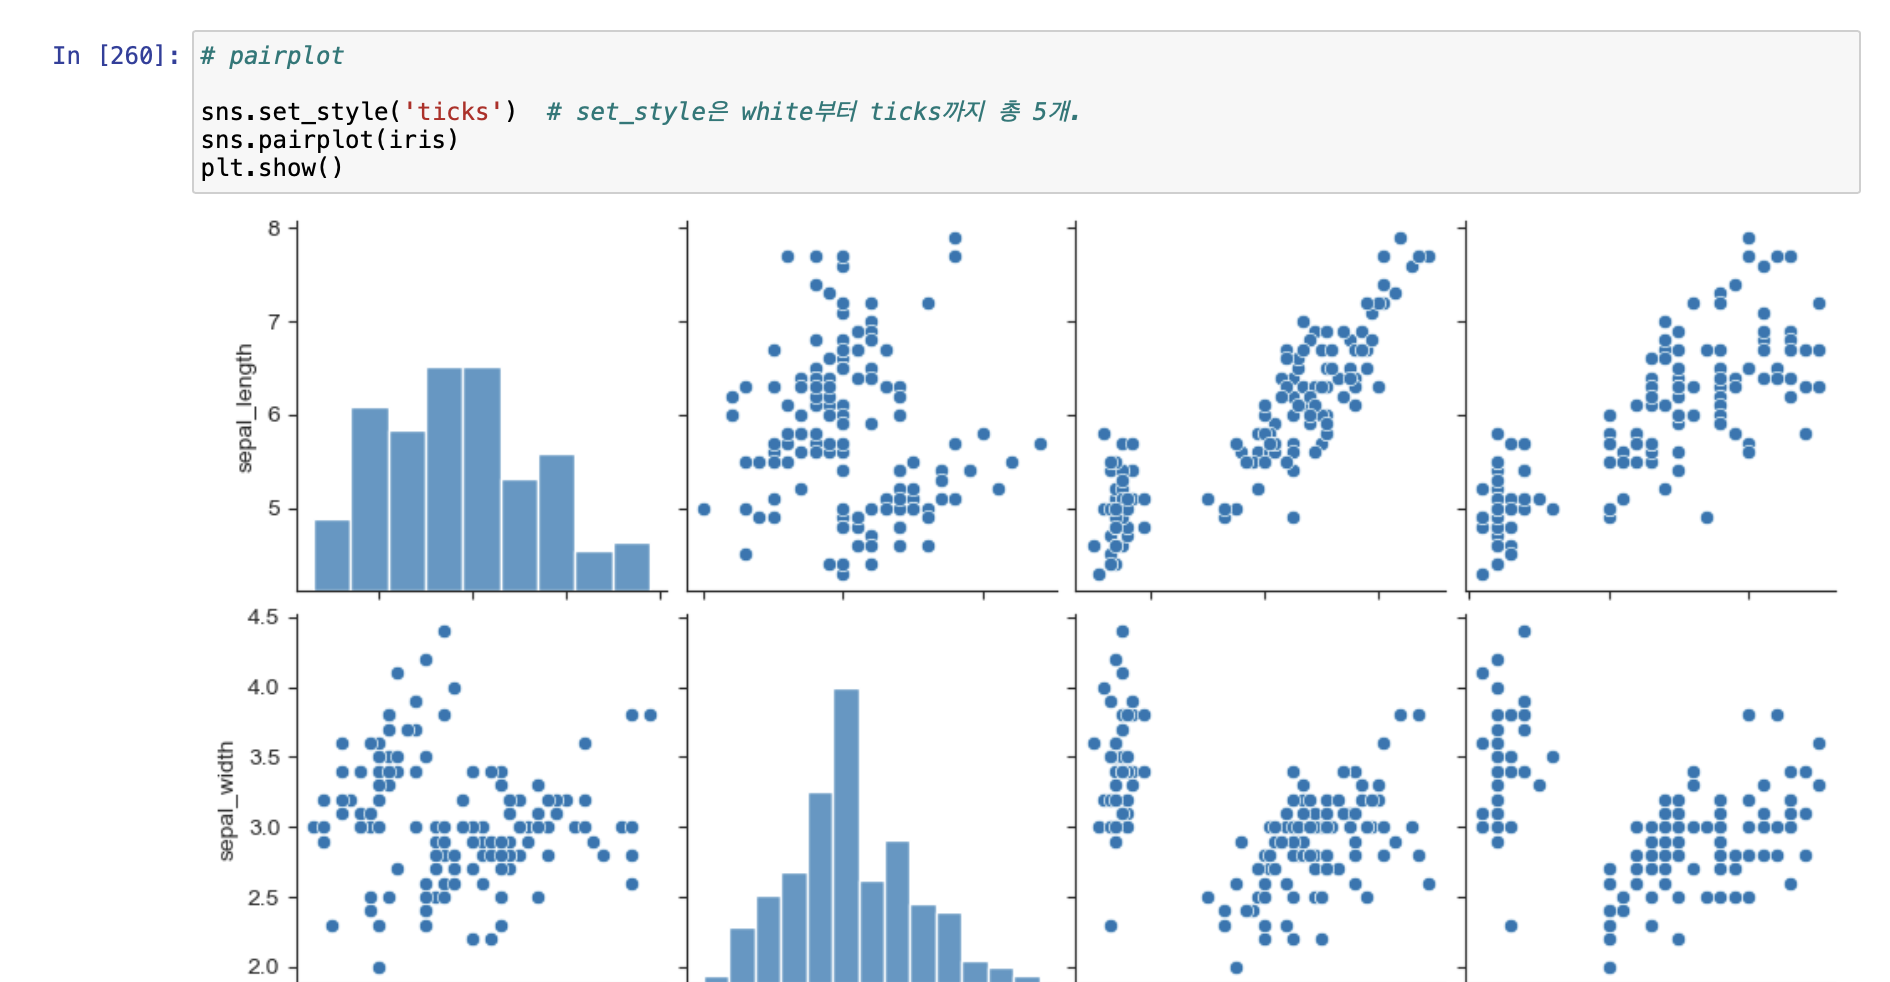
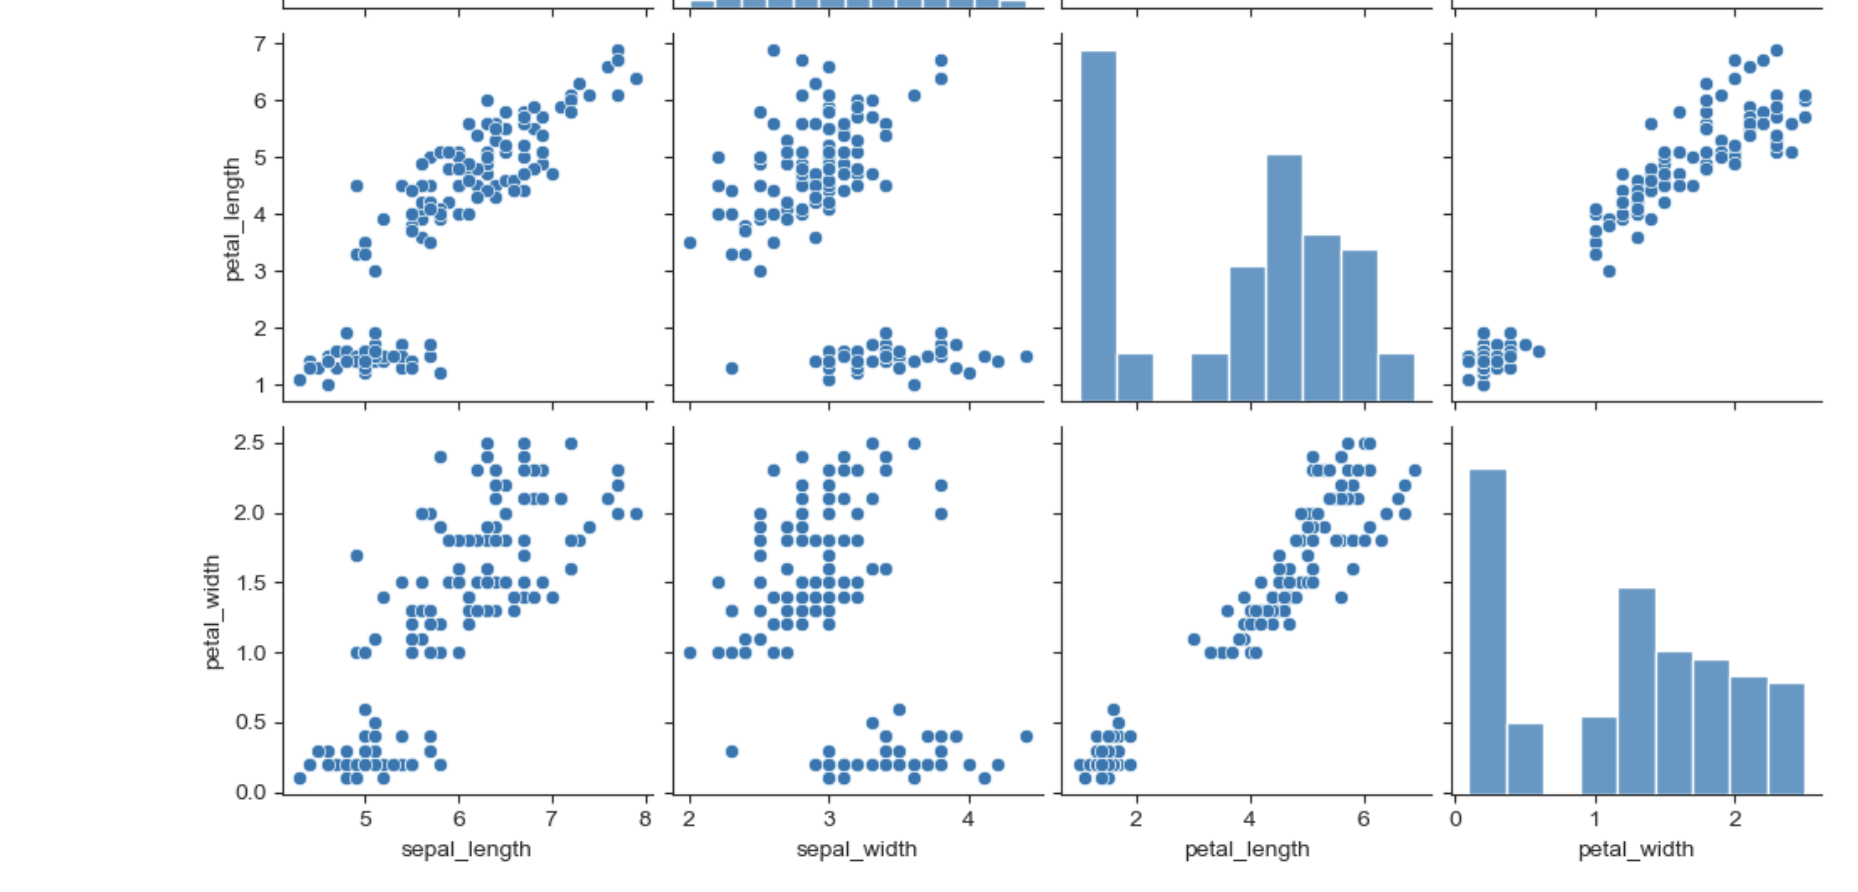
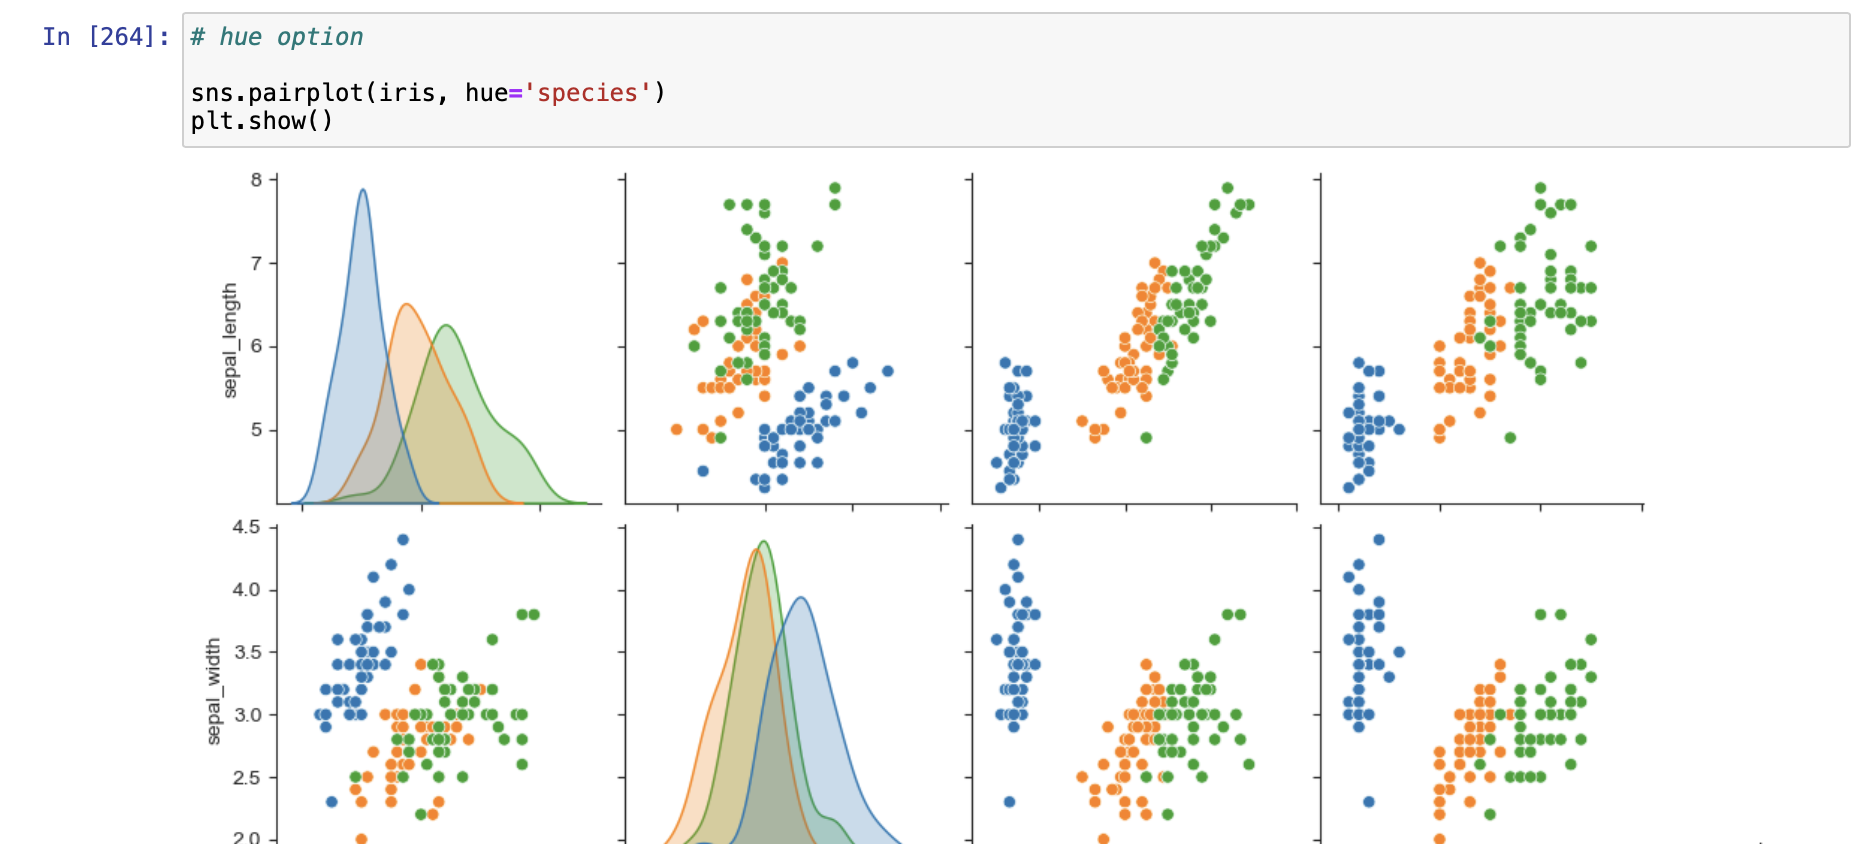
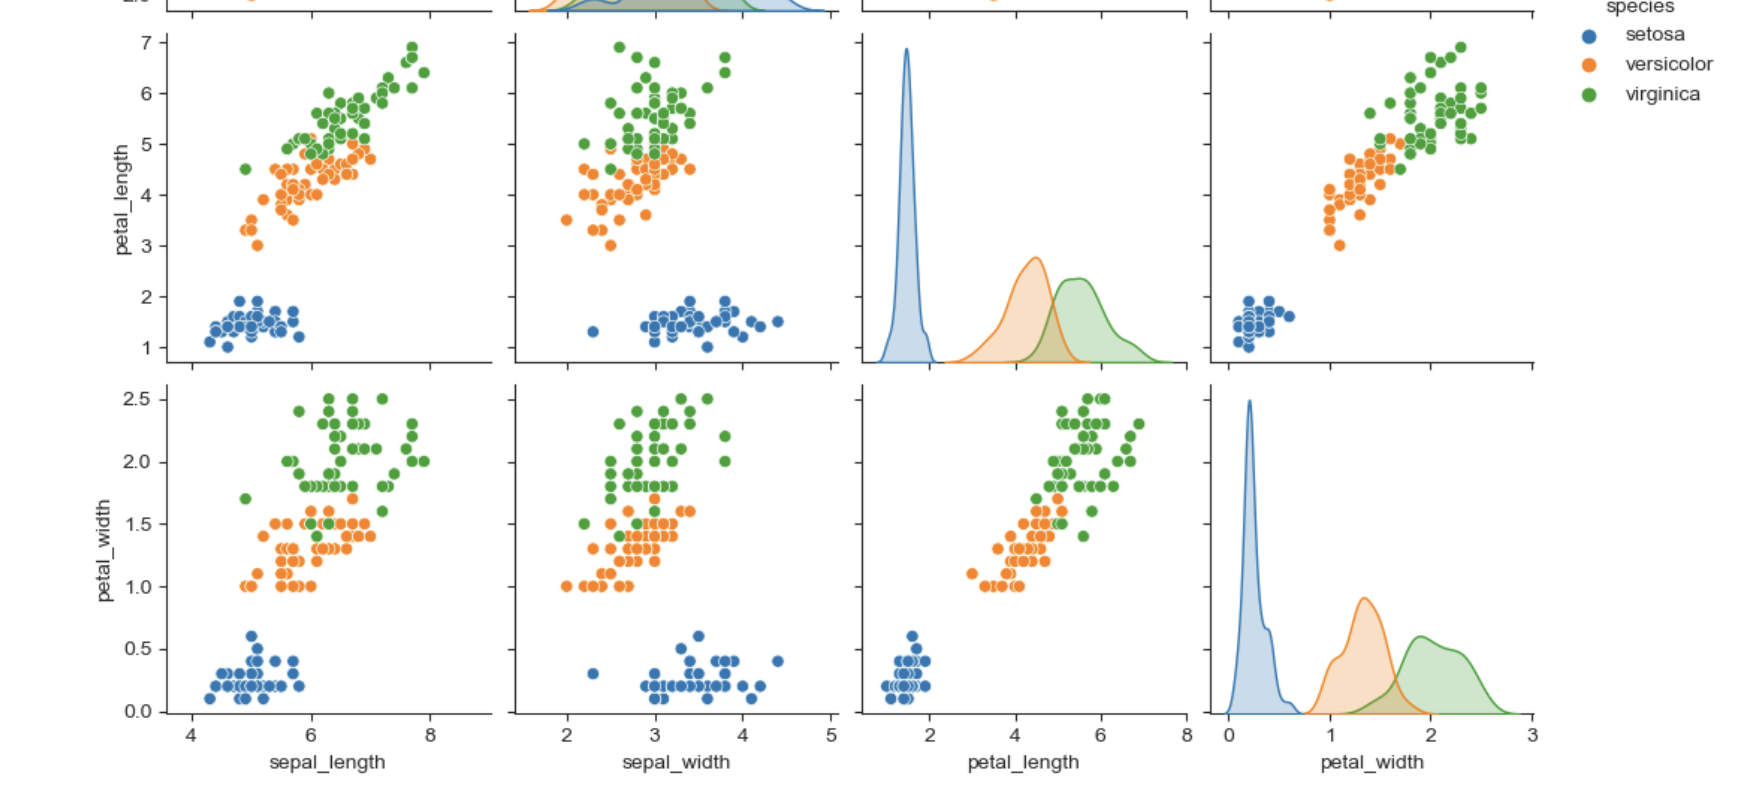
- 예제 4) iris data
- pairplot
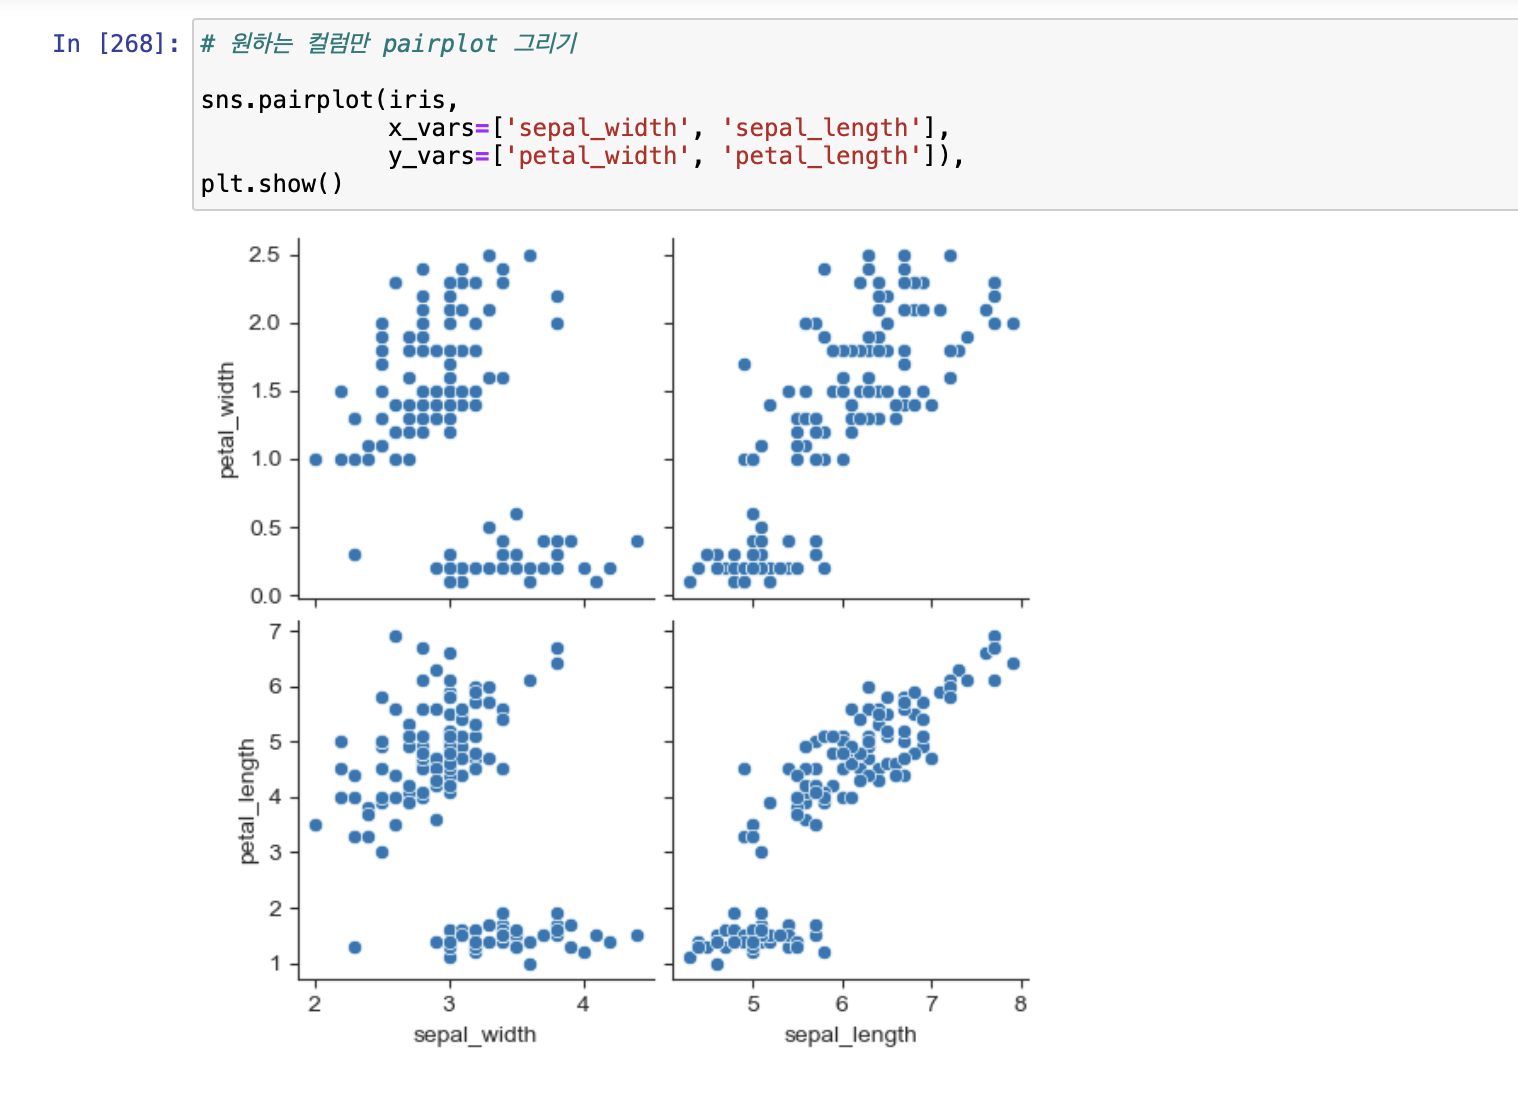
- 원하는 컬럼만 pairplot 그리기
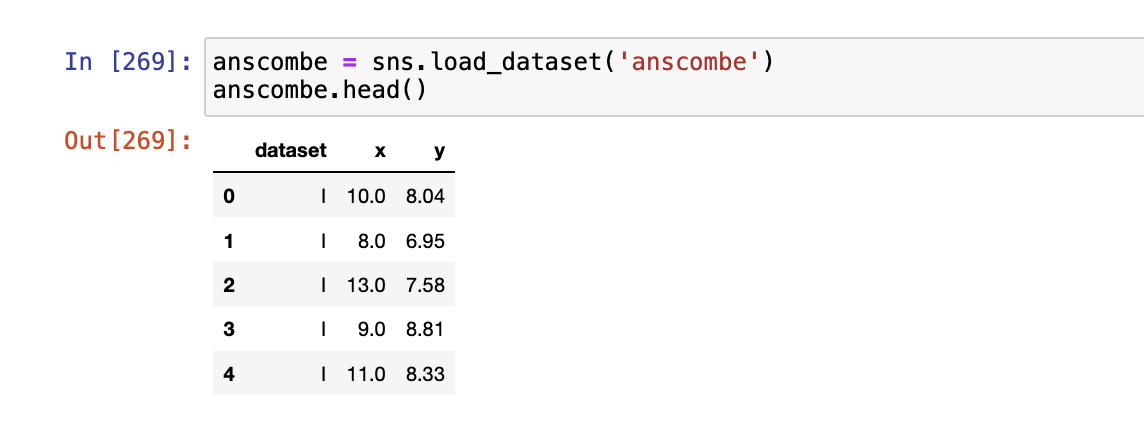
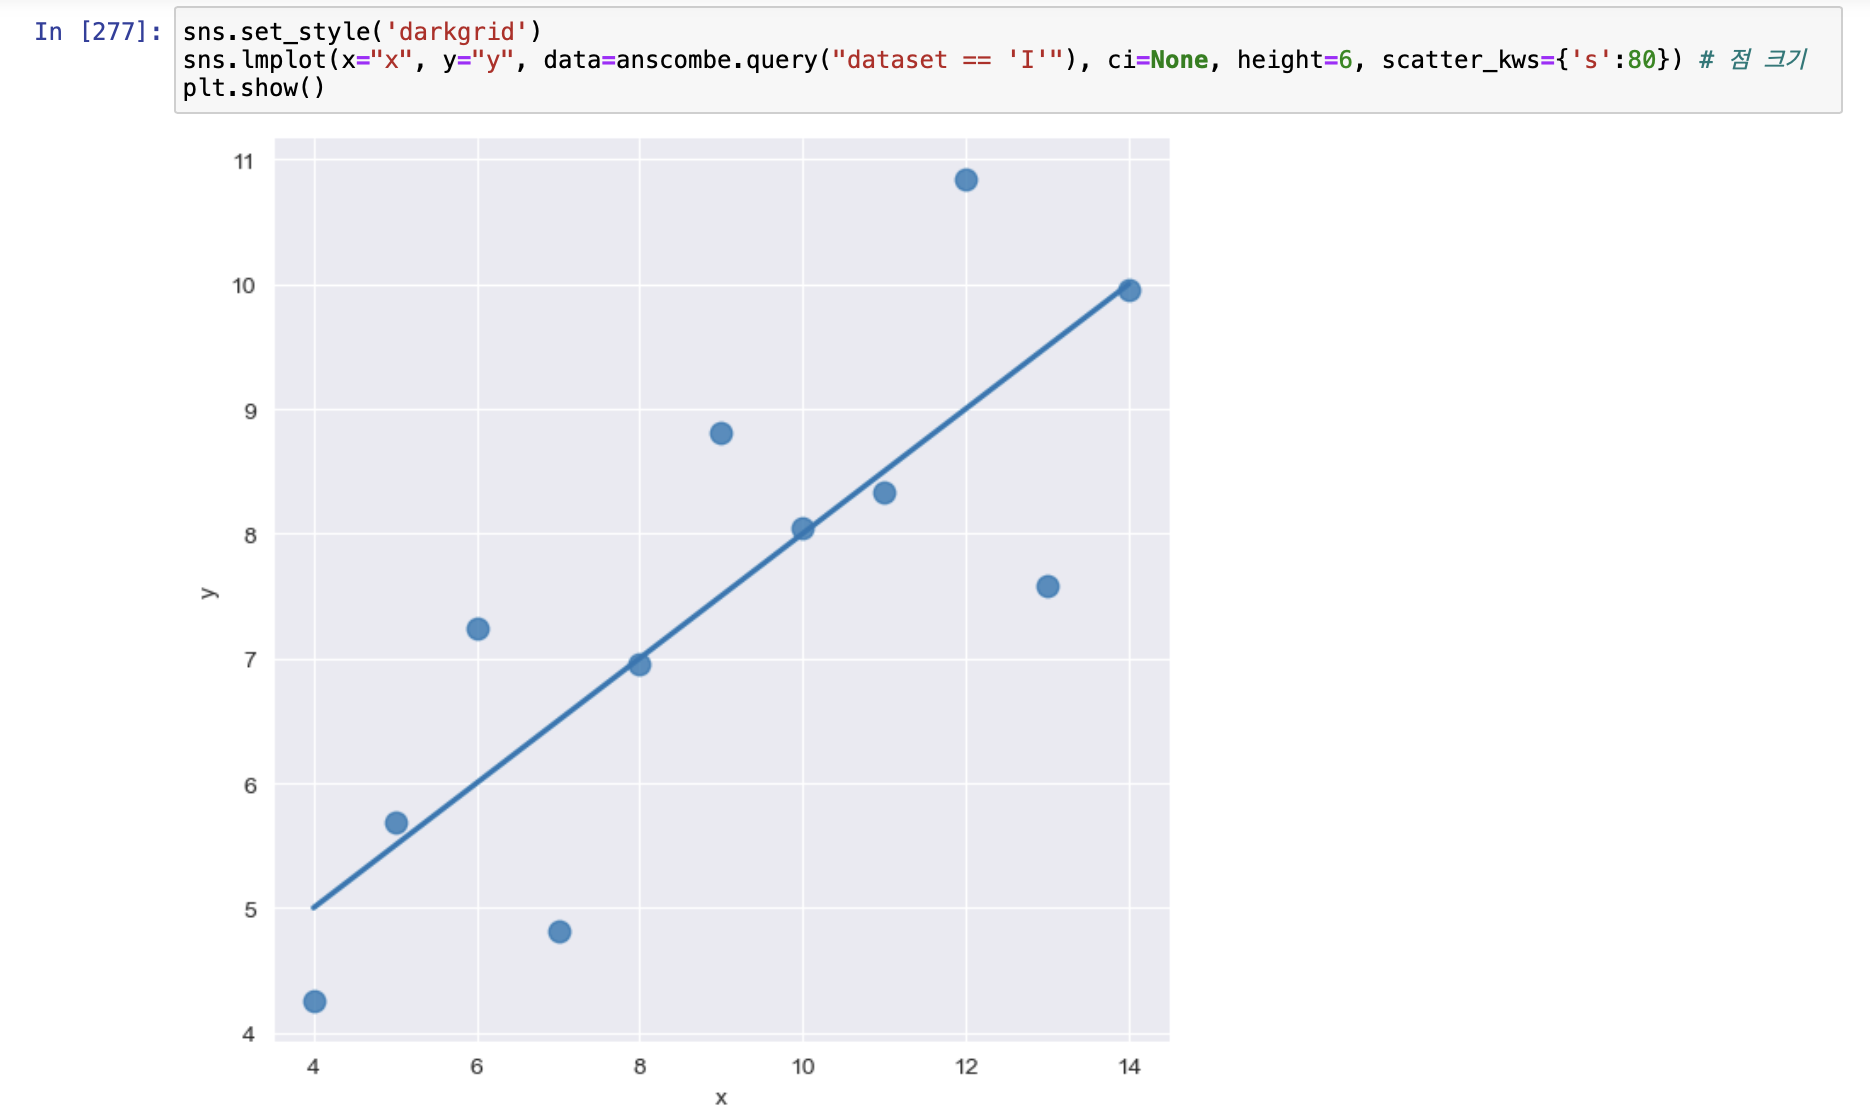
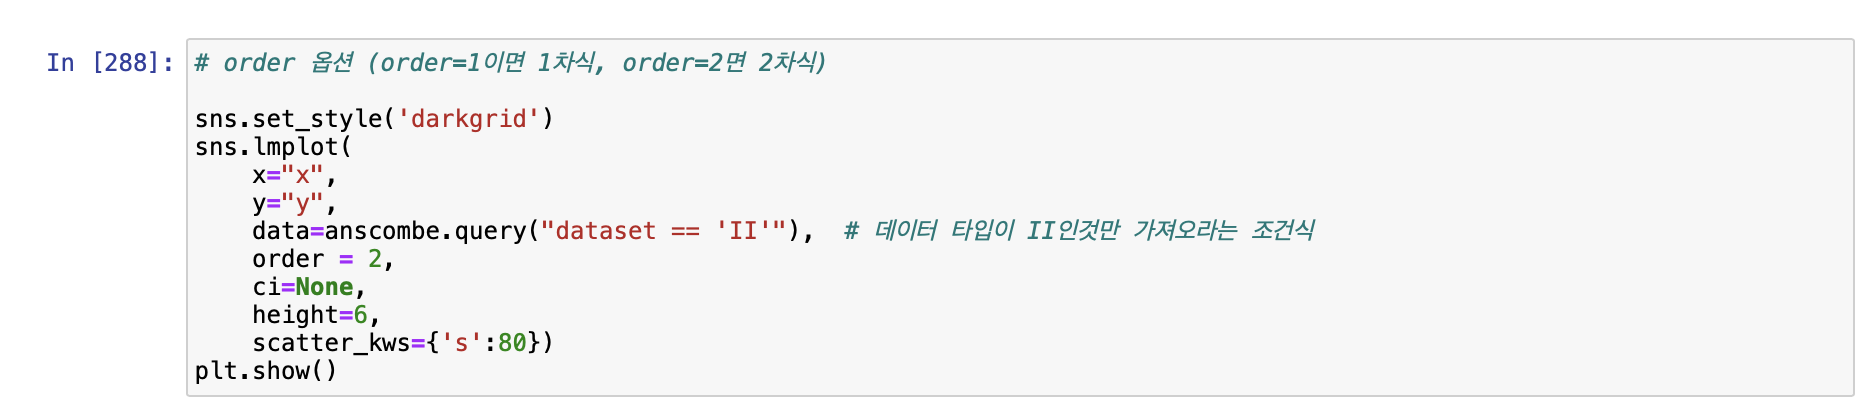
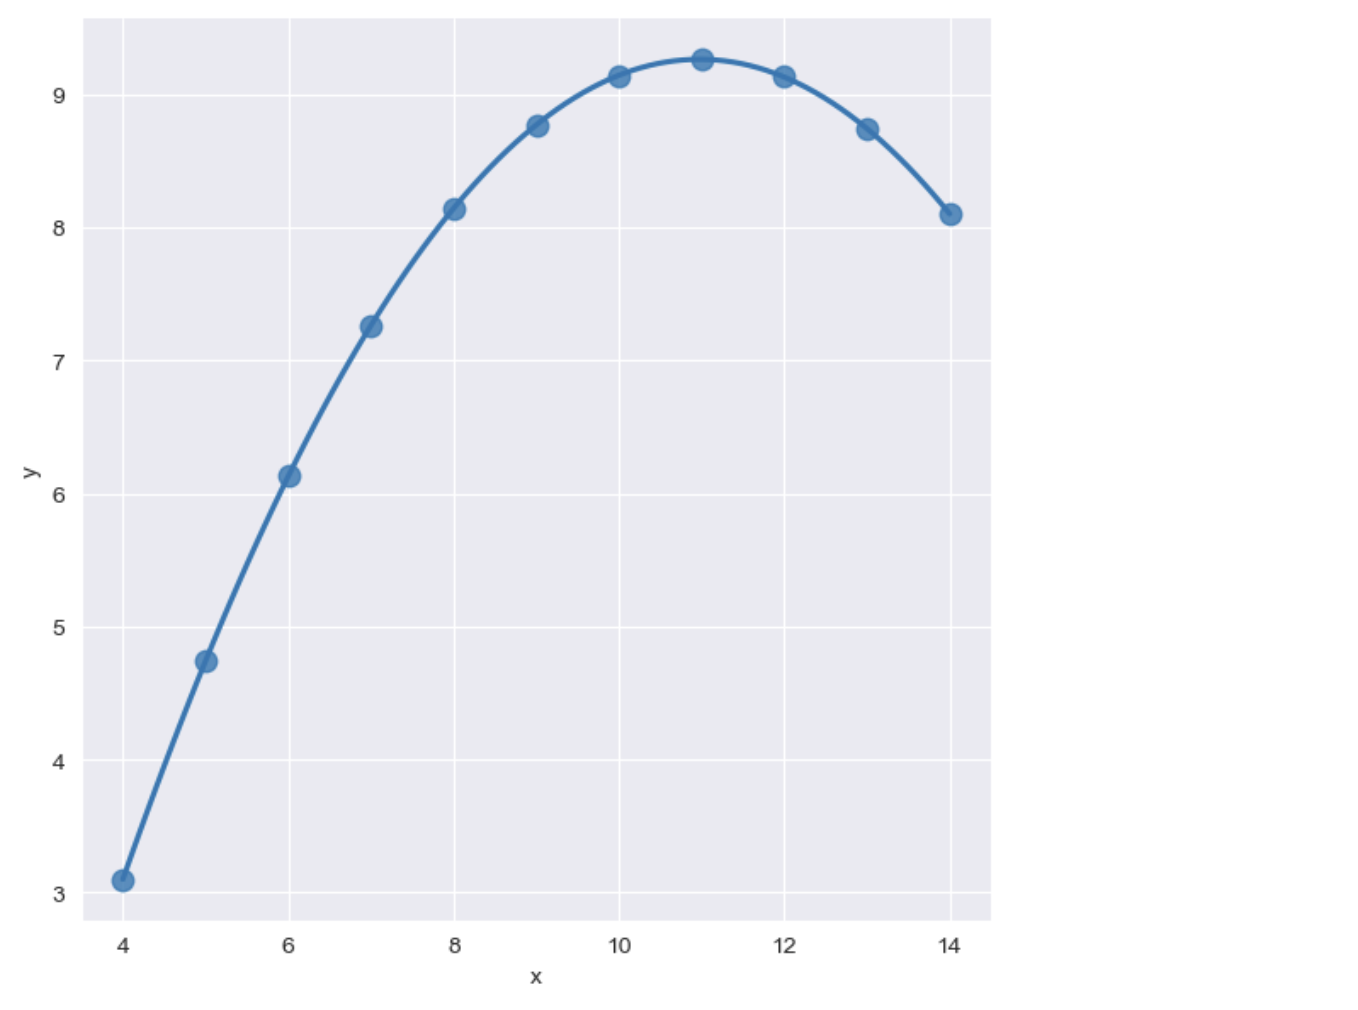
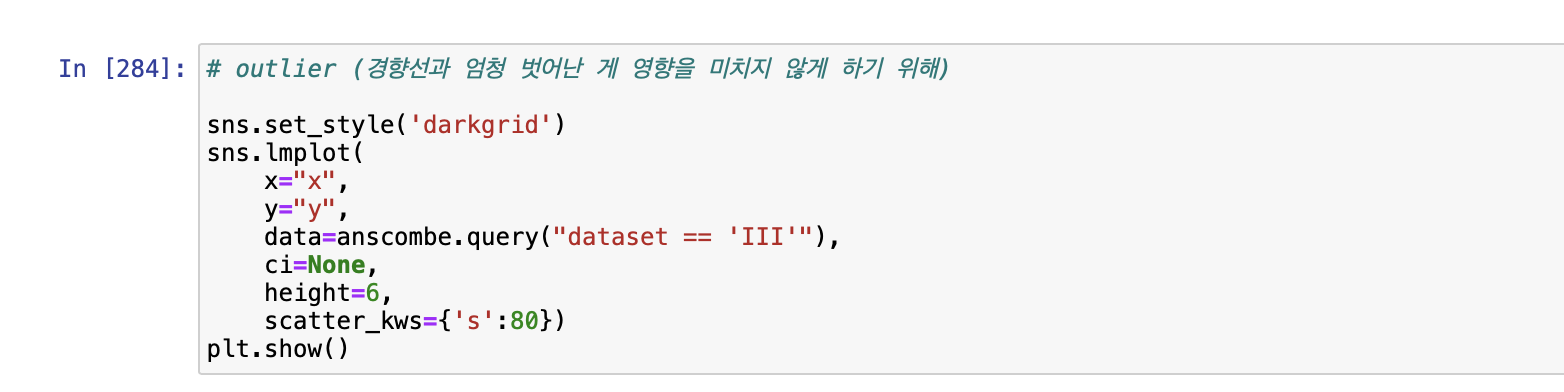
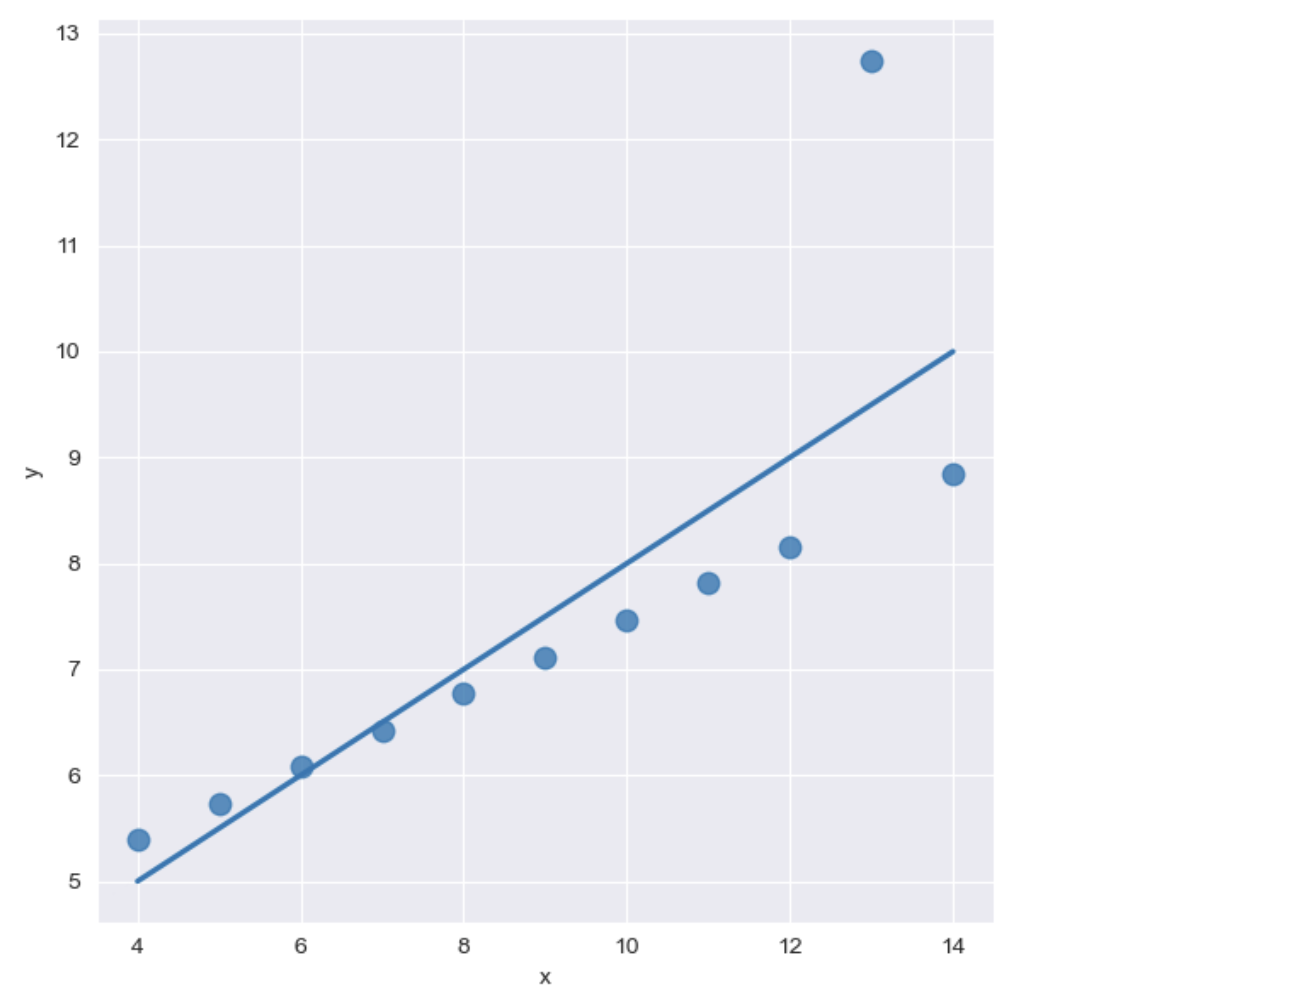
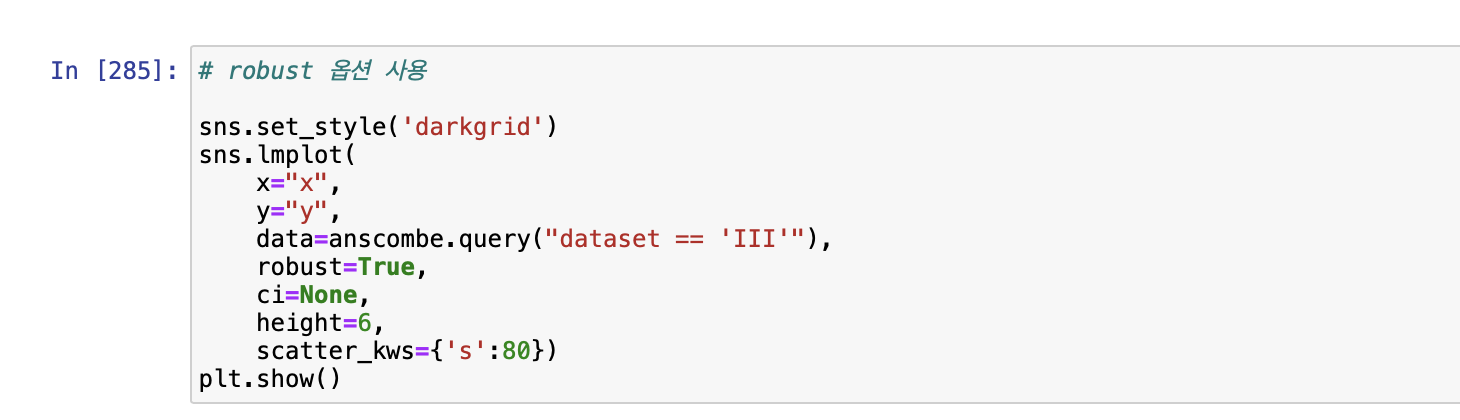
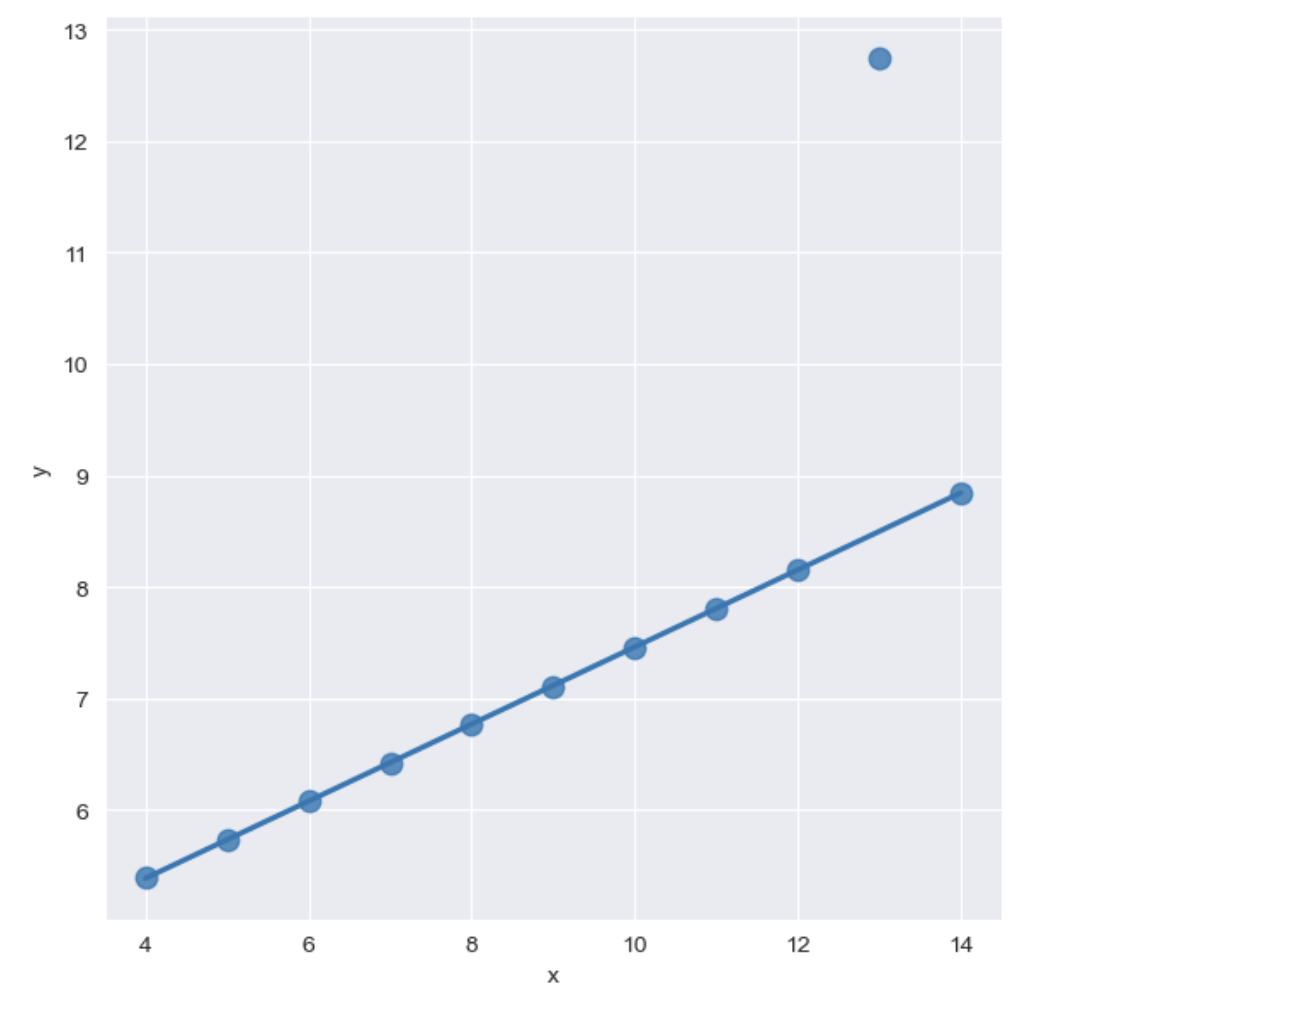
- 예제5) anscombe data
- lmplot

늘 온 마음을 다해 :)