
matplotlib 라이브러리 정리(2)
레이블 추가하기 ✍️
plt.plot([1, 2, 3, 4], [2, 3, 5, 10])
plt.xlabel('X-Axis', labelpad=15) #15pt
plt.ylabel('Y-Axis', labelpad=20) #20pt
plt.show()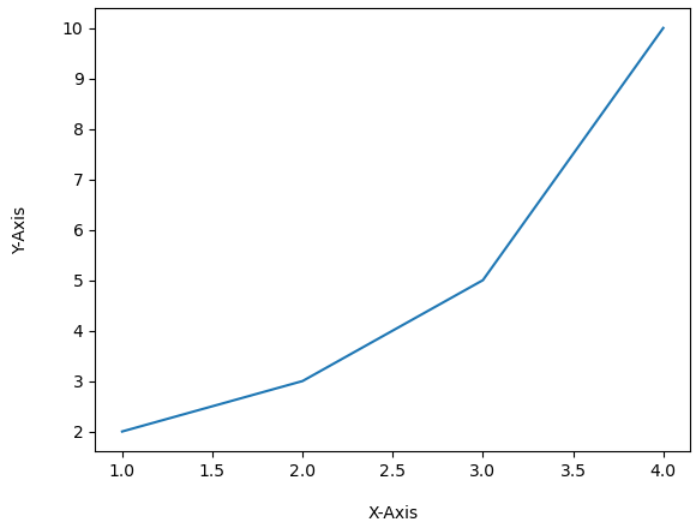
범례 추가하기 ✍️
plt.plot([1, 2, 3, 4], [2, 3, 5, 10], label='Price ($)')
plt.xlabel('X-Axis')
plt.ylabel('Y-Axis')
#plt.legend(loc=(0.0, 0.0)) #왼쪽 아래
#plt.legend(loc=(0.5, 0.5)) # 중간
#plt.legend(loc=(1.0, 1.0)) #오른쪽 위
plt.legend(loc='lower right') #오른쪽 아래
plt.show()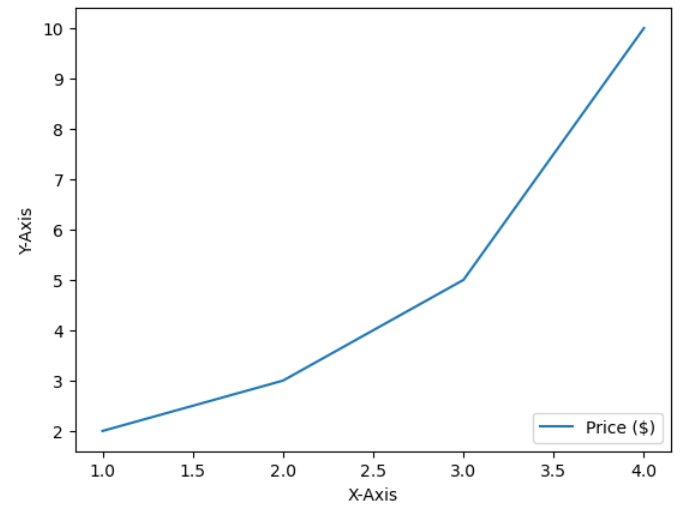
막대그래프 응용 ✍️
figure = plt.figure()
axes = figure.add_subplot(111)

x = [1,2,3,4]
y = [2,4,6,8]

x2 = [1,2,3,5]
y2 = [4,4,3,6]

axes.bar(x,y)#1번째 막대
axes.bar(x2,y2)#2번째 막대
plt.show()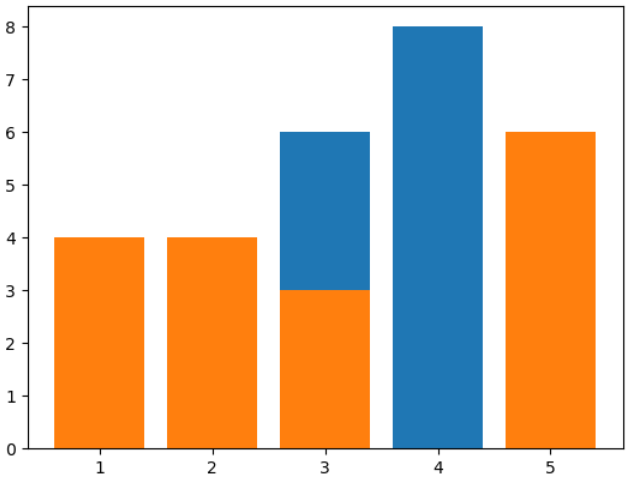
막대그래프 응용(2) ✍️
figure = plt.figure()
axes = figure.add_subplot(111)
axes2 = axes.twinx()#파이썬 twinx를 활용하여 x축을 공유하는 2개 이상의 그래프를 한 번에 시각화하는 방법

x = [1,2,3,4]
y = [2,4,6,8]
x2 = [1,2,3,4]
y2 = [4,6,1,9]

axes.bar(x,y,color='green',label='bar')#글자색은 green
axes2.plot(x2,y2,color='r',label='plot')#글자색은 red

axes.legend()#범례 생성
axes2.legend(loc=1)
plt.show()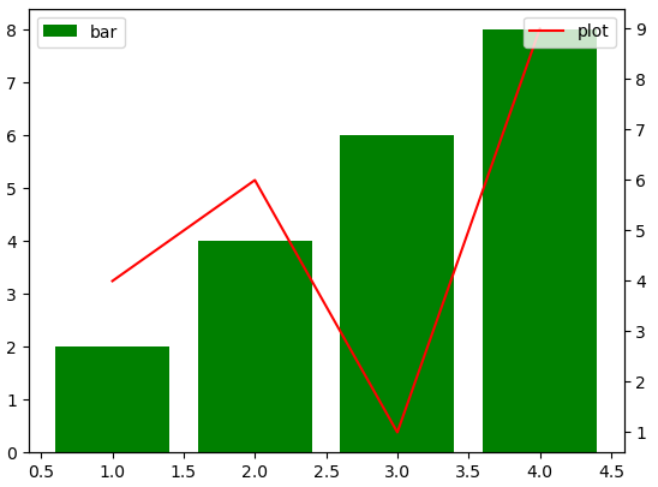
원 그래프 그리기 ✍️
figure = plt.figure()
axes = figure.add_subplot(111)

label = ['a','b','c','d']
data = [1,1,2,3]

axes.pie(data,labels=label)
plt.show()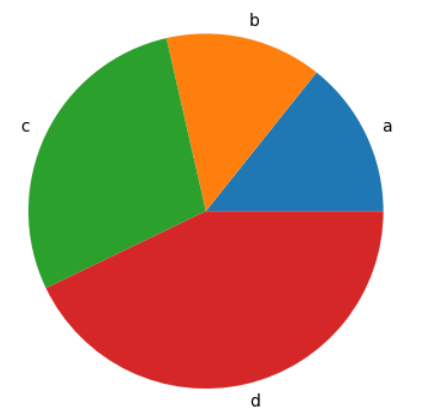

개발 꿈나무