점점어려워진다.....어떡해.............
딥러닝의 구성요소
Layer - 모델을 구성하는 층
Node - 동그라미, 기능, 출력을 정돈하는 역할
가중치 - 노드들은 이전노드들의 출력을 입력으로 받음
선의 굵기에 따라 가중치가 달라지는데 이를 학습하는게 딥러닝
딥러닝 모델이란?
- epochs - 몇번 학습할 건지 의미
- 손실함수(loss) - 예측값과 정답값이 얼마나 다른지를 정의한 것
- 옵티마이저(optimizer) - 이전 값에 갱신할 때 힌트를 주는 최적화 (오차값을 최소화하기위한 팁)
딥러닝 단계
라이브러리 로딩 -> 데이터 로드 -> 모델 구조 정의 -> 모델 컴파일 -> 모델 학습 -> 모델 평가 -> 예측 수행
데이터로드부터..
x = [-3, 31, -11, 4, 0, 22, -2, -5, -25, -14]
y = [-2, 32, -10, 5, 1, 23, -1, -4, -24, -13]

#신경망 모델은 2차원 배열 형태이기때문에 reshape()로 변환
x_train = np.array(x).reshape(-1, 1)
#-1은 알아서맞춰라, 1은 특징 1개로 지정해준 것 따라서 (10,1)로 변경됨
y_train = np.array(y)
#y는 2차원으로 변환하지않음
머신러닝은 데이터프레임형태로 진행해도 괜찮지만 딥러닝은
Tensor 기반이기 때문에 np.array형태로 바꿔주는 것이 필요! ex) .values
모델 구조 정의 (선형회귀모델)
Sequential - 층을 쌓는 구조로 Dense를 이용해 레이어를 쌓음
model = Sequential()
model.add(Dense(units=1, activation='linear',input_dim=1))       #Dense 몇개 입력받을래? 몇개 출력할래? 결정해야됨 그래야 노드 갯수 정해짐

#units = 출력, 안쓰고 숫자만 써도 상관 없음, 여기선 회귀니까 주관식 답 1개만 출력
#activation - 활성화함수, 출력을 정돈
#input_dim  - 입력 몇개 받을지, 처음 인풋 맨위 노드 인풋 몇게줄건지 아까 특성(feature)1개였으니까 1적어줌
#1 - 0번파일처럼하는 방법

# model = Sequential()
# model.add(Dense(64, activation='relu', input_shape=(x_train.shape[1],))
# model.add(Dense(32, activation='relu')
# model.add(Dense(1))

#2
model = Sequential([
    Dense(64, activation='relu', input_shape=(x_train.shape[1],)),
    Dense(32, activation='relu'),  #64개 받으니까 input_shape필요 없음
    Dense(1)   #출력층
])
밑의 코드 파일에서는 x_train.shape = (584.4)인데 x_train.shape[1]처럼
인덱싱하면 4를 뜻함 (컬럼 가져와라~!)
모델 컴파일
model.compile(optimizer='adam', loss='mse', metrics=['mae'])모델 학습
epochs - 전체 데이터를 학습할 횟수 (반복 횟수)
batch_size - 한 번에 학습에 사용하는 데이터 묶음 수 (미니배치 단위)
validation_split - 훈련 데이터의 20%를 검증용으로 자동 분할
verbose - 학습 과정 출력 방식 (0: 출력 없음, 1: 진행 바, 2: 줄바꿈 출력)
history = model.fit(x_train, y_train, epochs=100, batch_size=16, validation_split=0.2, verbose=1)
딥러닝은 train/val/test로 분할하는데 val까지 나누는 이유는?
- 잘 학습하고 있는지 보기 위해서!
모델 평가
loss, mae = model.evaluate(x_test, y_test)
예측 수행
y_pred = model.predict(x_test).flatten()
#결과는 2차원 배열이어야 하기 때문에 flatten함수 사용


for i in range(10): #10개출력
    print(f"실제값: {y_test[i]} / 예측값: {y_pred[i]}") #i번째값 가져와라
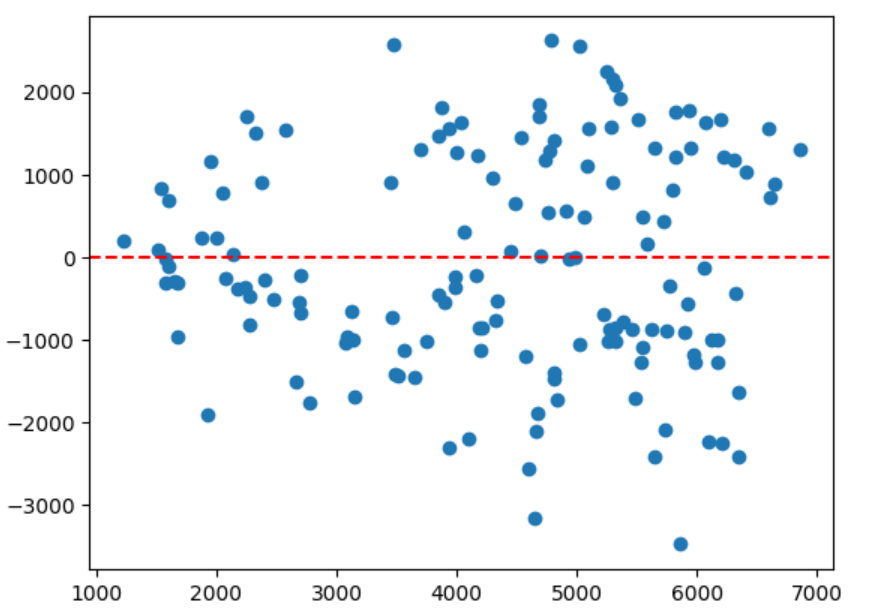
시각화
residuals = y_test - y_pred
plt.scatter(y_pred, residuals)
plt.axhline(0, coler = 'red', linestyle='--')
plt.show()
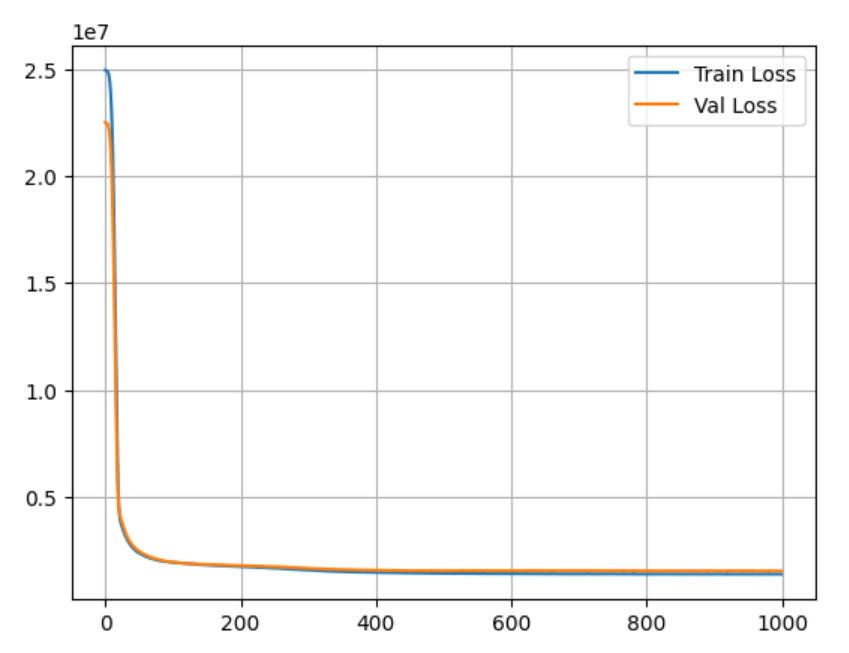
손실 변화 추이 시각화
plt.plot(history.history['loss'], label = 'Train Loss')
plt.plot(history,history['val_loss'], label = 'Val Loss')
plt.legend()
plt.grid()
plt.show()