Auto-Kriging Adaptation of Space Mapping Technique for Coastal Marine Debris Visualization
Introduction
Given its vast extent, marine debris poses a significant management challenge along the Korean coastline. Traditional methods of handling marine debris such as the establishment of observatories and the generation of point maps have proven to be inadequate due to the difficulty in identifying the midpoint of observations and drawing an overall map for effective management.
This study proposes Kriging, a geostatistical interpolation technique, as a key method for generating a continuous map that facilitates with "variogram model", giving more weights to the closer value and predicting the vacant points based on that information.
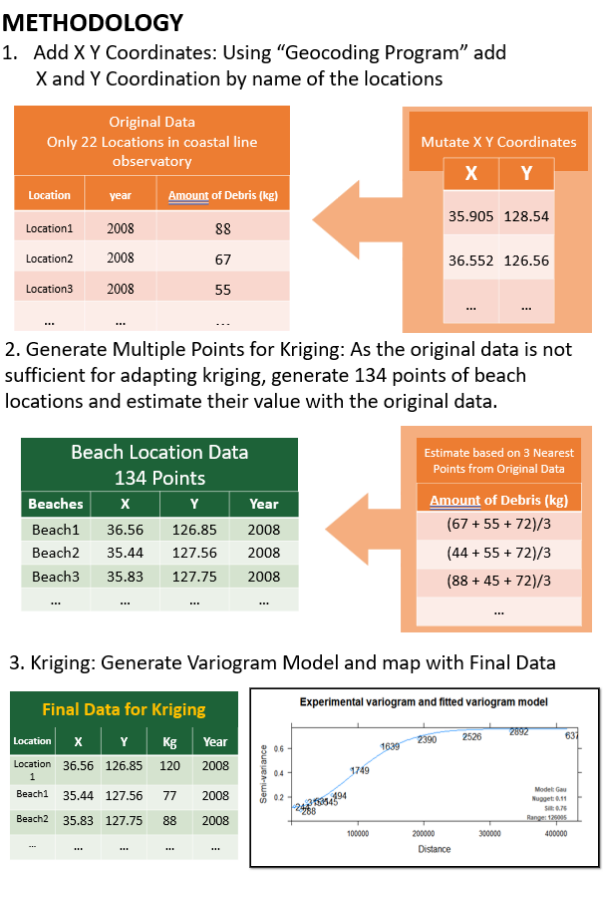
Prior to implementing Kriging, data processing is required to address the limited number of data points. This involves considering beaches with similar characteristics as equivalent points and estimating their value based on the mean of the three nearest original data points.
This processed data is then combined with the original data, and Kriging can be implemented. The resulting continuous map provides a more effective approach to managing marine debris along the Korean coastline. Furthermore, observed patterns and time series maps can be utilized to inform policymaking by identifying areas of severe accumulation and facilitating targeted management efforts.
Overall, data mining, data processing, and Kriging adaptation and projection on the map are done by R.
한국 해안가에서 해양 쓰레기 관리는 광범위한 범위로 인해 큰 어려움이 있으며, 기존의
관측소 설치나 점 지도 생성 방식은 한계가 있다. 이에 본 연구는 연속적인 지도 생성을 위
해 반변량 함수(variogram model)를 이용한 지리통계적 보간 기법인 Kriging 기법을 제안한
다.
데이터 수가 부족한 문제를 해결하기 위해 전처리를 수행하고 유사한 특성을 가진 해변을 동
등하게 보고, 세 개의 인접 원시 데이터 평균값을 이용해 값을 추정한다.
이렇게 생성된 전처리 데이터를 원본 데이터와 결합하여 Kriging을 수행하고, 결과적으로 연
속 지도 형태로 해양 쓰레기 분포를 시각화할 수 있다. 이 지도와 시계열 데이터를 바탕으로
고밀도 쓰레기 발생 지역을 식별하고, 효과적인 정책 수립과 관리 전략 수립이 가능하다.
Method
Result
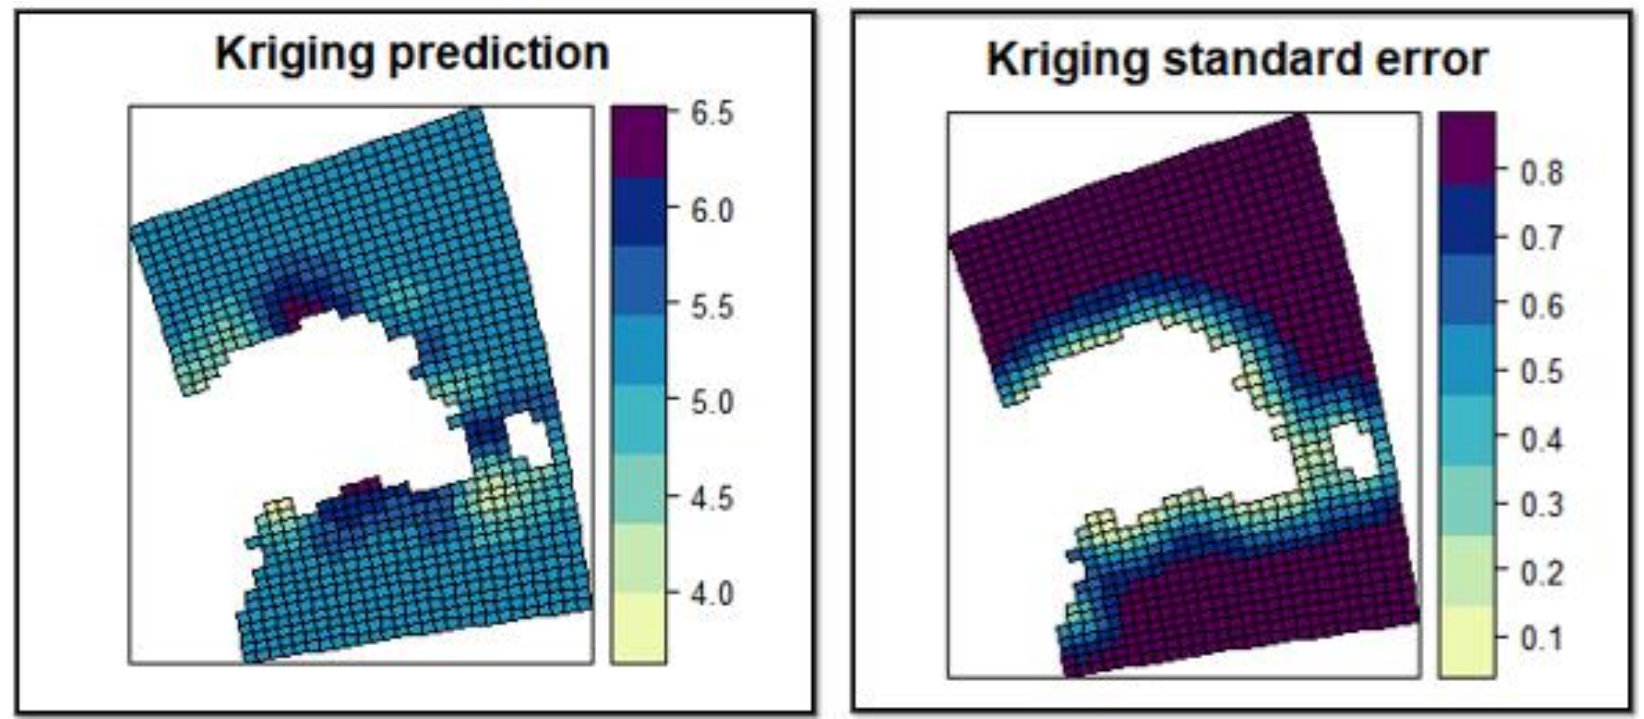
The maps enabled the identification of areas with high concentrations of marine debris and highlighted regions requiring more focused management efforts. They also facilitated the analysis of temporal changes in debris accumulation. Notably, the southern, western, and eastern coastal points of Busan showed significant accumulation. For the variogram model, the Gaussian model was selected due to its lowest mean standard deviation. Future research could enhance accuracy by incorporating ocean data in addition to coastline information.
생성된 지도는 해양 쓰레기가 집중된 지역을 식별하는 데 기여했으며, 집중 관리가 필요한 구역을 강조함으로써 효과적인 대응을 가능하게 했다. 또한 시계열 분석을 통해 쓰레기 축적의 시간적 변화를 파악하는 데 도움을 주었다. 특히 부산의 남쪽, 서쪽, 동쪽 지점에서 해양 쓰레기가 현저히 많이 축적된 것으로 나타났다. 보간에 사용된 반변량 함수로는 평균 표준편차가 가장 낮은 가우시안(Gaussian) 모델이 선택되었다. 지도는 해양 쓰레기 밀집 지역과 관리가 필요한 구역 을 식별하고, 시간에 따른 변화 분석에도 활용되었다. 부산의 남·서·동 지역에서 쓰레기 축적이 두드러졌으며, 가우시안 모델이 반변량 함수로 사용되었다