▶ 기초 프로젝트 데이터셋 분석
선정 데이터: 스타벅스 마케팅 데이터

- 스타벅스 프로모션 제안 관련 고객 데이터
- 총 3개의 테이블로 프로모션 정보를 담은
portfolio테이블, 고객 행동 기록 데이터를 담은transcript테이블, 고객 정보를 담은profile테이블로 구성
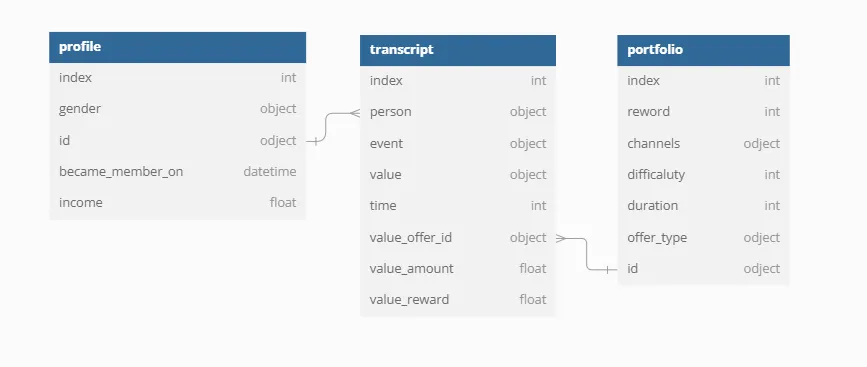
Raw Data 구조
1. Portfolio 테이블
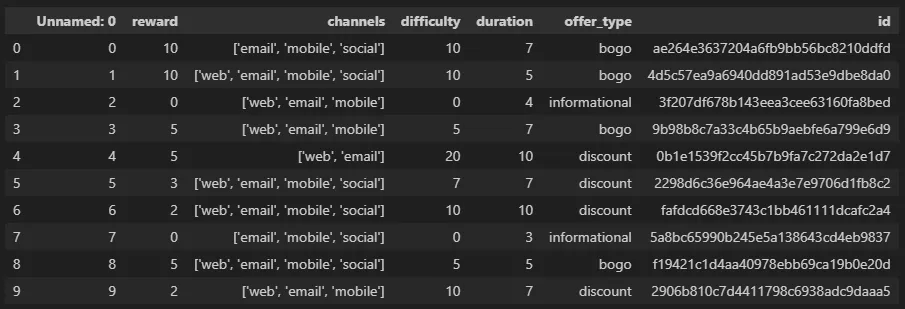
✅ Portfolio 테이블 설명 → 프로모션 정보 테이블
수신 가능한 프로모션 제안에 대한 정보와 각 프로모션의 유형, 프로모션 기간, 보상 그리고 해당 프로모션이 고객에게 어떻게 배포 되었는지에 대한 기본 정보
1-1) reward
- 제안을 완료했을 때 제공되는 보상
( → 단위 확인되면 좋을 것 같은데.. )
1-2) channels
- 마케팅 채널 → 문자열 리스트로 구성
- 리스트 포함 요소 : web / email / mobile / social
1-3) difficulty
- 오퍼를 완료하기 위해 필요한 최소 지출액
( → 얘도 단위 확인되면 좋을 것 같다..ㅜㅜ )
1-4) duration
- 기간
( → 컬럼 설명에 UNKNOWN으로 되어 있어서 어떻게 처리할지 더 생각해봐야 할 것 같다. )
1-5) offer_type
- 프로모션 제안 유형 : 1+1(BOGO), 할인, 정보 제공
- 고유값 : Bogo, infomational, discount
1-6) id
- 오퍼 id
- portfolio 테이블과 연결할 때 사용
2. Profile 테이블
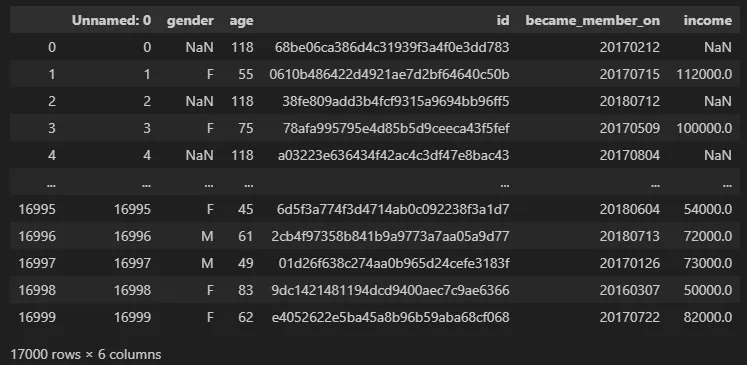
✅ profile 테이블 설명 → 고객 정보 테이블
- 각 사람에 대한 연령, 급여, 성별과 같은 차원 데이터를 포함
- 각 기록에는 하나의 고유한 고객이 포함되어 있음
2-1) gender
- 고객의 성별 (일부 항목에는 M 또는 F 대신 'O'(기타)를 포함하고 있음)
- 결측치 : 2,175
- 성별 데이터 기준으로 분류 시
O,Nan은 데이터에서 제거- 총 17,000건의 데이터 중 2,387 건이
O,Nan에 해당
- 총 17,000건의 데이터 중 2,387 건이
# gender 컬럼의 Value_count
profile['gender'].value_counts(dropna=False)

'''
gender
M      8484
F      6129
NaN    2175
O       212
'''
2-2) age
- 고객의 나이
- 결측치 : 0 / min 값 : 118 / max 값: 18
# age 컬럼 결측치 조회
null_cnt = profile['age'].isna().sum()

# min, max 값 조회
max_age = max(profile['age'])
min_age = min(profile['age'])


print(f'결측치: {null_cnt}')
print(f'max: {max_age}, min: {min_age}')
2-3) id
- 고객 id
transcript테이블의person과 연결- 결측치 : 0 / 중복값 : 0
# id 컬럼 null값 조회
profile['id'].isna().sum()

# 중복값 개수 조회
profile['id'].duplicated().sum()
2-4) became_member_on
- 고객이 앱 계정을 생성한 날짜
- 결측치 : 0 , min: 20230729, max: 20180726
- dtype ⇒ int (형 변환 작업 필요)
# became_member_on 결측치 조회
profile['became_member_on'].isna().sum()

# dtype 조회
profile['became_member_on'].dtypes

# min, max 값 조회
max(profile['became_member_on'])
min(profile['became_member_on'])
2-5) income
- 고객의 수입
- 결측치: 2,175 , max: 120,000, min: 30,000
# income 결측치 조회
profile['income'].isna().sum()

# min, max 값 조회
max(profile['income'].dropna())
min(profile['income'].dropna())
→ max 연산자 사용 했더니 결과값이 nan으로 나왔다 .. ⇒ 결측값 제거 후 다시 연산해서 해결!
3. transcript 테이블
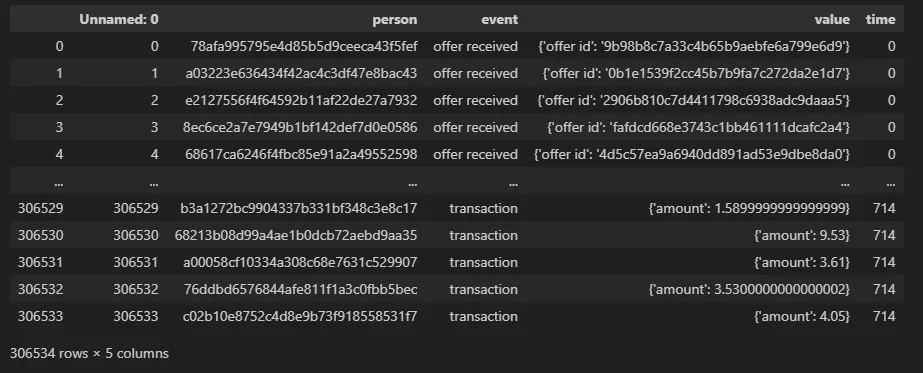
✅ transcript 테이블 설명 ⇒ 프로모션 수신 기록 테이블
- 기록에는 고객이 받은 프로모션 오퍼의 여러 단계가 표시
- 프로모션 수신의 고유 값은 수신, 보기, 완료
- 고객이 고객이 된 이후 시간 동안 수행한 다양한 거래도 확인 가능
- 모든 기록을 통해 스타벅스와 상호작용한 날짜와 금액도 확인 가능
3-1) person
- 고객 id
profile테이블의id와 연결
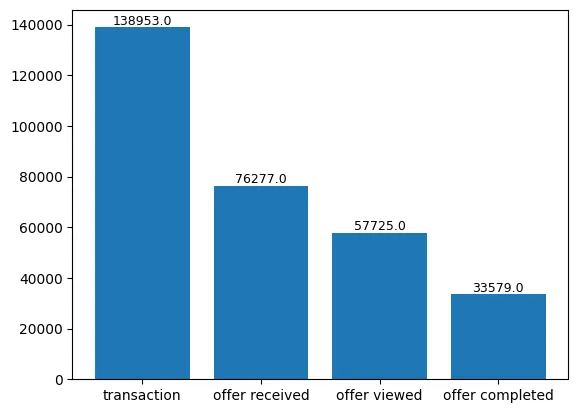
3-2) event
- record의 유형
- 고유 값 : offer received / offer viewed / transction / offer
completed
- value_count 그래프
# event 컬럼의 Value Count
event_value_cnt = transcript['event'].value_counts(dropna=False)
event_value_cnt = pd.DataFrame(event_value_cnt).reset_index()
event_value_cnt

bar = plt.bar(event_value_cnt['event'], event_value_cnt['count'])

for rect in bar:
    height = rect.get_height()
    plt.text(rect.get_x() + rect.get_width()/2.0, height, '%.1f' % height, ha='center', va='bottom', size = 9)
3-3) value
- record 유형에 따른 프로모션 ID or 거래 금액을 나타냄
- 문자열 Dictionary → 전처리 작업 필요
3-4) time
- 시간 (시간 단위)
→ 정확한 의미는 알지 못하겠으나.. 가입 후 해당 행동까지 소요된 시간을 의미하는 건가..?
→ 더 탐구해봐야 할 필요성..! - Data는 t=0에서 시작
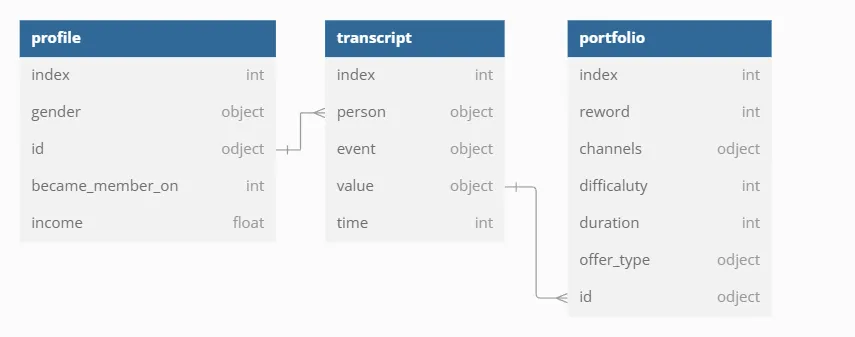
간단한 전처리 작업
1. Profile 테이블
- became_member_on 컬럼
- dtype → int ⇒ datetime 형태로 변환
profile['became_member_on'] = pd.to_datetime(profile['became_member_on']) - age 컬럼
- 이상치 판별에 대한 기준이 필요할 듯..
- age가 80 이상인 행 수 = 3,277
- age가 90 이상인 행 수 = 2,446
- 전체 행 수 = 17,000
# df.shape = (행 개수, 열 개수) 튜플 반환

# 80세 이상 데이터 수
profile[profile['age'] >= 80].shape[0]

# 90세 이상 데이터 수
profile[profile['age'] >= 90].shape[0]
2. transcript 테이블
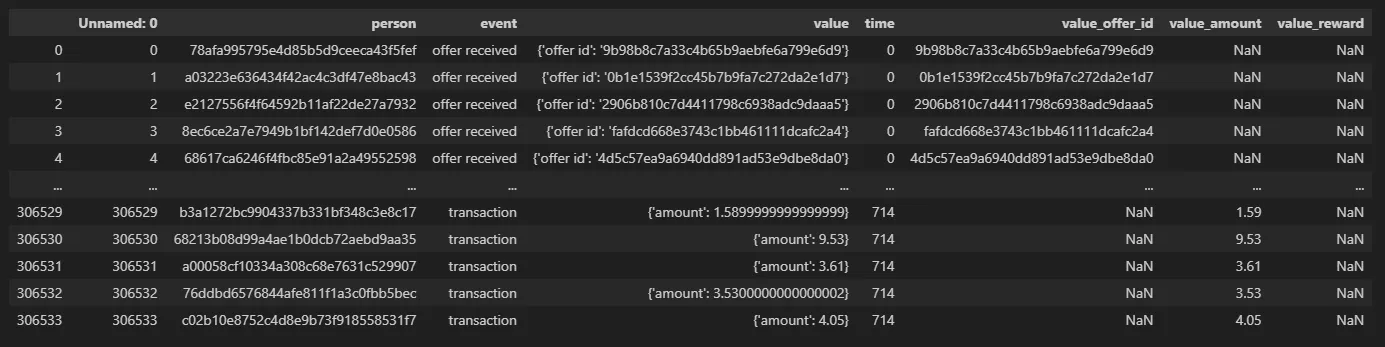
- value 컬럼
- transcript의 value 컬럼 = 문자열 Dictionary 형태로 구성
json형태의 데이터를 꺼내 개별 컬럼에 추가해주는 작업 진행
[ 세부 작업 내용 ]
- transcript의 value 컬럼 정규화
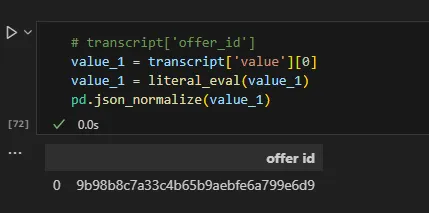
pd.json_normalize()바로 적용하려 했는데 에러 발생- value 컬럼의 첫번째 값을 뽑아봤더니 string 형태
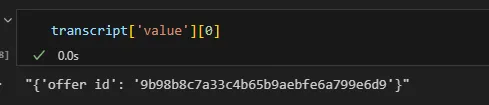
ast모듈의literal_eval사용하여 Dict 타입으로 변환
- 정상적으로 데이터 변환되는 것 확인
- 리스트 컴프리헨션 사용하여 value 컬럼의 데이터 타입 교체
json_normalize활용하여 별도의 테이블로 추출
# value 컬럼 데이터 형 변환
transcript['value'] = [literal_eval(x) for x in transcript['value']]

# json_normalize() : 딕셔너리 => 테이블로 변환
value_df = pd.json_normalize(transcript['value'])

value_df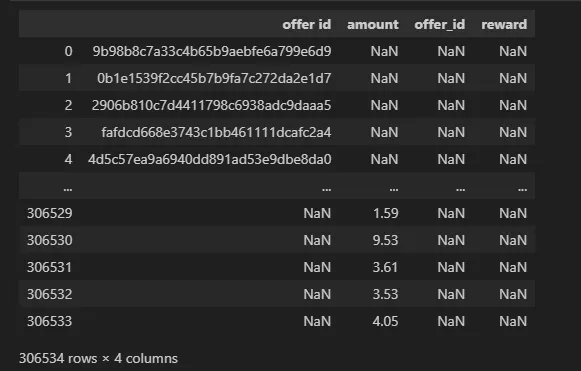
- offer id를 표시하는 컬럼이 두 개로 나눠짐 (
offer_id,offer id)
→offer_id의 결측 값을offer id의 값으로 대체
# offer_id 컬럼의 결측값에 offer id 컬럼값 입력
value_df['offer_id'] = value_df['offer_id'].fillna(value_df['offer id'])- 기존 테이블에 value 테이블의 값 집어넣기
# 기존 테이블(transcript)에 value 값 합치기
transcript['value_offer_id'] = value_df['offer_id']
transcript['value_amount'] = value_df['amount']
transcript['value_reward'] = value_df['reward']
수정 데이터 구조