
아 나 오타쿠 아닌데
해당 게시글은 아래 사이트를 참고하여 작성되었습니다.
- https://www.redhat.com/en/blog/monitoring-apache-airflow-using-prometheus
- https://wooono.tistory.com/767
Airflow dag 작업한 것들을 바탕으로 Prometheus와 Grafana를 이용해 모니터링 및 시각화해보겠다.
Airflow monitoring diagram
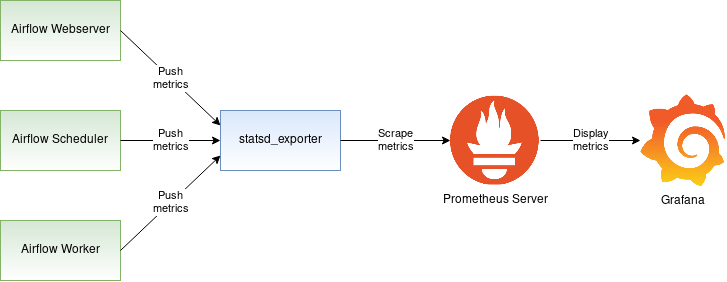
- Apache Airflow는
statsd프로토콜을 이용해 메트릭을statsd exporter에 전송한다. statsd exporter는statsd가 보낸 statsd 메트릭을 prometheus 형식으로 변환하고 저장해둔다.Prometheus는statsd exporter가 저장하고 있는 메트릭을 주기적으로 scrape(pull)한다.grafana는prometheus에 저장된 airflow metric을 pull하여 대시보드를 구성한다.
Airflow에서의 statsd metric 사용 설정
airflow.cfg 파일에서 몇 가지 변수를 아래와 같이 수정해준다.
statsd_on = True
statsd_host = localhost # 작성자는 EC2 사용 중이기 때문에 private IP를 넣어줬다
statsd_port = 8125
statsd_prefix = airflow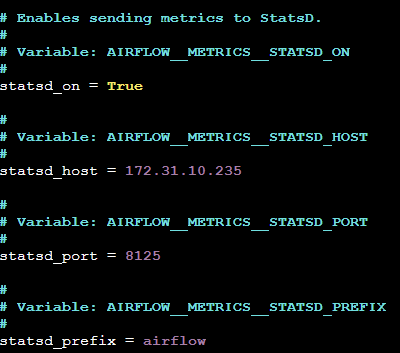
위 정보를 바탕으로 airflow는 statsd server에 statsd metric을 전송한다.
Airflow webserver, scheduler 실행
$ airflow webserver --port 8080
$ airflow scheduler
airflow webserver와 webserver를 실행시키면, airflow는 $privateIP:8125로 statsd metric을 계속해서 전송한다.
statsd metric → prometheus metric 변환
statsd_exporter를 설치하자. 내가 참고한 사이트에서는 총 2가지 방법을 제시해줬는데, 그 방법은 다음과 같다.
- Golang 환경 setup 후
statsd_exporter설치 - prometheus/statsd-exporter 컨테이너 이미지를 이용해
statsd_exporterdeploy
나는 이제까지 docker를 이용해 airflow 작업을 하지 않았기에, 첫 번째 방법을 선택했다.
다음 명령어를 이용해 Golang 명령어를 설치해준다.
$ sudo apt install golang-go다음 명령어로 statsd_exporter을 설치해준다.
$ go install github.com/prometheus/statsd_exporter@latestgo get명령어는 이제 지원하지 않는다고 한다. 따라서go install명령어를 사용해야 한다.go install명령어는 맨 뒤에 반드시 설치하고자 하는 모듈 뒤에 버전을 명시해야 한다. 여기에서는 최신 버전을 설치하겠다.
airflow를 실행시켜놓은 다음, ~/go/bin 디렉토리(statsd_exporter 파일이 존재하는 디렉토리)로 이동한 후, 다음 명령어로 statsd_exporter를 시작한다.
$ ./statsd_exporter --statsd.listen-udp (public_IPv4_DNS):8125 --log.level debug
정상적으로 작동된다면 화면에 Airflow metric이 뜨는 것을 확인할 수 있다. 또한, statsd_exporter가 이 metric을 prometheus 포맷으로 보여주는 것을 확인할 수 있다.
8125와 9102 포트를 인바운드 규칙에 추가하자.
모두 정상적으로 완료되었다면, 화면에 뜨는 Airflow metric을 확인할 수 있다. 또한, statsd_exporter가 이 metric을 prometheus 포맷으로 보여주는 것을 확인할 수 있다.
prometheus metric은 (public_IPv4_DNS):9102 에 보여진다. curl을 이용해 prometheus metric을 받아와보자.
$ curl (public_IPv4_DNS):9102/metrics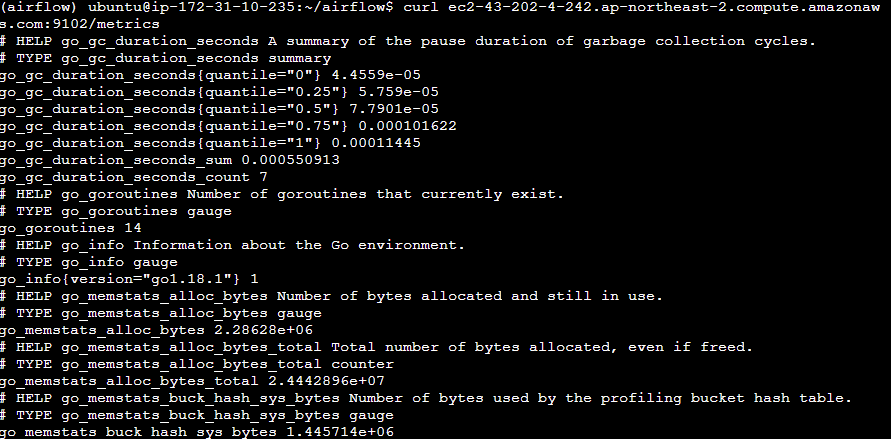
Prometheus를 이용해 metric 수집하기
위 과정을 모두 거치고 나면, 이제 Airflow metric을 Prometheus 포맷으로 사용 가능하다.
이제 이 metric을 Prometheus server가 수집할 수 있도록 설정해준다.
Prometheus 설치하기
먼저 prometheus부터 하자.
$ sudo apt update
$ sudo apt install build-essential -y
$ wget https://github.com/prometheus/prometheus/releases/download/v2.40.6/prometheus-2.40.6.linux-amd64.tar.gz
$ tar xvfz prometheus-*.tar.gz # tar 압축 풀기
$ mv prometheus-2.40.6.linux-amd64 prometheus # 경로를 prometheus로 이름 변경
$ cd prometheus # prometheus 경로에 들어가서
$ export PROMETHEUS_HOME=%(pwd) # home 설정prometheus 디렉토리에 존재하는 파일들은 다음과 같다.
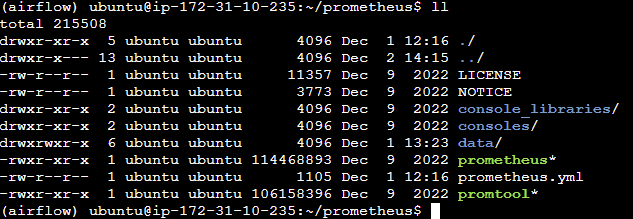
prometheus*: prometheus 실행파일promtool*: command line 파일prometheus.yml: 설정 파일
이제 prometheus를 실행하기 전 필요한 작업들을 모두 마쳤다.
prometheus가 airflow metric을 수집하기 위해 prometheus.yml 파일에 다음과 같은 코드를 추가해준다. 이 설정은 (public_IPv4_DNS):9102으로부터 prometheus server가 metric을 주기적으로 수집할 수 있도록 해주는 설정이다.
scrape_configs:
  - job_name: airflow
    static_configs:
      - targets: ['(public_IPv4_DNS):9102']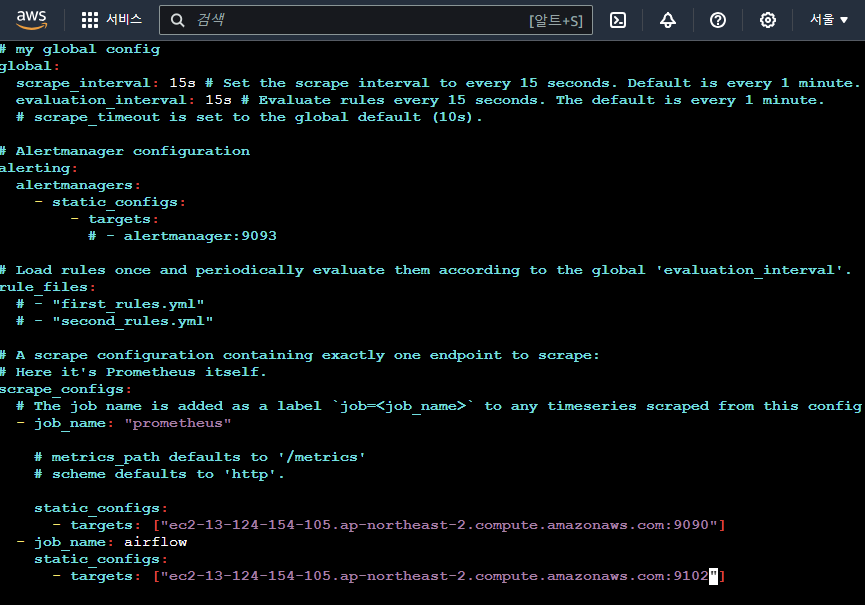
prometheus 실행
$ ./prometheus --config.file prometheus.yml(public_IPv4_DNS):9090/graph로 접속하면 다음과 같은 화면을 볼 수 있다.
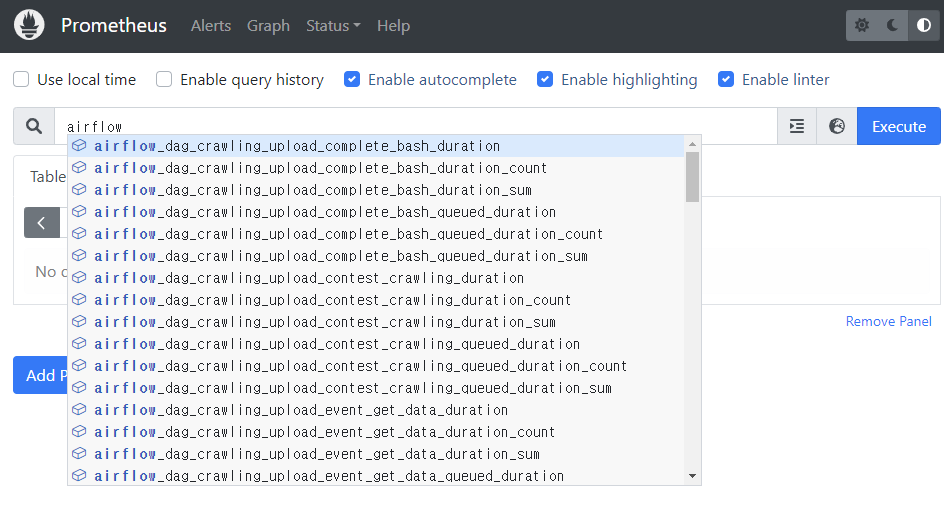
airflow metric을 잘 받아오는 것을 확인할 수 있다!
Prometheus와 Grafana 연결
prometheus는 시각화 툴이 잘 안되어 있어서 grafana와 연결해 모니터링을 잘 시각화된 툴로 다뤄보자.
Grafana 설치
$ wget https://dl.grafana.com/oss/release/grafana-9.3.1.linux-amd64.tar.gz
$ tar -zxvf grafana-9.3.1.linux-amd64.tar.gz
$ mv grafana-9.3.1 grafana
$ cd grafana
$ export GRAFANA_HOME=$(pwd)
./conf/defaults.ini 파일에 기본 설정이 들어 있다.
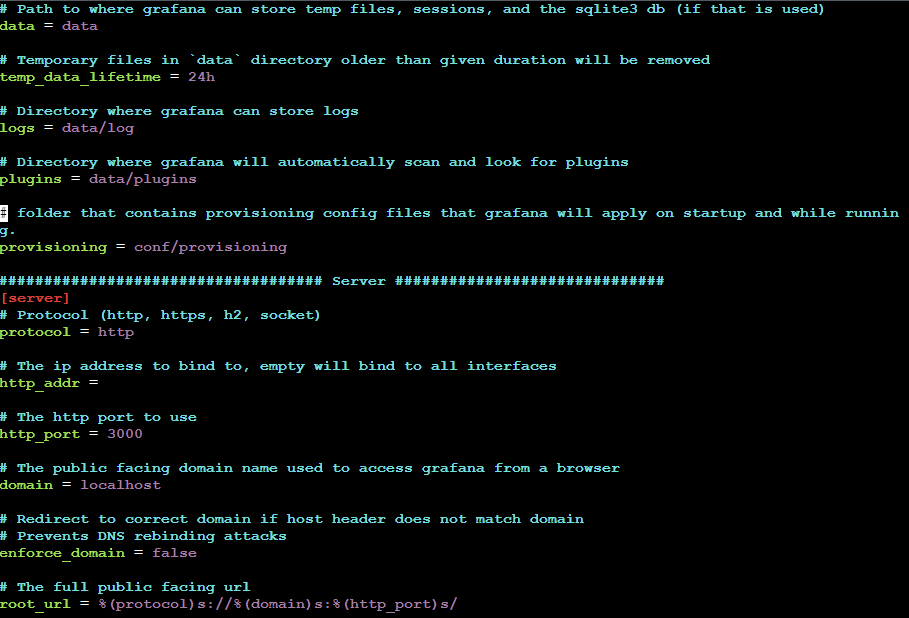
기본 포트로 3000번을 사용 중인 것을 알 수 있다. 3000번 포트를 인바운드 규칙에 추가해주자.
Grafana 실행
$ ./bin/grafana-serverGrafana와 Prometheus 연결
이제까지 정상적으로 잘 작동했다면 (public_IPv4_DNS):3000 에 접속해보자.
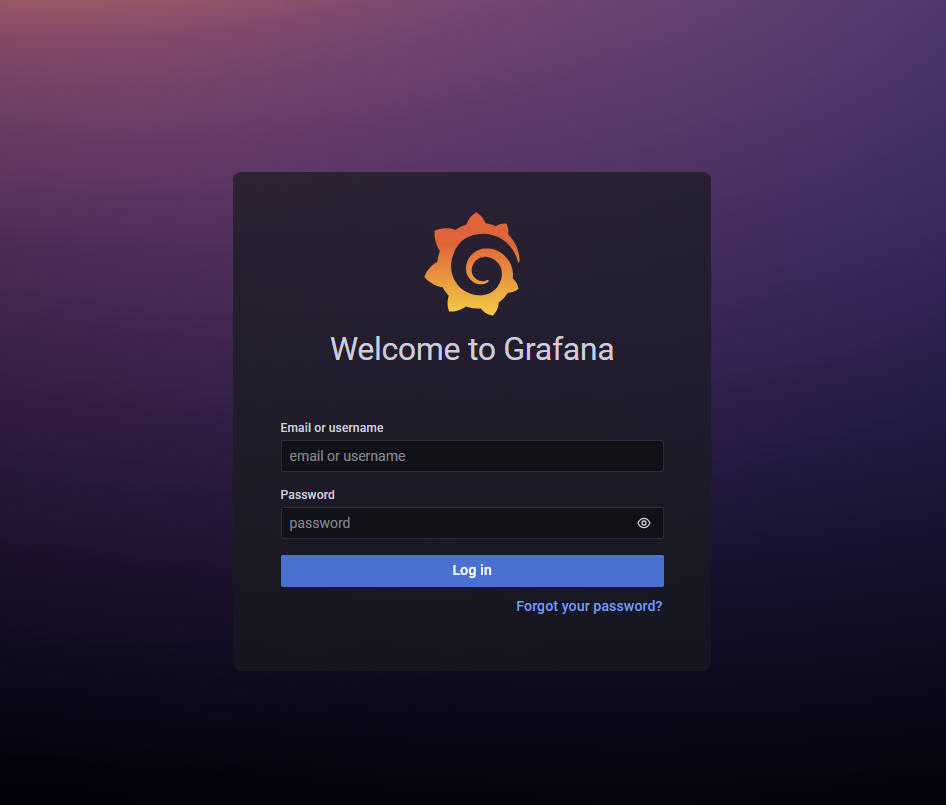
위와 같은 화면이 뜰 것이다. 기본 username/pw는 admin/admin이다. 로그인해주자.
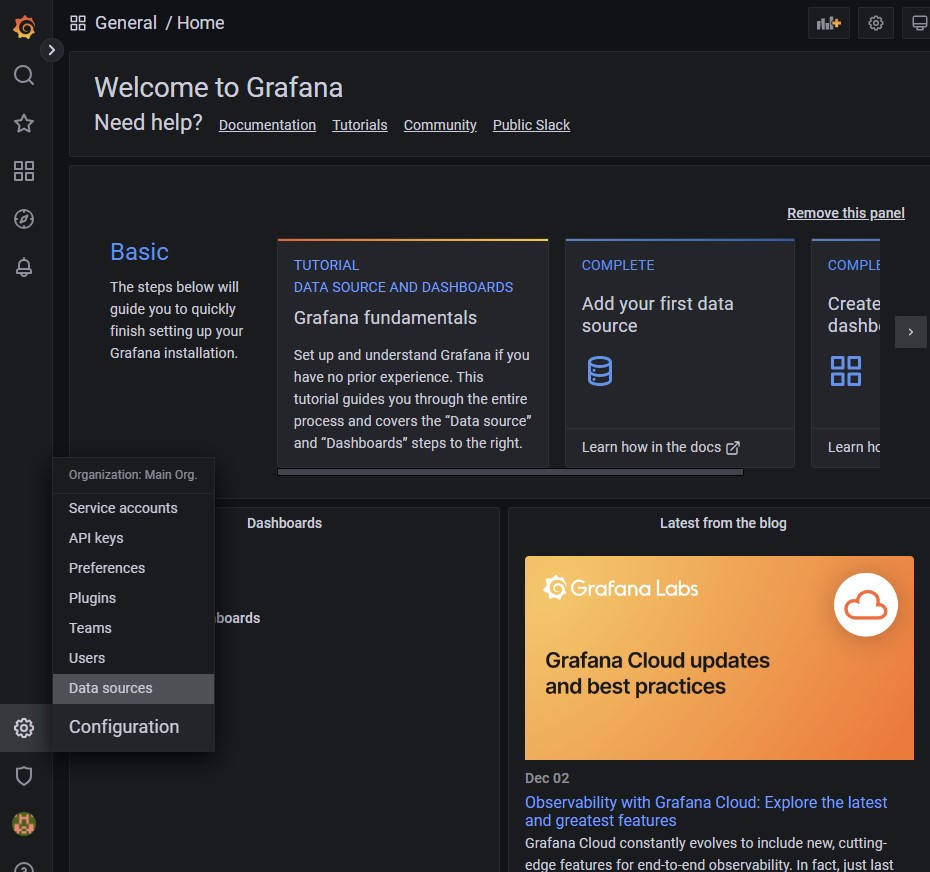
그러면 grafana 기본 페이지가 뜰 것이다. grafana를 prometheus와 연결해주기 위해 아래 화면과 같이 configuration → Data Sources에 들어가자.
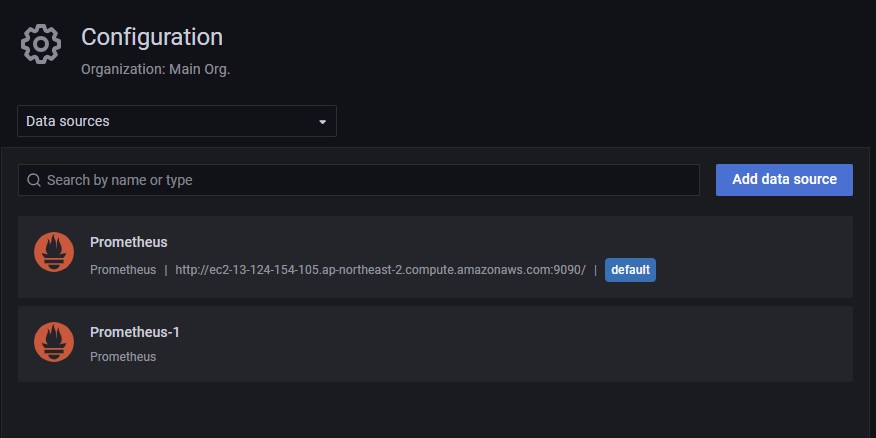
우측 상단의 Add data source를 누르자.
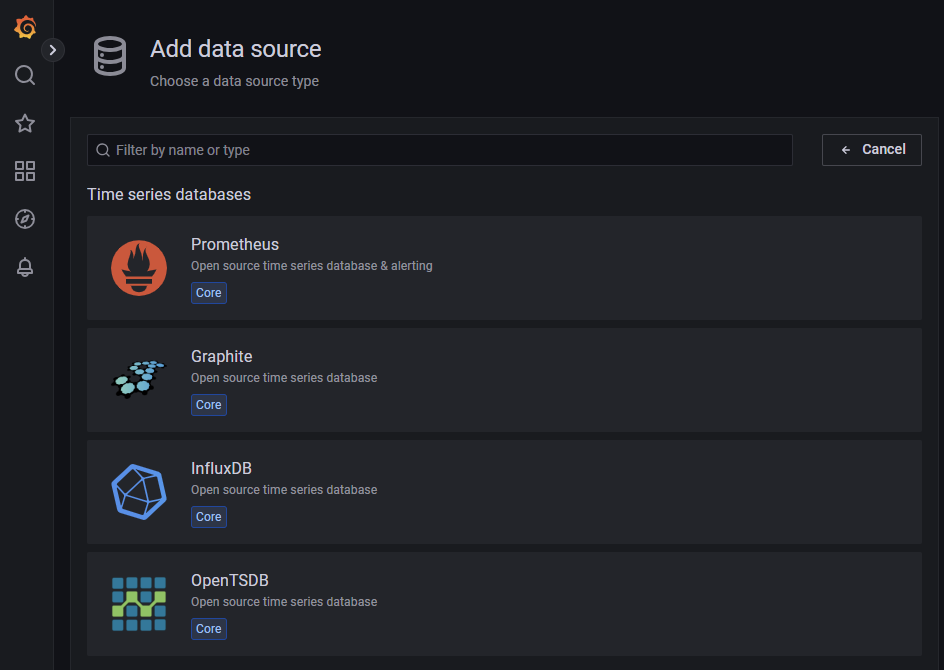
Prometheus와 연결할 것이므로 Prometheus를 선택한다.
- Name 지정
- HTTP
- URL:
(public_IPv4_DNS):9090/
나머지는 기본 설정으로 두고,Save & test버튼을 누른다.
- URL:
Dashboard 설정
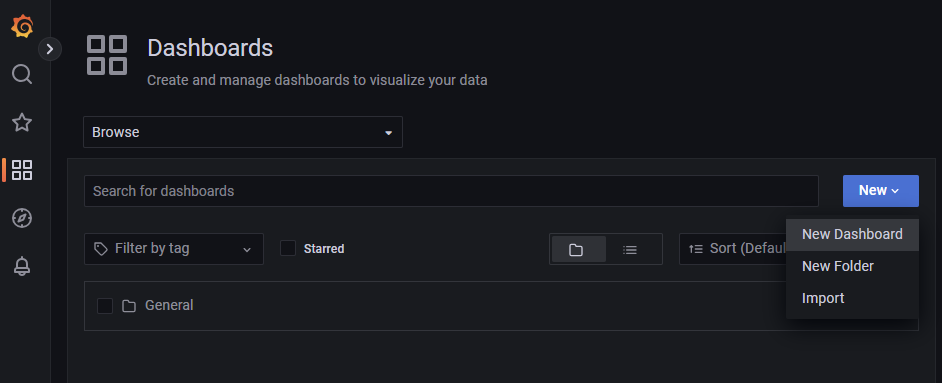
좌측 메뉴에서 Dashboard를 누른다.
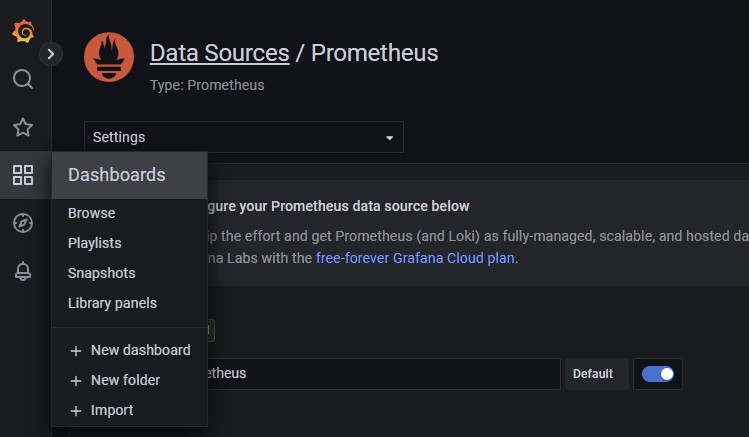
New → Import로 들어간다.
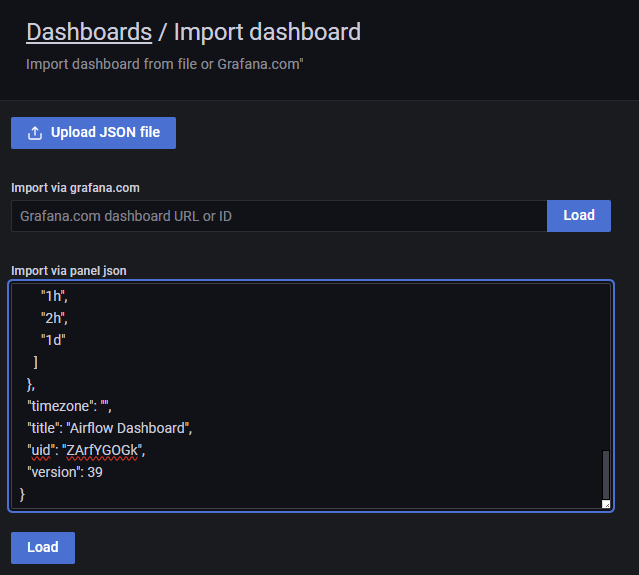
다음과 같은 화면에서 Import via panel json에 이 링크의 json 파일을 복사 붙여넣기해준 뒤, Load 버튼을 눌러준다.
prometheus를 이용해 airflow를 모니터링하는 json 파일을 import했다. 그러면 다음과 같이, dashboard를 직접 구성하지 않아도 예쁘게 시각화해준다.
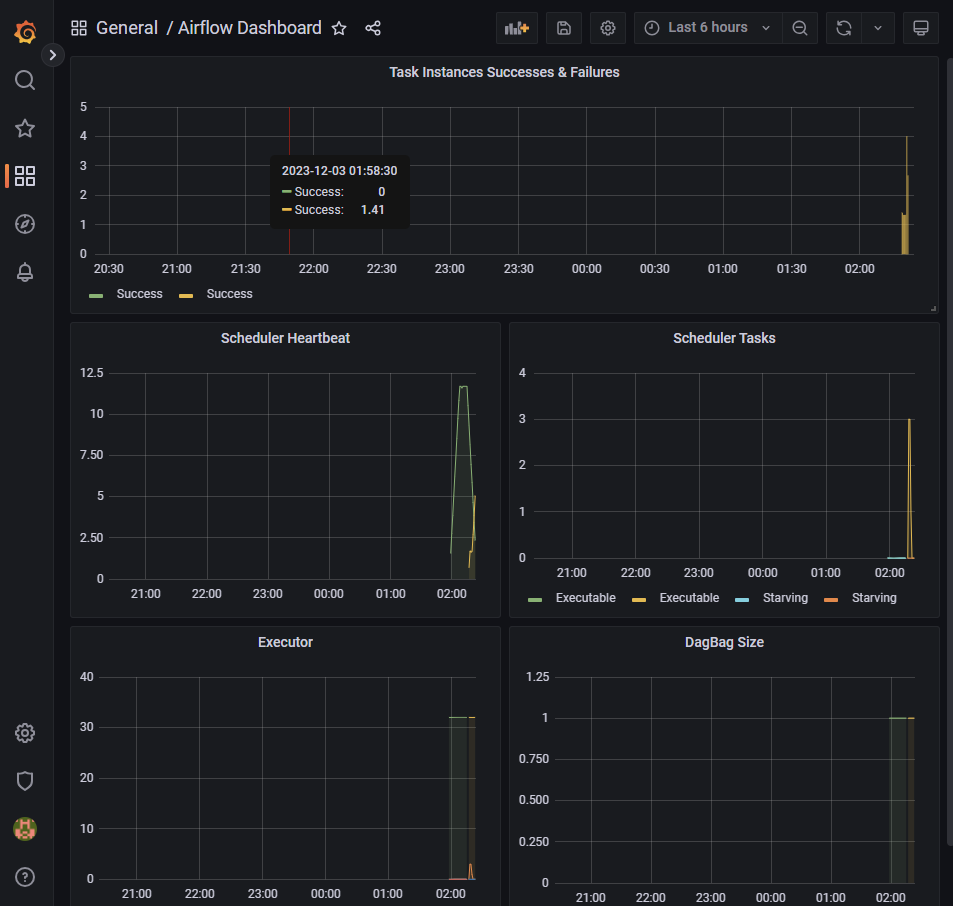
이로써 Airflow에서 보내는 metric을 statsd_exporter를 이용해 prometheus metric으로 변환하고, prometheus와 연결하여 모니터링하고, grafana와까지 연결해봤다.


대한민국 데이터 엔지니어링의 미래가 여기 있네요! 도움이 많이 되었습니다~!~! 😆😆