서버에 부하테스트 시작. EC2를 열어서 부하테스트를 하기 시작했다. 역시나 처음부터 덜그럭 덜그럭 에러에 난리였지만, 이겨내고 부하테스트를 실시했다.
기본코드
/** 공연 예매 최적화 후**/
router.post('/reservation/:showId', authMiddleware, async (req, res, next) => {
  let transaction;
  try {
    const { showId } = req.params;
    const { userId } = req.user;

    transaction = await prisma.$transaction(
      async (tx) => {
        const user = await tx.users.findFirst({
          where: { userId: +userId },
          select: { userId: true, credit: true },
        });

        if (!user) {
          throw new Error('유저 정보를 찾을 수 없습니다.');
        }

        await tx.$queryRaw`SELECT * FROM Shows FOR UPDATE;`;

        let updatedShow = await prisma.shows.findFirst({
          where: { showId: +showId },
          select: { price: true, quantity: true },
        });

        if (user.credit < updatedShow.price || user.credit === 0) {
          throw new Error('credit이 부족합니다.');
        }

        await tx.$executeRaw`UPDATE Users SET credit = credit - ${updatedShow.price} WHERE userId=${userId};`;

        if (updatedShow.quantity <= 0) {
          throw new Error('예매 수량이 부족합니다.');
        }

        await tx.$executeRaw`UPDATE Shows SET quantity = quantity-1 WHERE showId=${showId};`;

        await tx.$executeRaw`INSERT INTO Reservation(UserId, ShowId) VALUES (${user.userId}, ${showId});`;
      },
      {
        isolationLevel: Prisma.TransactionIsolationLevel.ReadCommitted,
        timeout: 1000,
      },
    );
    return res.status(200).json({ message: '좌석 예매가 완료되었습니다.' });
  } catch (error) {
    // console.log(`catch로 빠진 ${error}`);
    //if문 추가
    if (
      error instanceof PrismaClientKnownRequestError &&
      error.code === 'P2028'
    ) {
      console.error('PrismaClientKnownRequestError, P2028 에러발생');
    }
    next(error);
  }
});
test 1. duration 1, arrivalRate 1, timeout 1000ms, 더미 1인
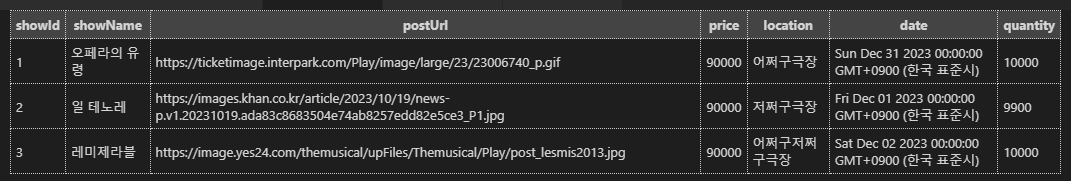 10,000장 중 100장 소모
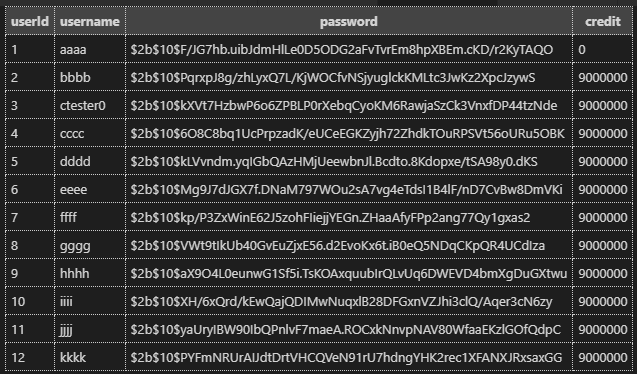
 100장 구매가능한 금액 소진
 100장 매
duration 1, arriaval 1인데 100개가 예매되는게 맞는건가..?
test 2. duration 1, arrivalRate 1, timeout 1000ms, 더미 10인
1인당 100장씩 구매 가능 10명 준비
1000장이 나갈까?
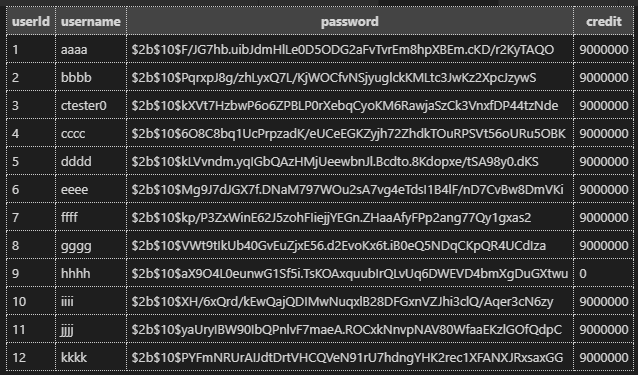

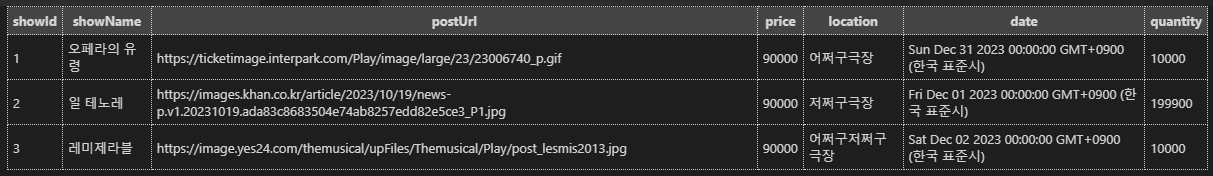
(혹시 몰라서 티켓 수량을 200000개로 조정했었음)
한 사용자만 100장을 구매했다.
그 말은 1초에 1번의 응답을 보내는데 표를 한 사람(1*1)이 사는 시나리오였던것.
test 3. duration 10, arrivalRate 1, timeout 1000ms, 더미 10인
10명의 가상 사용자를 만들어서 후딱 될 줄 알았는데 2분 이상 400이 계속 떠서 테스트를 중단했다.
$ artillery.cmd run --output report.json ./artillery_script/scenario_1.yaml
Test run id: tjwb8_7brehbqh3crzxqkrdkm8grkbftm3x_pwh8
Phase started: Warm up (index: 0, duration: 10s) 09:05:43(+0900)

Phase completed: Warm up (index: 0, duration: 10s) 09:05:53(+0900)

--------------------------------------
Metrics for period to: 09:05:50(+0900) (width: 5.533s)
--------------------------------------

http.codes.200: ................................................................ 37
http.codes.400: ................................................................ 280
http.downloaded_bytes: ......................................................... 2053
http.request_rate: ............................................................. 58/sec
http.requests: ................................................................. 323
http.response_time:
  min: ......................................................................... 8
  max: ......................................................................... 647
  mean: ........................................................................ 50.5
  median: ...................................................................... 16.9
  p95: ......................................................................... 295.9
  p99: ......................................................................... 432.7
http.responses: ................................................................ 317
vusers.created: ................................................................ 6
vusers.created_by_name.예매: ..................................................... 6


--------------------------------------
Metrics for period to: 09:06:00(+0900) (width: 9.963s)
--------------------------------------

http.codes.200: ................................................................ 47
http.codes.400: ................................................................ 590
http.downloaded_bytes: ......................................................... 2491
http.request_rate: ............................................................. 64/sec
http.requests: ................................................................. 641
http.response_time:
  min: ......................................................................... 9
  max: ......................................................................... 1317
  mean: ........................................................................ 82.9
  median: ...................................................................... 30.9
  p95: ......................................................................... 645.6
  p99: ......................................................................... 742.6
http.responses: ................................................................ 637
vusers.created: ................................................................ 4
vusers.created_by_name.예매: ..................................................... 4


--------------------------------------
Metrics for period to: 09:06:10(+0900) (width: 9.985s)
--------------------------------------

errors.ETIMEDOUT: .............................................................. 6
http.codes.200: ................................................................ 53
http.codes.400: ................................................................ 569
http.downloaded_bytes: ......................................................... 2809
http.request_rate: ............................................................. 62/sec
http.requests: ................................................................. 621
http.response_time:
  min: ......................................................................... 13
  max: ......................................................................... 1410
  mean: ........................................................................ 64.3
  median: ...................................................................... 32.1
  p95: ......................................................................... 340.4
  p99: ......................................................................... 407.5
http.responses: ................................................................ 622
vusers.failed: ................................................................. 6


--------------------------------------
Metrics for period to: 09:06:20(+0900) (width: 9.998s)
--------------------------------------

http.codes.200: ................................................................ 24
http.codes.400: ................................................................ 727
http.downloaded_bytes: ......................................................... 1272
http.request_rate: ............................................................. 75/sec
http.requests: ................................................................. 752
http.response_time:
  min: ......................................................................... 8
  max: ......................................................................... 399
  mean: ........................................................................ 35.9
  median: ...................................................................... 23.8
  p95: ......................................................................... 56.3
  p99: ......................................................................... 327.1
http.responses: ................................................................ 751


--------------------------------------
Metrics for period to: 09:06:30(+0900) (width: 9.987s)
--------------------------------------

errors.ETIMEDOUT: .............................................................. 2
http.codes.400: ................................................................ 783
http.downloaded_bytes: ......................................................... 0
http.request_rate: ............................................................. 78/sec
http.requests: ................................................................. 783
http.response_time:
  min: ......................................................................... 8
  max: ......................................................................... 109
  mean: ........................................................................ 24.1
  median: ...................................................................... 22
  p95: ......................................................................... 37
  p99: ......................................................................... 71.5
http.responses: ................................................................ 783
vusers.failed: ................................................................. 2


--------------------------------------
Metrics for period to: 09:06:40(+0900) (width: 9.992s)
--------------------------------------

http.codes.400: ................................................................ 810
http.downloaded_bytes: ......................................................... 0
http.request_rate: ............................................................. 81/sec
http.requests: ................................................................. 810
http.response_time:
  min: ......................................................................... 8
  max: ......................................................................... 399
  mean: ........................................................................ 23.2
  median: ...................................................................... 21.1
  p95: ......................................................................... 32.1
  p99: ......................................................................... 62.2
http.responses: ................................................................ 810


--------------------------------------
Metrics for period to: 09:06:50(+0900) (width: 9.993s)
--------------------------------------

http.codes.400: ................................................................ 812
http.downloaded_bytes: ......................................................... 0
http.request_rate: ............................................................. 81/sec
http.requests: ................................................................. 812
http.response_time:
  min: ......................................................................... 8
  max: ......................................................................... 425
  mean: ........................................................................ 23.1
  median: ...................................................................... 21.1
  p95: ......................................................................... 32.1
  p99: ......................................................................... 67.4
http.responses: ................................................................ 812


--------------------------------------
Metrics for period to: 09:07:00(+0900) (width: 9.968s)
--------------------------------------

http.codes.400: ................................................................ 889
http.downloaded_bytes: ......................................................... 0
http.request_rate: ............................................................. 89/sec
http.requests: ................................................................. 889
http.response_time:
  min: ......................................................................... 8
  max: ......................................................................... 75
  mean: ........................................................................ 21.1
  median: ...................................................................... 19.9
  p95: ......................................................................... 27.9
  p99: ......................................................................... 58.6
http.responses: ................................................................ 889


--------------------------------------
Metrics for period to: 09:07:10(+0900) (width: 9.969s)
--------------------------------------

http.codes.400: ................................................................ 874
http.downloaded_bytes: ......................................................... 0
http.request_rate: ............................................................. 88/sec
http.requests: ................................................................. 874
http.response_time:
  min: ......................................................................... 8
  max: ......................................................................... 84
  mean: ........................................................................ 21.5
  median: ...................................................................... 19.9
  p95: ......................................................................... 29.1
  p99: ......................................................................... 67.4
http.responses: ................................................................ 874


--------------------------------------
Metrics for period to: 09:07:20(+0900) (width: 9.977s)
--------------------------------------

http.codes.400: ................................................................ 887
http.downloaded_bytes: ......................................................... 0
http.request_rate: ............................................................. 89/sec
http.requests: ................................................................. 887
http.response_time:
  min: ......................................................................... 8
  max: ......................................................................... 97
  mean: ........................................................................ 21
  median: ...................................................................... 19.9
  p95: ......................................................................... 27.9
  p99: ......................................................................... 63.4
http.responses: ................................................................ 887


--------------------------------------
Metrics for period to: 09:07:30(+0900) (width: 9.993s)
--------------------------------------

http.codes.400: ................................................................ 902
http.downloaded_bytes: ......................................................... 0
http.request_rate: ............................................................. 90/sec
http.requests: ................................................................. 901
http.response_time:
  min: ......................................................................... 8
  max: ......................................................................... 80
  mean: ........................................................................ 20.8
  median: ...................................................................... 19.9
  p95: ......................................................................... 27.9
  p99: ......................................................................... 58.6
http.responses: ................................................................ 902


--------------------------------------
Metrics for period to: 09:07:40(+0900) (width: 9.999s)
--------------------------------------

http.codes.400: ................................................................ 897
http.downloaded_bytes: ......................................................... 0
http.request_rate: ............................................................. 90/sec
http.requests: ................................................................. 898
http.response_time:
  min: ......................................................................... 8
  max: ......................................................................... 86
  mean: ........................................................................ 20.9
  median: ...................................................................... 19.9
  p95: ......................................................................... 27.9
  p99: ......................................................................... 61
http.responses: ................................................................ 897


--------------------------------------
Metrics for period to: 09:07:50(+0900) (width: 9.98s)
--------------------------------------

http.codes.400: ................................................................ 748
http.downloaded_bytes: ......................................................... 0
http.request_rate: ............................................................. 75/sec
http.requests: ................................................................. 748
http.response_time:
  min: ......................................................................... 7
  max: ......................................................................... 111
  mean: ........................................................................ 25.2
  median: ...................................................................... 19.9
  p95: ......................................................................... 61
  p99: ......................................................................... 96.6
http.responses: ................................................................ 748


--------------------------------------
Metrics for period to: 09:08:00(+0900) (width: 9.994s)
--------------------------------------

http.codes.400: ................................................................ 815
http.downloaded_bytes: ......................................................... 0
http.request_rate: ............................................................. 82/sec
http.requests: ................................................................. 814
http.response_time:
  min: ......................................................................... 8
  max: ......................................................................... 305
  mean: ........................................................................ 23.2
  median: ...................................................................... 19.9
  p95: ......................................................................... 46.1
  p99: ......................................................................... 74.4
http.responses: ................................................................ 815


--------------------------------------
Metrics for period to: 09:08:10(+0900) (width: 9.998s)
--------------------------------------

http.codes.400: ................................................................ 887
http.downloaded_bytes: ......................................................... 0
http.request_rate: ............................................................. 89/sec
http.requests: ................................................................. 888
http.response_time:
  min: ......................................................................... 10
  max: ......................................................................... 101
  mean: ........................................................................ 21.2
  median: ...................................................................... 19.9
  p95: ......................................................................... 26.8
  p99: ......................................................................... 63.4
http.responses: ................................................................ 887


--------------------------------------
Metrics for period to: 09:08:20(+0900) (width: 9.973s)
--------------------------------------

http.codes.400: ................................................................ 816
http.downloaded_bytes: ......................................................... 0
http.request_rate: ............................................................. 82/sec
http.requests: ................................................................. 816
http.response_time:
  min: ......................................................................... 8
  max: ......................................................................... 462
  mean: ........................................................................ 23.1
  median: ...................................................................... 21.1
  p95: ......................................................................... 30.3
  p99: ......................................................................... 68.7
http.responses: ................................................................ 816


--------------------------------------
Metrics for period to: 09:08:30(+0900) (width: 9.988s)
--------------------------------------

http.codes.400: ................................................................ 833
http.downloaded_bytes: ......................................................... 0
http.request_rate: ............................................................. 83/sec
http.requests: ................................................................. 833
http.response_time:
  min: ......................................................................... 9
  max: ......................................................................... 452
  mean: ........................................................................ 22.6
  median: ...................................................................... 19.9
  p95: ......................................................................... 29.1
  p99: ......................................................................... 67.4
http.responses: ................................................................ 833


--------------------------------------
Metrics for period to: 09:08:40(+0900) (width: 9.983s)
--------------------------------------

http.codes.400: ................................................................ 891
http.downloaded_bytes: ......................................................... 0
http.request_rate: ............................................................. 89/sec
http.requests: ................................................................. 890
http.response_time:
  min: ......................................................................... 8
  max: ......................................................................... 96
  mean: ........................................................................ 21
  median: ...................................................................... 19.9
  p95: ......................................................................... 26.8
  p99: ......................................................................... 73
http.responses: ................................................................ 891


--------------------------------------
Metrics for period to: 09:08:50(+0900) (width: 9.985s)
--------------------------------------

http.codes.400: ................................................................ 884
http.downloaded_bytes: ......................................................... 0
http.request_rate: ............................................................. 89/sec
http.requests: ................................................................. 885
http.response_time:
  min: ......................................................................... 9
  max: ......................................................................... 81
  mean: ........................................................................ 21.2
  median: ...................................................................... 19.9
  p95: ......................................................................... 27.9
  p99: ......................................................................... 62.2
http.responses: ................................................................ 884


--------------------------------------
Metrics for period to: 09:09:00(+0900) (width: 9.982s)
--------------------------------------

http.codes.400: ................................................................ 887
http.downloaded_bytes: ......................................................... 0
http.request_rate: ............................................................. 89/sec
http.requests: ................................................................. 887
http.response_time:
  min: ......................................................................... 8
  max: ......................................................................... 101
  mean: ........................................................................ 21.1
  median: ...................................................................... 19.9
  p95: ......................................................................... 27.9
  p99: ......................................................................... 62.2
http.responses: ................................................................ 887


--------------------------------------
Metrics for period to: 09:09:10(+0900) (width: 9.977s)
--------------------------------------

http.codes.400: ................................................................ 869
http.downloaded_bytes: ......................................................... 0
http.request_rate: ............................................................. 87/sec
http.requests: ................................................................. 869
http.response_time:
  min: ......................................................................... 8
  max: ......................................................................... 113
  mean: ........................................................................ 21.5
  median: ...................................................................... 19.9
  p95: ......................................................................... 27.9
  p99: ......................................................................... 71.5
http.responses: ................................................................ 869


--------------------------------------
Metrics for period to: 09:09:20(+0900) (width: 9.998s)
--------------------------------------

http.codes.400: ................................................................ 894
http.downloaded_bytes: ......................................................... 0
http.request_rate: ............................................................. 89/sec
http.requests: ................................................................. 893
http.response_time:
  min: ......................................................................... 8
  max: ......................................................................... 87
  mean: ........................................................................ 20.9
  median: ...................................................................... 19.9
  p95: ......................................................................... 27.9
  p99: ......................................................................... 59.7
http.responses: ................................................................ 894


--------------------------------------
Metrics for period to: 09:09:30(+0900) (width: 9.99s)
--------------------------------------

http.codes.400: ................................................................ 886
http.downloaded_bytes: ......................................................... 0
http.request_rate: ............................................................. 89/sec
http.requests: ................................................................. 887
http.response_time:
  min: ......................................................................... 8
  max: ......................................................................... 106
  mean: ........................................................................ 21.3
  median: ...................................................................... 19.9
  p95: ......................................................................... 27.9
  p99: ......................................................................... 61
http.responses: ................................................................ 886


--------------------------------------
Metrics for period to: 09:09:40(+0900) (width: 9.987s)
--------------------------------------

http.codes.400: ................................................................ 887
http.downloaded_bytes: ......................................................... 0
http.request_rate: ............................................................. 89/sec
http.requests: ................................................................. 887
http.response_time:
  min: ......................................................................... 9
  max: ......................................................................... 114
  mean: ........................................................................ 21.3
  median: ...................................................................... 19.9
  p95: ......................................................................... 26.8
  p99: ......................................................................... 66
http.responses: ................................................................ 887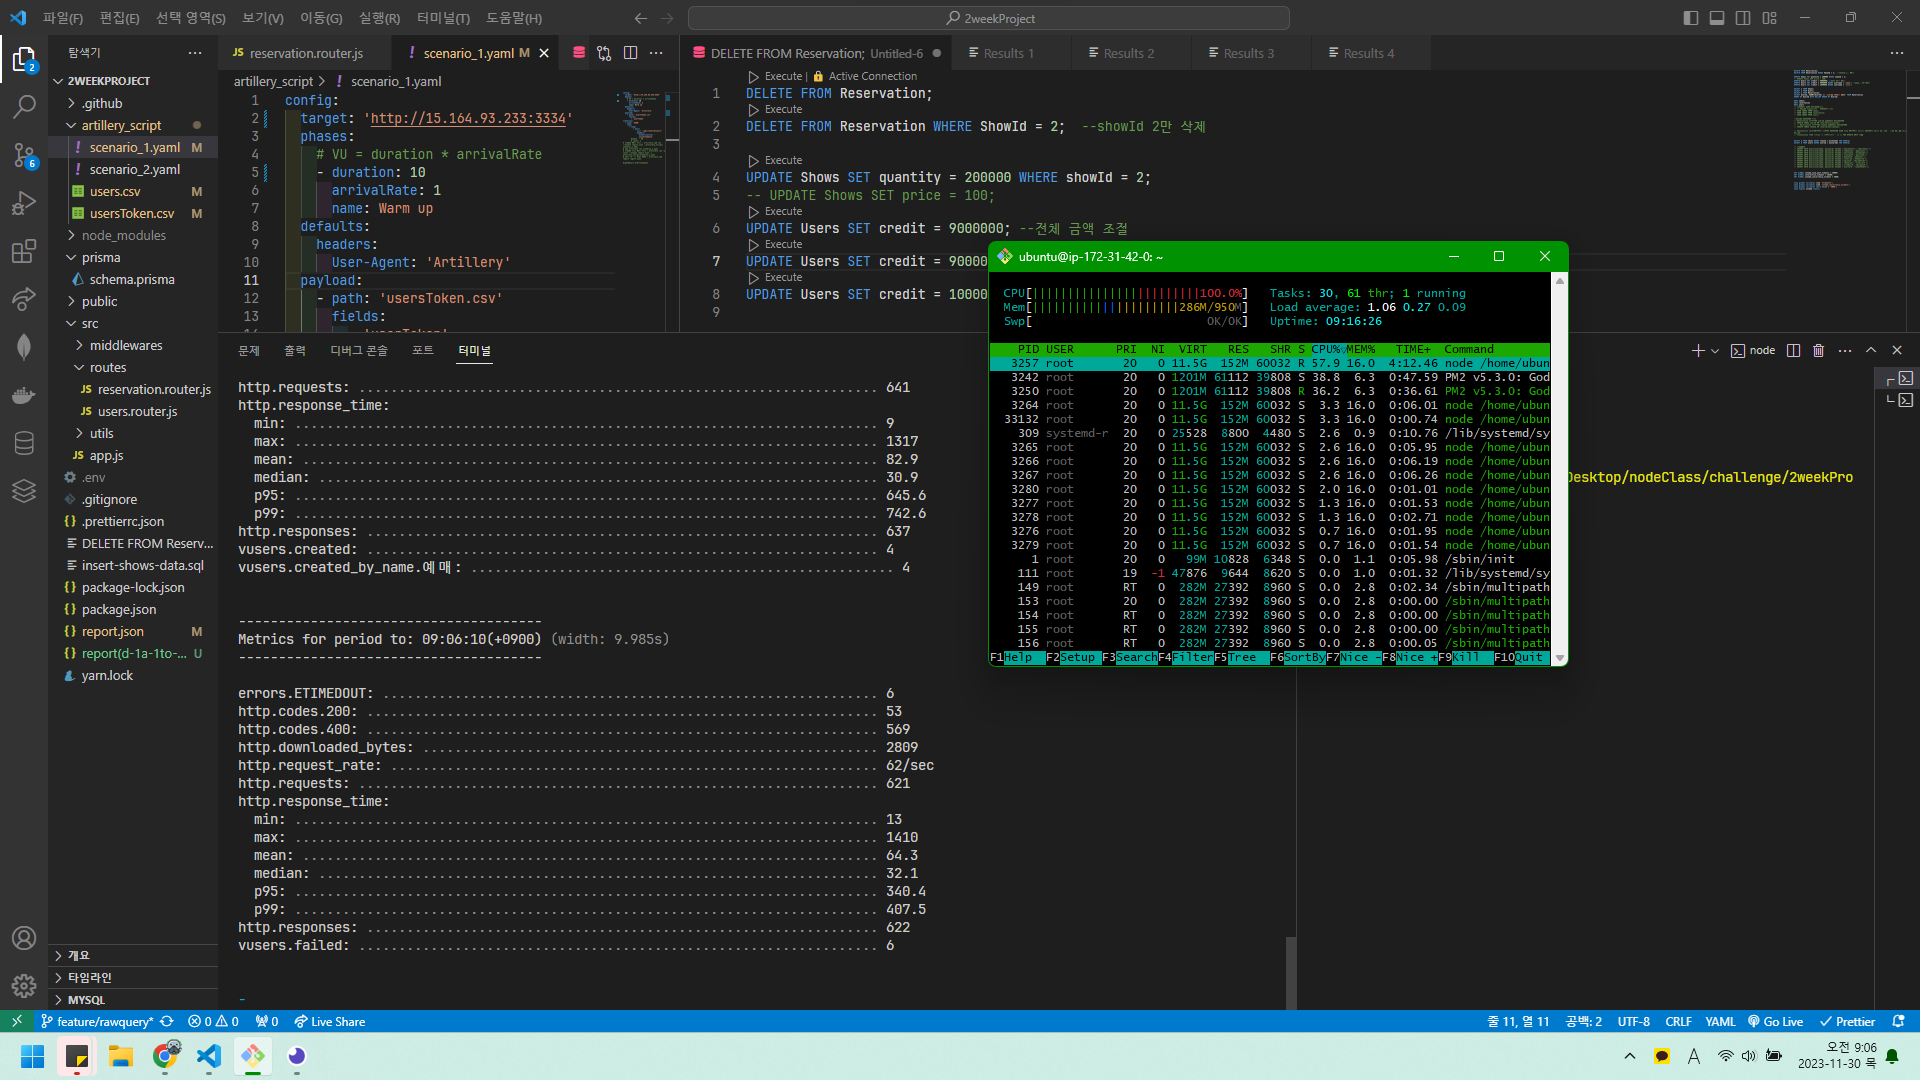
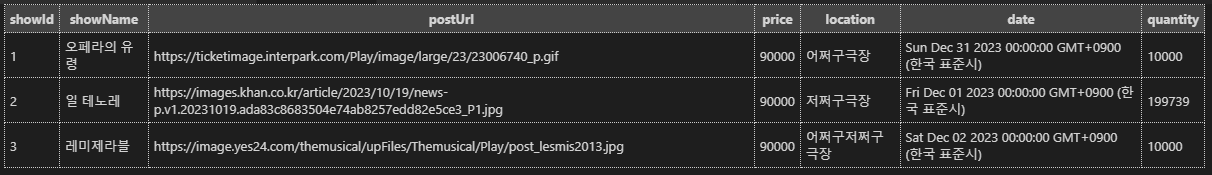
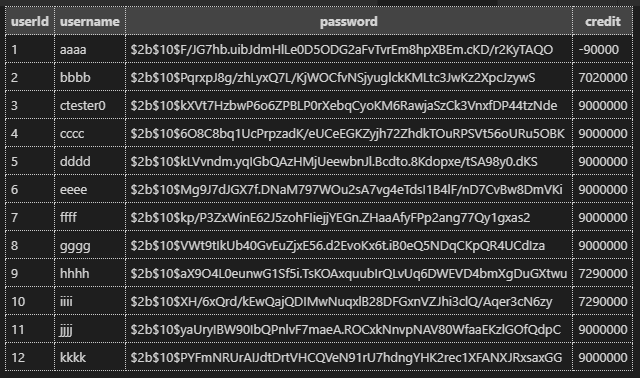
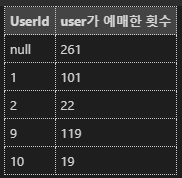
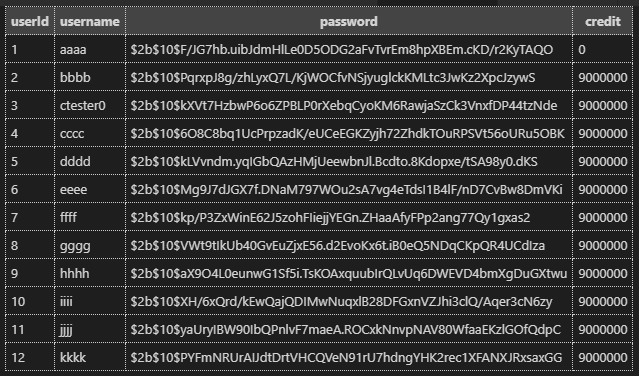
표 수량 261매 예매되었고, user에서는 산발적으로 구매하기 시작함. reservation 예매 건수는 261건으로 표 수량과 일치한다.
왜 이런 현상이 발생하는건가!
사실 로컬에서 돌렸을때도 사용자가 차례대로 구매하는것이 아니라 랜덤으로 구매되는 일이 발생하여 1인 더미데이터를 돌린바 있다. 그래서 다시 1인 더미 데이터로 간다.
test 4. duration 10, arrivalRate 1, timeout 1000ms, 더미 1인
--------------------------------
Summary report @ 09:24:07(+0900)
--------------------------------

errors.ETIMEDOUT: .............................................................. 10
http.codes.200: ................................................................ 100
http.downloaded_bytes: ......................................................... 5300
http.request_rate: ............................................................. 11/sec
http.requests: ................................................................. 110
http.response_time:
  min: ......................................................................... 40
  max: ......................................................................... 1044
  mean: ........................................................................ 85.7
  median: ...................................................................... 71.5
  p95: ......................................................................... 122.7
  p99: ......................................................................... 153
http.responses: ................................................................ 100
vusers.created: ................................................................ 10
vusers.created_by_name.예매: ..................................................... 10
vusers.failed: ................................................................. 10
Log file: report.json

왜 200상태코드가 100이고, timeout은 10이 뜨는거지?
내가 알고있는대로라면 200은 10개 떠야 맞는데..
test 5. duration 10, arrivalRate 2, timeout 1000ms, 더미 1인
--------------------------------
Summary report @ 09:35:56(+0900)
--------------------------------

errors.ETIMEDOUT: .............................................................. 20
http.codes.200: ................................................................ 100
http.downloaded_bytes: ......................................................... 5300
http.request_rate: ............................................................. 8/sec
http.requests: ................................................................. 120
http.response_time:
  min: ......................................................................... 53
  max: ......................................................................... 1392
  mean: ........................................................................ 153.4
  median: ...................................................................... 67.4
  p95: ......................................................................... 507.8
  p99: ......................................................................... 1176.4
http.responses: ................................................................ 100
vusers.created: ................................................................ 20
vusers.created_by_name.예매: ..................................................... 20
vusers.failed: ................................................................. 20
Log file: report.json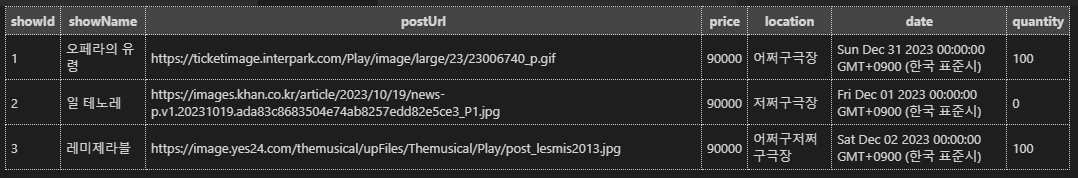

test 6. duration 50, arrivalRate 2, timeout 1000ms, 더미 1인
All VUs finished. Total time: 1 minute, 0 seconds

--------------------------------
Summary report @ 09:44:04(+0900)
--------------------------------

errors.ETIMEDOUT: .............................................................. 100
http.codes.200: ................................................................ 100
http.downloaded_bytes: ......................................................... 5300
http.request_rate: ............................................................. 4/sec
http.requests: ................................................................. 200
http.response_time:
  min: ......................................................................... 50
  max: ......................................................................... 1084
  mean: ........................................................................ 163.2
  median: ...................................................................... 108.9
  p95: ......................................................................... 257.3
  p99: ......................................................................... 1085.9
http.responses: ................................................................ 100
vusers.created: ................................................................ 100
vusers.created_by_name.예매: ..................................................... 100
vusers.failed: ................................................................. 100
Log file: report.json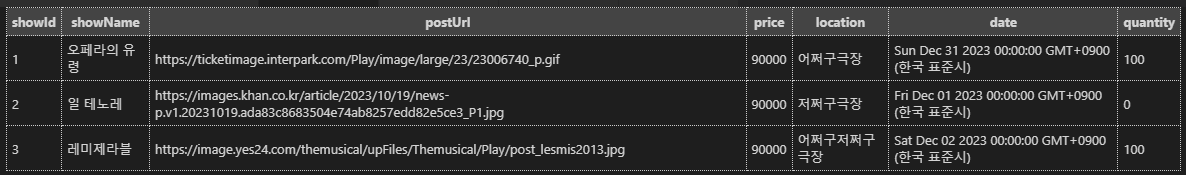
왜 200상태코드가 100이 뜨는지 알았다.
config:
  # target: 'http://15.164.93.233:3334'
  target: 'http://127.0.0.1:3334'
  phases:
    # VU = duration * arrivalRate
    - duration: 1
      arrivalRate: 1
      name: Warm up
  defaults:
    headers:
      User-Agent: 'Artillery'
  payload:
    - path: 'usersToken.csv'
      fields:
        - 'userToken'
scenarios:
  - name: '예매'
    flow:
      - loop:
          - post:
              url: '/api/reservation/2'
              headers:
                Authorization: '{{userToken}}'
        #1인당 몇 번 할지
        #이 녀석 때문이었다. count
        count: 1
count를 안써주면 자동으로 1이 들어가는줄 알았다. 그렇지만 그런게 아니었음을...
count는 굳이 안써줘도 되니까 주석처리를 하고 계속 테스트를 했는데 꼭 적어줘야하는 녀석이었다.
All VUs finished. Total time: 2 seconds

--------------------------------
Summary report @ 11:57:20(+0900)
--------------------------------

http.codes.200: ................................................................ 1
http.downloaded_bytes: ......................................................... 53
http.request_rate: ............................................................. 1/sec
http.requests: ................................................................. 1
http.response_time:
  min: ......................................................................... 103
  max: ......................................................................... 103
  mean: ........................................................................ 103
  median: ...................................................................... 102.5
  p95: ......................................................................... 102.5
  p99: ......................................................................... 102.5
http.responses: ................................................................ 1
vusers.completed: .............................................................. 1
vusers.created: ................................................................ 1
vusers.created_by_name.예매: ..................................................... 1
vusers.failed: ................................................................. 0
vusers.session_length:
  min: ......................................................................... 123
  max: ......................................................................... 123
  mean: ........................................................................ 123
  median: ...................................................................... 122.7
  p95: ......................................................................... 122.7
  p99: ......................................................................... 122.7
Log file: report.json
test 7. duration 20, arrivalRate 4, timeout 1000ms, 더미 1인
All VUs finished. Total time: 30 seconds

--------------------------------
Summary report @ 12:08:12(+0900)
--------------------------------

errors.ETIMEDOUT: .............................................................. 5
http.codes.200: ................................................................ 75
http.downloaded_bytes: ......................................................... 3975
http.request_rate: ............................................................. 2/sec
http.requests: ................................................................. 80
http.response_time:
  min: ......................................................................... 38
  max: ......................................................................... 1123
  mean: ........................................................................ 125.4
  median: ...................................................................... 49.9
  p95: ......................................................................... 632.8
  p99: ......................................................................... 1085.9
http.responses: ................................................................ 75
vusers.completed: .............................................................. 75
vusers.created: ................................................................ 80
vusers.created_by_name.예매: ..................................................... 80
vusers.failed: ................................................................. 5
vusers.session_length:
  min: ......................................................................... 47.2
  max: ......................................................................... 1131.9
  mean: ........................................................................ 136.9
  median: ...................................................................... 62.2
  p95: ......................................................................... 645.6
  p99: ......................................................................... 1107.9
Log file: report.json
본격 서버 부하테스트 전
서버에 돌리는데 문제가 생겼다. artillery로 시나리오를 돌리는데 자꾸 404에러가 뜨는 것이었다.
시나리오, 코드도 다 문제를 살펴봤는데 이상이 없었다.
서버에 이상이 있는건가...사용하고 있는 EC2를 새로 만들어서 다시 해봤는데도 여전히 같은 상황.
chatGPT한테도물어봐도 명쾌한 해답을 얻을 수 없었다. 혹시나 target이나 url이 잘못된걸까? 싶어서 계속 재차 확인했다.
config:
  target: 'http://15.164.93.233:3334'
  phases:
    # VU = duration * arrivalRate
    - duration: 1
      arrivalRate: 1
      name: Warm up
  defaults:
    headers:
      User-Agent: 'Artillery'
  payload:
    - path: 'usersToken.csv'
      fields:
        - 'userToken'
scenarios:
  - name: '예매'
    flow:
      - loop:
          - post:
              url: '/api/reservation/2'
              headers:
                Authorization: '{{userToken}}'
--------------------------------------
Metrics for period to: 01:21:30(+0900) (width: 9.989s)
--------------------------------------
http.codes.404: ................................................................ 1084
http.downloaded_bytes: ......................................................... 166936
http.request_rate: ............................................................. 109/sec
http.requests: ................................................................. 1084
http.response_time:
min: ......................................................................... 6
max: ......................................................................... 391
mean: ........................................................................ 8.6
median: ...................................................................... 7
p95: ......................................................................... 12.1
p99: ......................................................................... 30.3
http.responses: ................................................................ 1084url 주소를 바꿔도 안되더니 다시 처음 url주소로 돌아가니 200이 떴다. 오마이갓. 기가막혀 진짜. USB같은 자식.
처음: '/api/reservation/2'
두번째 : '/getReserv.html?showId=1'
마지막: '/api/reservation/2'
--------------------------------
Summary report @ 01:22:28(+0900)
--------------------------------

errors.ETIMEDOUT: .............................................................. 1
http.codes.200: ................................................................ 10
http.downloaded_bytes: ......................................................... 530
http.request_rate: ............................................................. 6/sec
http.requests: ................................................................. 11
http.response_time:
  min: ......................................................................... 41
  max: ......................................................................... 124
  mean: ........................................................................ 52.9
  median: ...................................................................... 43.4
  p95: ......................................................................... 51.9
  p99: ......................................................................... 51.9
http.responses: ................................................................ 10
vusers.created: ................................................................ 1
vusers.created_by_name.예매: ..................................................... 1
vusers.failed: ................................................................. 1
Log file: report.json
쿼리 로그 안나오게 하기
쿼리 로그를 안나오게 해서 성능을 향상 시킬 수 있다고 들었다.
나는 src 파일에 있는 app.js를 실행시켜 사용중인데 아래와 같은 명령어를 터미널에 적고 실행하니 그때부터 artillery를 실행해도 터미널에 쿼리로그가 안찍힌다.
node ./src/app.js &
원상복구하고 싶어서 기존 코드를 실행해도 원상복구가 안된다.
node ./src/app.js
위대로 했는데 내가 원하는 뭔가를 얻을 수 없었다.
사실 난 프리즈마를 orm로 사용하는데 터미널에 프리즈마 쿼리가 찍히는 것이다.
혹시 프리즈마에서 설정된 값을 바꿔주면 되지 않나? 라며 찾아보니 프로젝트 파일 내에 /src/utils/prisma/index.js 를 열어보면 아래와 같은 코드가 있는데 이때 이 코드때문에 log가 찍히는 것이었다.
import { PrismaClient } from '@prisma/client';

export const prisma = new PrismaClient({
  log: ['query', 'info', 'warn', 'error'],
.
  errorFormat: 'pretty',
});
그래서 아래와 같이 log의 값에 있는 배열의 내용을 다 지웠다.
import { PrismaClient } from '@prisma/client';

export const prisma = new PrismaClient({
  log: [],
.
  errorFormat: 'pretty',
});
그랬더니 터미널에 프리즈마 쿼리는 안나오고 에러만 표시되었다. 굳.
