- Timestamp : 특정한 시점을 기록
- Period : 두 시점 사이의 일정한 기간을 나타냄
1) 다른 자료형을 시계열 객체로 변환 - Timestamp ver.
import pandas as pd

df = pd.read_csv('./stock-data.csv')
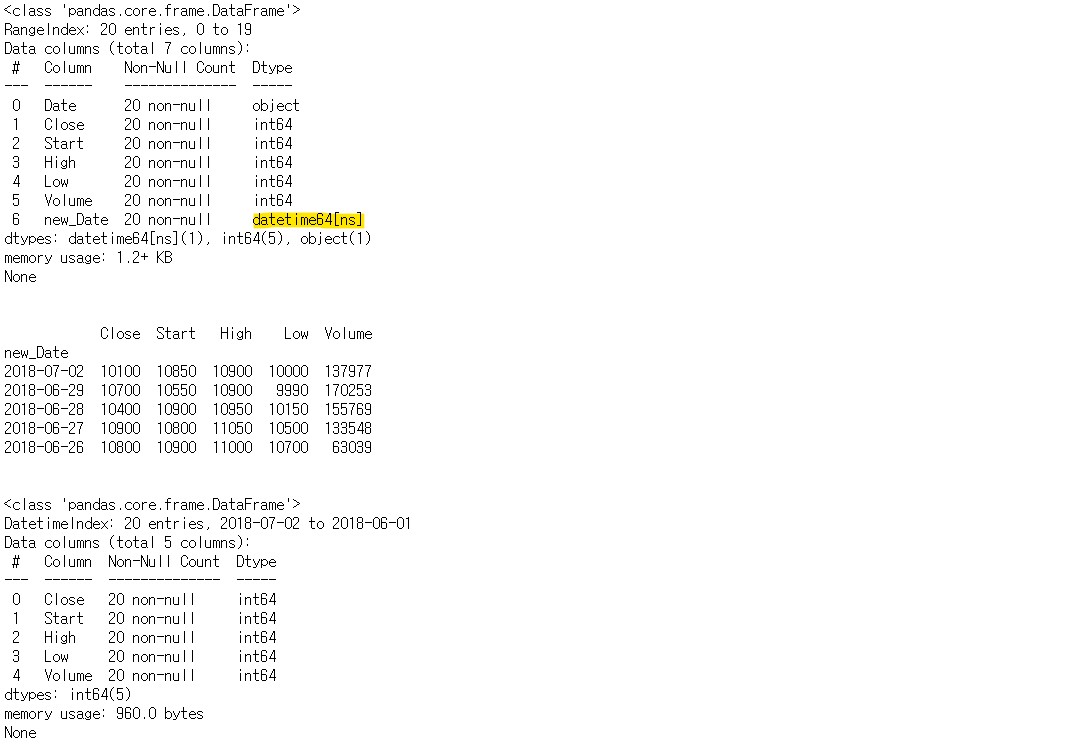
print(df.info())

df['new_Date'] = pd.to_datetime(df['Date'])
# to_datetime을 활용하여 timestamp로 변환

print(df.info())
print('\n')

df.set_index('new_Date', inplace = True)
df.drop('Date', axis = 1, inplace = True)

print(df.head())
print('\n')
print(df.info())

2) 다른 자료형을 시계열 객체로 변환 - Period ver.
import pandas as pd

dates =  ['2019-01-01', '2020-03-01', '2021-06-21']

ts_dates = pd.to_datetime(dates)
print(ts_dates)

pr_day = ts_dates.to_period(freq = 'D')
# freq 옵션이 D인 경우, 1일의 기간
print(pr_day)

pr_month = ts_dates.to_period(freq = 'M')
# freq 옵션이 M인 경우, 1달의 기간
print(pr_month)

pr_year = ts_dates.to_period(freq = 'A')
# freq 옵션이 A인 경우, 1년의 기간
print(pr_year)

3) 시계열 데이터 만들기 - Timestamp 배열
import pandas as pd

ts_ms = pd.date_range(start = '2019-01-01', # 시작일
                     end = None, # 날짜 범위의 끝
                     periods = 6, # 생성할 Timestamp 수
                     freq = 'MS', # 월의 시작일 기준으로 한달 간격
                     tz = 'Asia/Seoul') # 아시아/서울 시간대

print(ts_ms)
print('\n')

ts_m = pd.date_range(start = '2019-01-01', # 시작일
                     periods = 3, # 생성할 Timestamp 수
                     freq = 'M', # 월의 마지막일 기준으로 한달 간격
                     tz = 'Asia/Seoul') # 아시아/서울 시간대

print(ts_m)
print('\n')

ts_3m = pd.date_range(start = '2019-01-01', # 시작일
                     periods = 6, # 생성할 Timestamp 수
                     freq = '3M', # 월의 마지막일 기준으로 3달 간격
                     tz = 'Asia/Seoul') # 아시아/서울 시간대

print(ts_3m)

4) 시계열 데이터 만들기 - Period 배열
import pandas as pd

pr_m = pd.period_range(start = '2019-01-01', # 시작일
                     end = None, # 날짜 범위의 끝
                     periods = 6, # 생성할 Period 수
                     freq = 'M') # 기간의 길이 (월)

print(pr_m)
print('\n')

pr_h = pd.period_range(start = '2019-01-01', # 시작일
                     end = None, # 날짜 범위의 끝
                     periods = 6, # 생성할 Period 수
                     freq = 'H') # 기간의 길이 (시간)

print(pr_h)
print('\n')

pr_2h = pd.period_range(start = '2019-01-01', # 시작일
                     end = None, # 날짜 범위의 끝
                     periods = 6, # 생성할 Period 수
                     freq = '2H') # 기간의 길이 (2시간)

print(pr_2h)

5) 시계열 데이터 활용 - 날짜 데이터 분리
import pandas as pd

df = pd.read_csv('./stock-data.csv')
df['new_Date'] = pd.to_datetime(df['Date'])
# to_datetime을 활용하여 timestamp로 변환

df['Year'] = df['new_Date'].dt.year
# 년도만 분리
df['Month'] = df['new_Date'].dt.month
# 달만 분리
df['Day'] = df['new_Date'].dt.day
# 일만 분리

df['Date_yr'] = df['new_Date'].dt.to_period(freq = 'A')
# 년도만 표기
df['Date_m'] = df['new_Date'].dt.to_period(freq = 'M')
# 년-월 표기

print(df.head())

6) 시계열 데이터 활용 - 날짜 인덱스 활용
import pandas as pd

df = pd.read_csv('./stock-data.csv')
df['new_Date'] = pd.to_datetime(df['Date'])
# to_datetime을 활용하여 timestamp로 변환

df.set_index('new_Date', inplace = True)

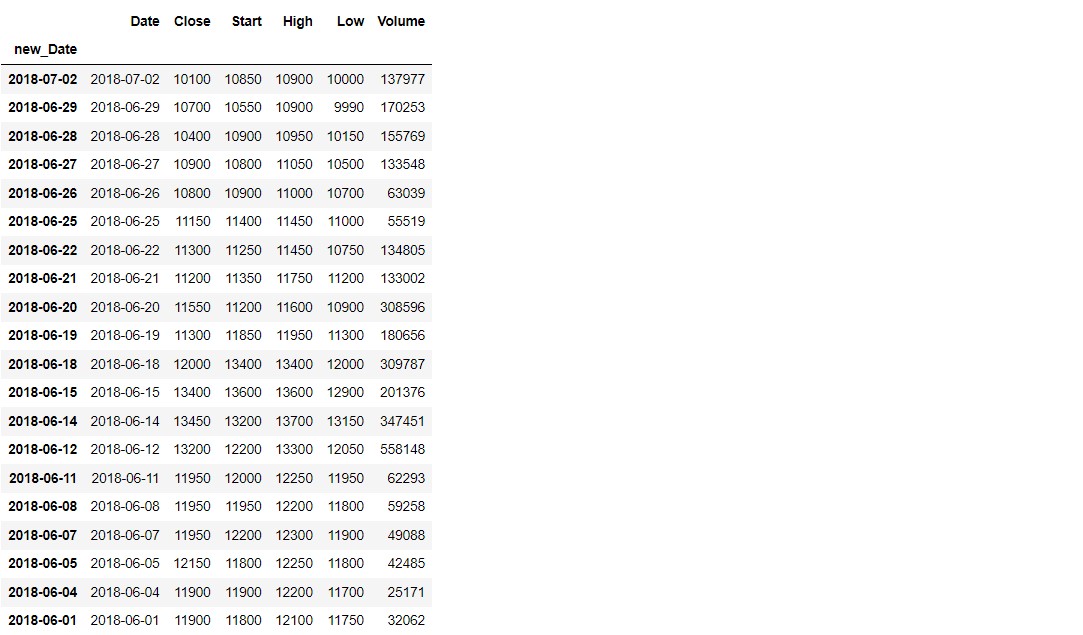
df_2018 = df.loc['2018']
df_2018

df_201807 = df.loc['2018-07']
df_201807

df_ym_cols = df.loc['2018-07', 'Start':'High']
# 2018-07에 해당하는 데이터의 Start 열과 High열 값 추출

print(df_ym_cols)

df_range = df['2018-06-30' : '2018-06-20']
df_range

today = pd.to_datetime('2018-12-25')
# 기준날짜 설정

df['time_delta'] = today - df.index
# 기준 날짜와 각 데이터값의 차이

df.set_index('time_delta', inplace = True)
df_180 = df['180 days':'189 days']
# 차이값이 180일 이상 189일 이하인 값만 추출

print(df_180)


