1. 목표
- Vue.js를 이용하여 6개의 Box Plot을 그려보자.
2. 아이디어
- Table을 이용하여 6개의 구간을 나누어서 Box Plot 6개를 표시하자.
- 추가적으로 Box Plot 오른쪽에 데이터를 점으로 표시
3. 설명
- D3.js에서 box plot을 그리는 과정
- 그래프의 크기와 여백을 설정
- 페이지 body에 svg 컴포넌트 추가
- box plot을 그릴 때 사용할 통계값(사분위값 등) 계산
- Y Scale 표시
- boxplot 그림의 width와 center 설정
- (box plot 그림 시작) 이상 치 최대 값에서 이상 치 최소 값까지 세로 선 추가
- q1 부터 q3까지 네모박스 그리기
- 최소 값, 중앙 값, 최대 값에 가로 선 추가 (box plot 그림 끝)
4. 예제 코드
<template>
<div>
<table>
<tr>
<th>1</th>
<th>2</th>
<th>3</th>
</tr>
<tr>
<td>
<div id="boxplot1"></div>
</td>
<td>
<div id="boxplot2"></div>
</td>
<td>
<div id="boxplot3"></div>
</td>
</tr>
<tr>
<th>4</th>
<th>5</th>
<th>6</th>
</tr>
<tr>
<td>
<div id="boxplot4"></div>
</td>
<td>
<div id="boxplot5"></div>
</td>
<td>
<div id="boxplot6"></div>
</td>
</tr>
</table>
</div>
</template>
<script>
import * as d3 from "d3";
export default {
props: {
boxplot_data: {
type: Object,
required: true,
},
boxplot_data_index: {
type: Number,
required: true,
},
},
methods: {
draw_boxplot(i) {
if (d3.select(`#boxplot${i + 1}`).select("svg")) {
d3.select(`#boxplot${i + 1}`)
.select("svg")
.remove();
}
var margin = { top: 30, right: 0, bottom: 30, left: 30 },
width = 200 - margin.left - margin.right,
height = 200 - margin.top - margin.bottom;
var svg = d3
.select(`#boxplot${i + 1}`)
.append("svg")
.attr("width", width + margin.left + margin.right)
.attr("height", height + margin.top + margin.bottom)
.append("g")
.attr("transform", "translate(" + margin.left + "," + margin.top + ")");
var data = this.boxplot_data[this.boxplot_data_index - 1].map((d) => d[i + 1]);
console.log("data: ", data);
var data_sorted = data.sort(d3.ascending);
var q1 = d3.quantile(data_sorted, 0.25);
var median = d3.quantile(data_sorted, 0.5);
var q3 = d3.quantile(data_sorted, 0.75);
var interQuantileRange = q3 - q1;
var min = q1 - 1.5 * interQuantileRange;
var max = q1 + 1.5 * interQuantileRange;
var y = d3
.scaleLinear()
.domain([min - 3, max + 3])
.range([height, 0]);
svg.call(d3.axisLeft(y));
var center = 70;
var width = 60;
svg.append("line").attr("x1", center).attr("x2", center).attr("y1", y(min)).attr("y2", y(max)).attr("stroke", "black");
svg
.append("rect")
.attr("x", center - width / 2)
.attr("y", y(q3))
.attr("height", y(q1) - y(q3))
.attr("width", width)
.attr("stroke", "black")
.style("fill", "#69b3a2");
svg
.selectAll("toto")
.data([min, median, max])
.enter()
.append("line")
.attr("x1", center - width / 2)
.attr("x2", center + width / 2)
.attr("y1", function (d) {
return y(d);
})
.attr("y2", function (d) {
return y(d);
})
.attr("stroke", "black");
svg
.selectAll("indPoints")
.data(data)
.enter()
.append("circle")
.attr("cx", center + 90)
.attr("cy", function (d) {
return y(d);
})
.attr("r", 4)
.style("fill", "white")
.attr("stroke", "black");
},
},
mounted() {
for (let i = 0; i < 6; i++) {
this.draw_boxplot(i);
}
},
};
</script>
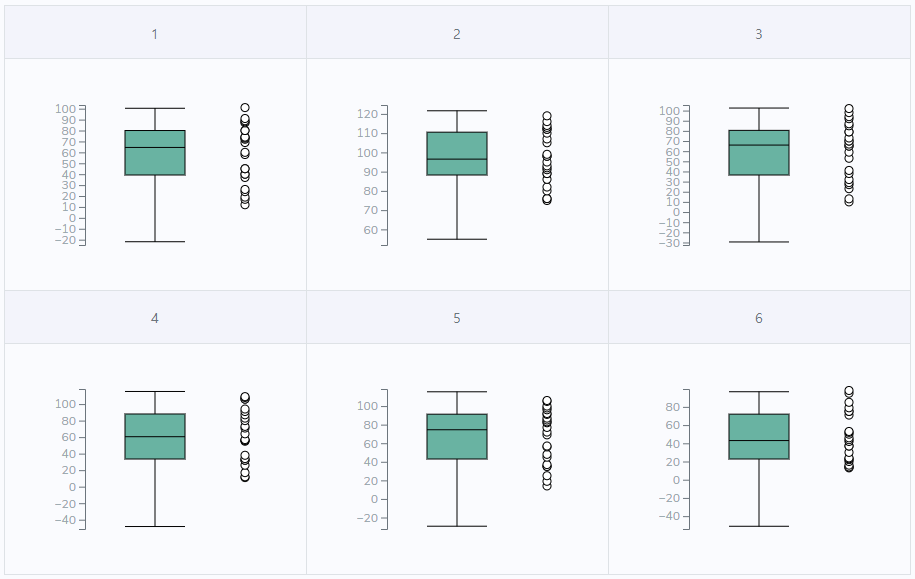
4. 예제 코드 결과물