
🔫 시각화

Spring Boot 의 리소스 부하, 서버 상태 등을 확인 할 필요성을 느끼게 되었다.
서버를 시각화 하기 위해 Prometheus + Grafana 를 사용해 볼 것 이다.
☘️ Actuator 설정
- build.gradle
	implementation 'org.springframework.boot:spring-boot-starter-actuator'
    runtimeOnly 'io.micrometer:micrometer-registry-prometheus'
Spring Web에서 Actuator는 Micrometer를 통해 생성된 애플리케이션의 metric 정보를 Prometheus 서버에서 가져갈 수 있도록 추가적인 endpoint를 제공해준다.
Actuator는 application.yml에 옵션(management.endpoints.web.exposure.include)으로 /actuator 페이지에 노출할 endpoint 목록을 설정할 수 있다.
- application.yml
management:
  endpoints:
    web:
      exposure:
include: health, info, prometheus- http://localhost:9091/actuator 접속 확인
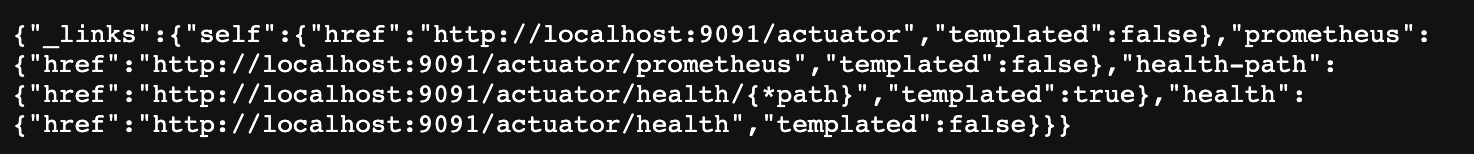
9091 은 본인의 Spring Boot Port 번호 이므로 맞게 수정 하면 된다.
🧨 트러블 슈팅
Actuator 설정을 진행 하다보면 Spring Boot Application 이 실행 되지 않는다.
📄 Config.Class
caused by: java.lang.nullpointerexception: cannot invoke "org.springframework.web.servlet.mvc.condition.patternsrequestcondition.getpatterns()" because "this.condition" is null서버 실행 시에 위와 같은 에러가 발생하며 원인은 actuator 와 swagger 의 충돌 오류인듯 하다.
	@Bean
    public static BeanPostProcessor springfoxHandlerProviderBeanPostProcessor() {
        return new BeanPostProcessor() {

            @Override
            public Object postProcessAfterInitialization(Object bean, String beanName) throws BeansException {
                if (bean instanceof WebMvcRequestHandlerProvider || bean instanceof WebFluxRequestHandlerProvider) {
                    customizeSpringfoxHandlerMappings(getHandlerMappings(bean));
                }
                return bean;
            }

            private <T extends RequestMappingInfoHandlerMapping> void customizeSpringfoxHandlerMappings(List<T> mappings) {
                List<T> copy = mappings.stream()
                        .filter(mapping -> mapping.getPatternParser() == null)
                        .collect(Collectors.toList());
                mappings.clear();
                mappings.addAll(copy);
            }

            @SuppressWarnings("unchecked")
            private List<RequestMappingInfoHandlerMapping> getHandlerMappings(Object bean) {
                try {
                    Field field = ReflectionUtils.findField(bean.getClass(), "handlerMappings");
                    field.setAccessible(true);
                    return (List<RequestMappingInfoHandlerMapping>) field.get(bean);
                } catch (IllegalArgumentException | IllegalAccessException e) {
                    throw new IllegalStateException(e);
                }
            }
        };
    }
코드를 @Configuration 이 설정 되어있는 파일에 적용 시켜 줌으로써 해결했다.
🔥 Prometheus
📄 prometheus.yaml
global:
  scrape_interval: 5s

scrape_configs:
  - job_name: "prometheus"
    static_configs:
      - targets:
          - "localhost:9090"
  - job_name: "springboot"
    metrics_path: "/actuator/prometheus"
    static_configs:
      - targets:
- "host.docker.internal:9091"-
global:scrape_interval : Prometheus가 Metric 정보를 수집하는 주기를 나타낸다. 위의 설정은 5초마다 pull 하게 된다.
-
scrape_configs:job_name : 수행할 작업의 이름을 명시한다.
-
scrape_configs:metrics_path : metric 정보를 가져올 경로를 명시한다.
-
scrape_configs:target : 요청을 보낼 host 정보를 명시한다.
yaml 파일은 본인이 원하는 경로에 만들어 주면 된다.
prometheus docker 컨테이너 실행
docker run -p 9090:9090 -v /Users/mero/prometheus-grafana/prometheus/prometheus.yaml:/etc/prometheus/prometheus.yaml prom/prometheus --config.file=/etc/prometheus/prometheus.yaml

docker run -p 9090:9090 -v "설정 파일 경로":/etc/prometheus/prometheus.yaml prom/prometheus --config.file=/etc/prometheus/prometheus.yaml
실행 확인
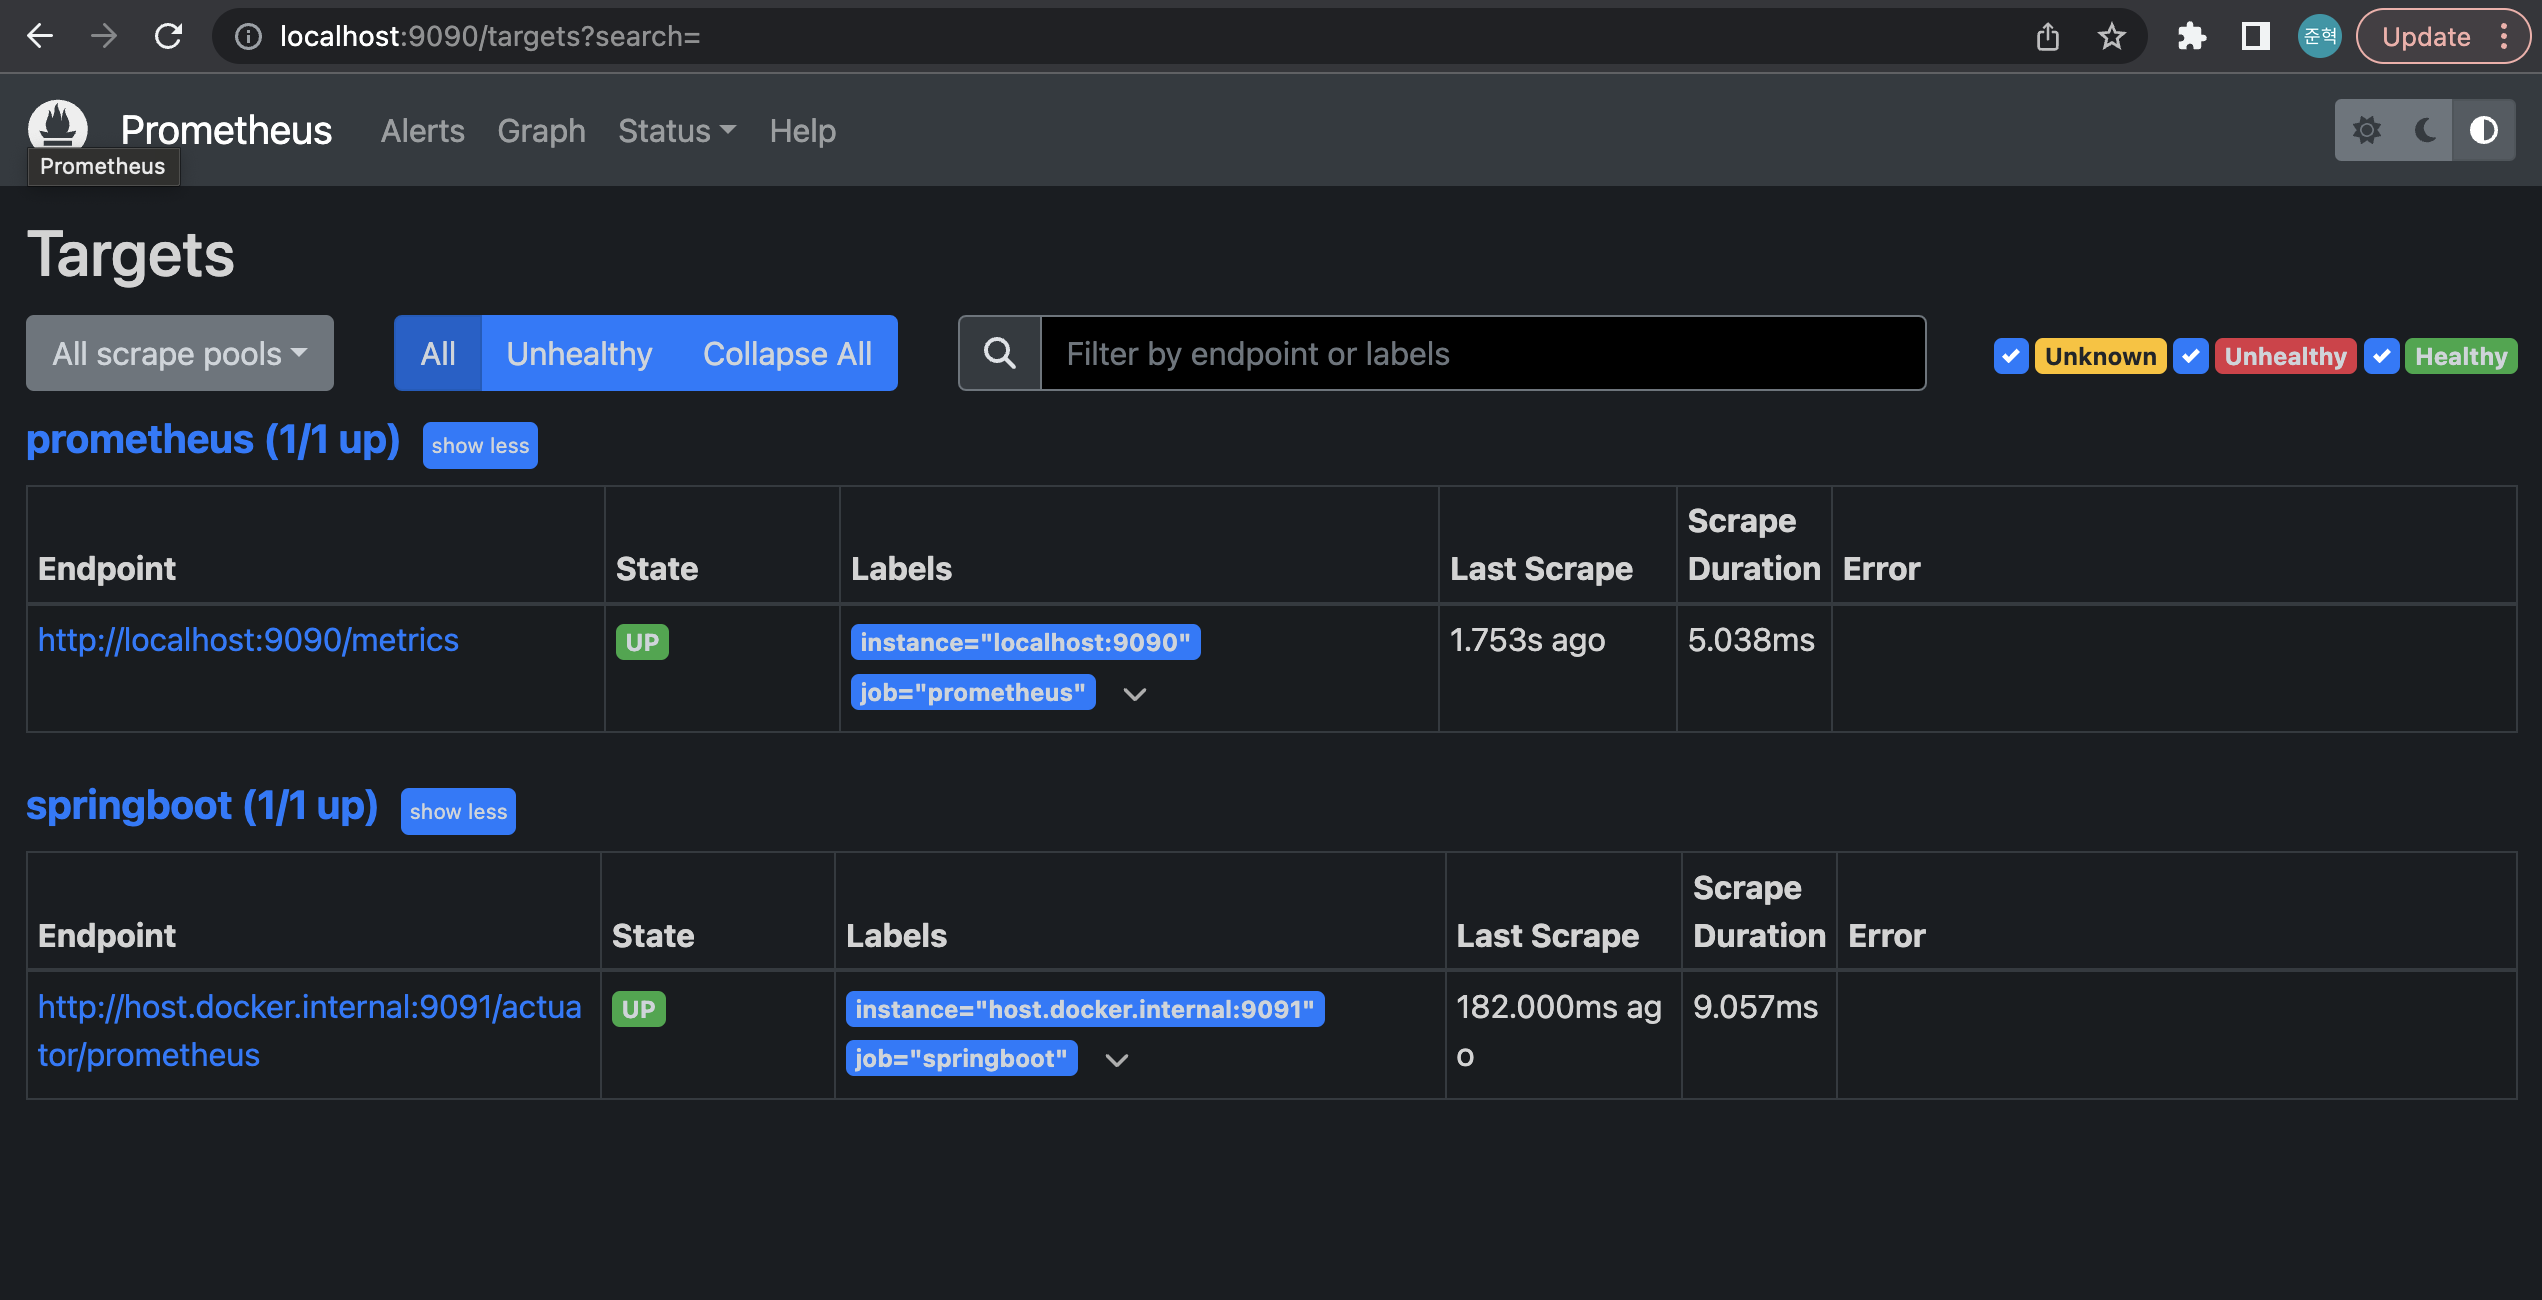
정상적으로 실행을 확인 할 수 있다.
🌁 Grafana
3000번 포트는 React 를 테스트 할때 주로 사용하기에 3001번 포트로 변경하여 Grafana 컨테이너를 실행 했다.
docker run -d -p 3000:3000 --name grafana grafana/grafana
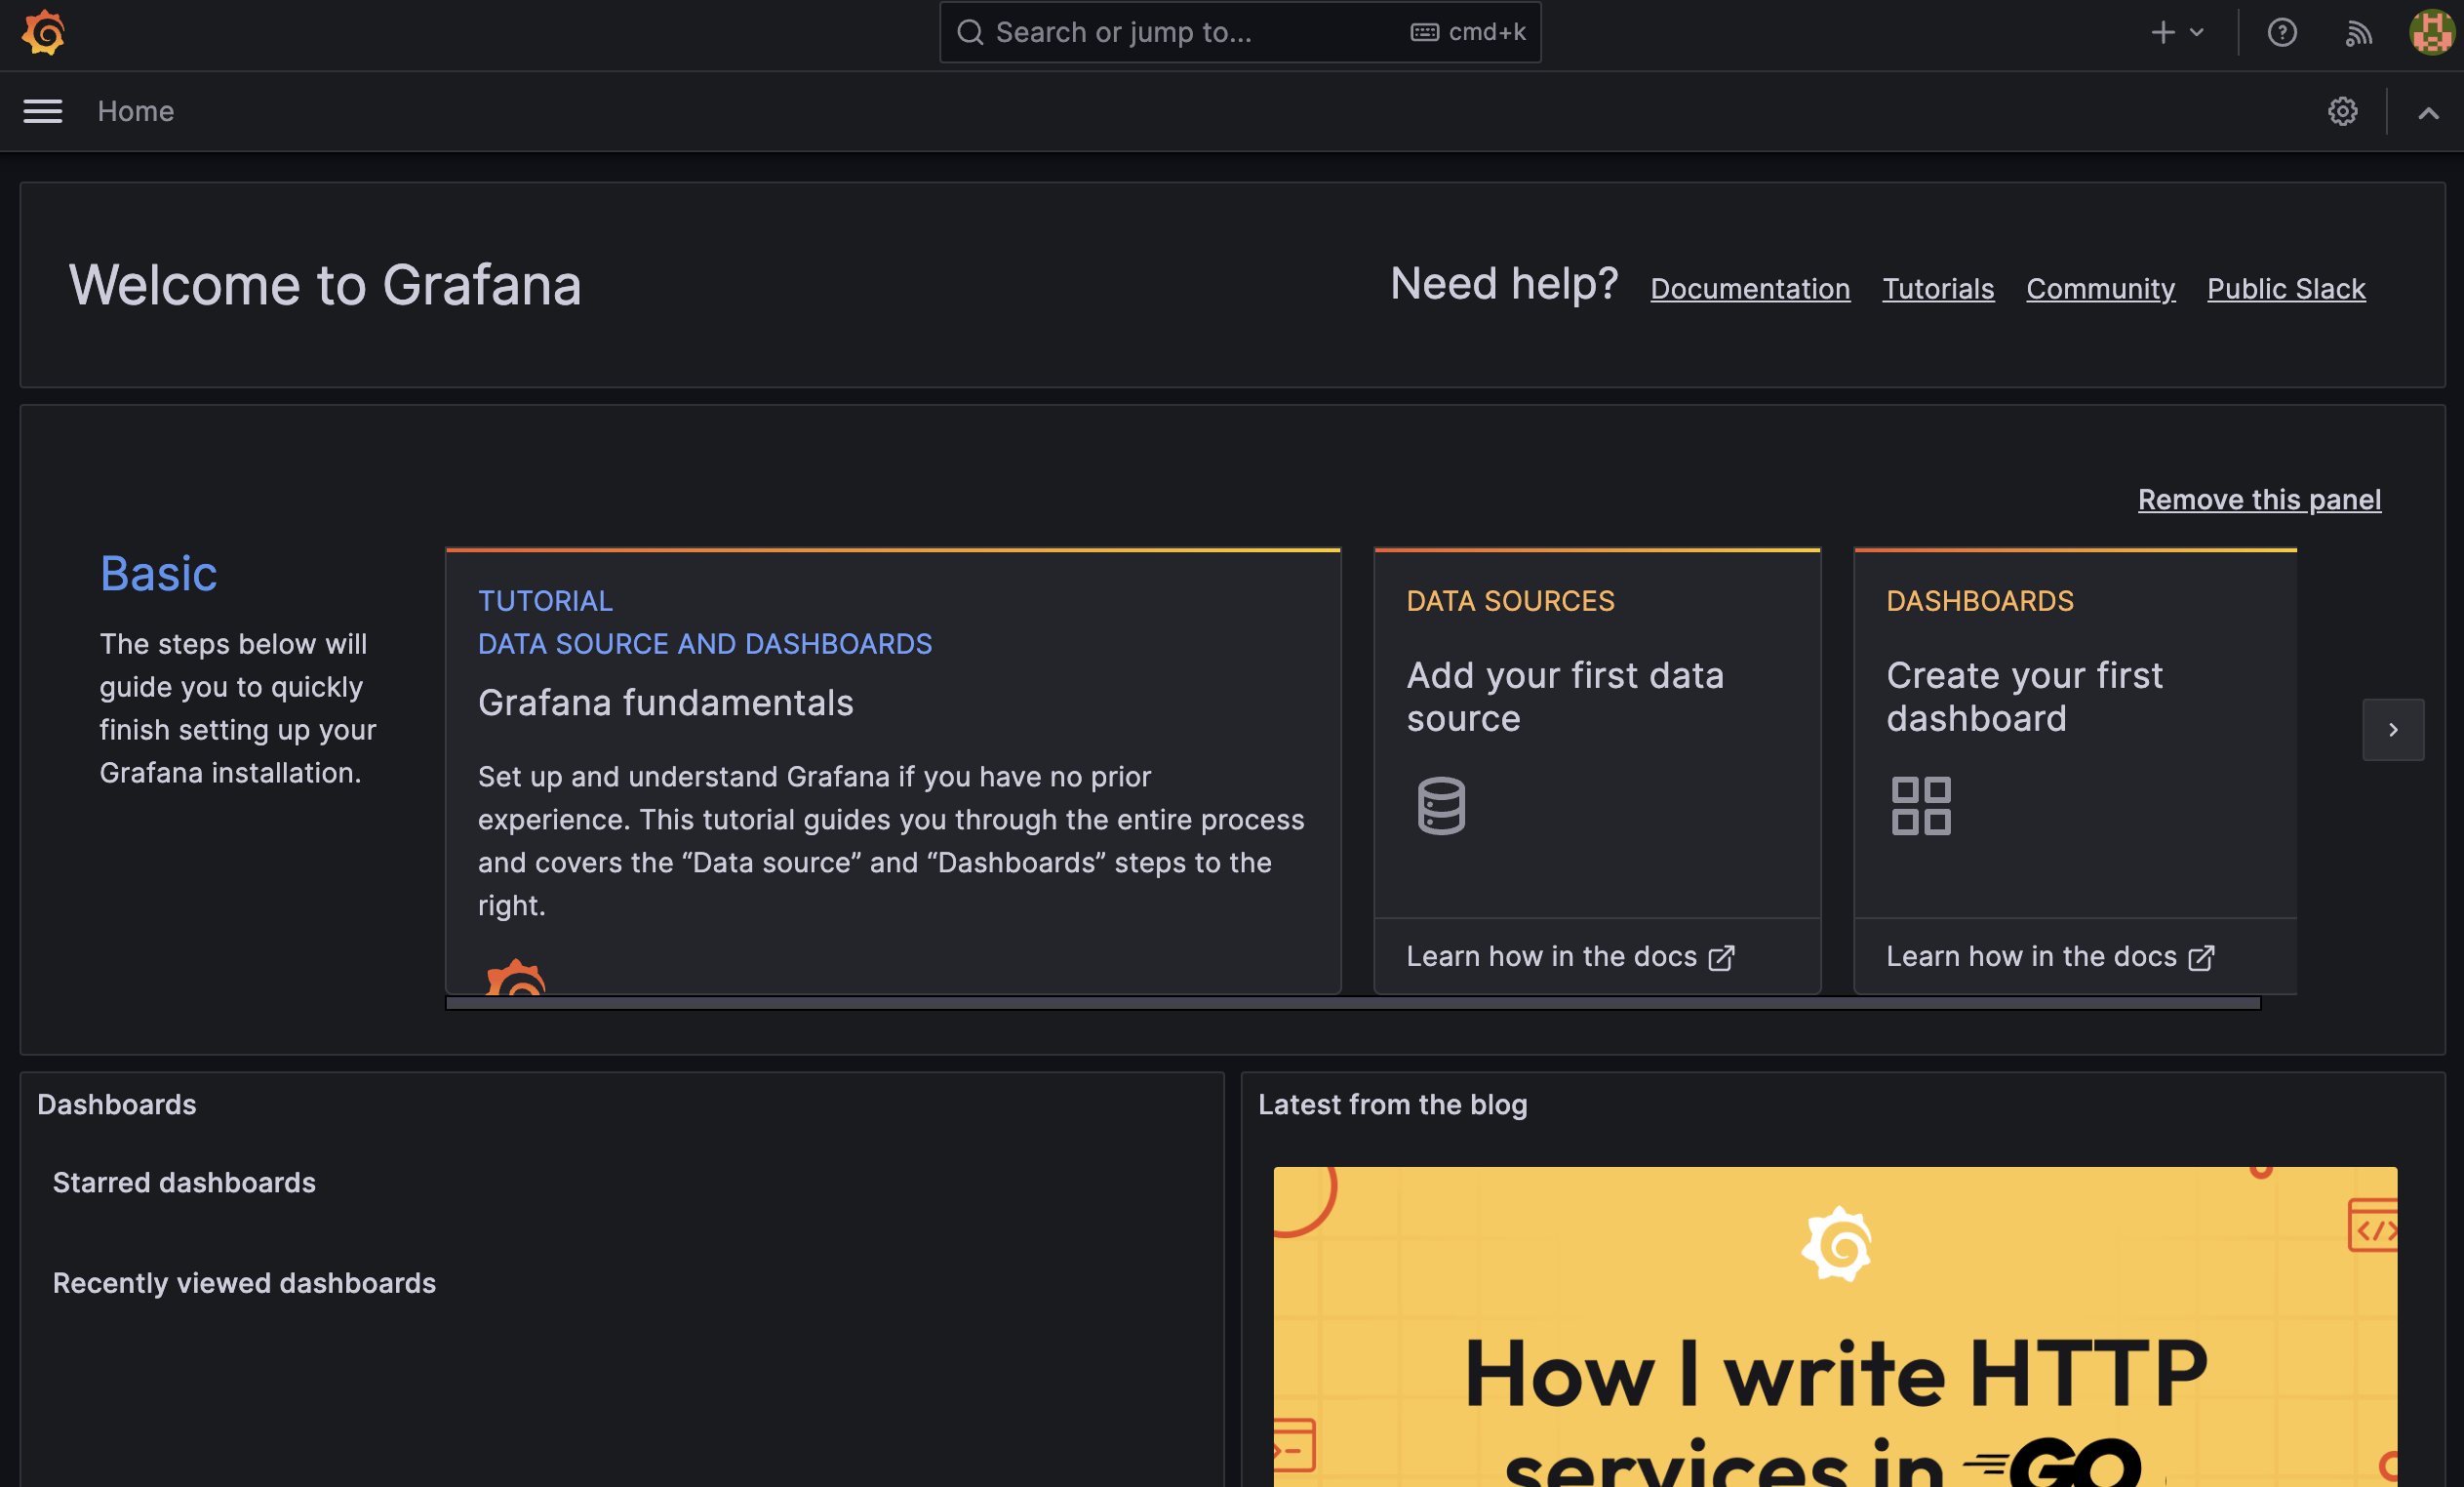
Grafana 를 실행 시킨후 http://localhost:3000 에 접속하여 실행을 확인 할 수 있다.
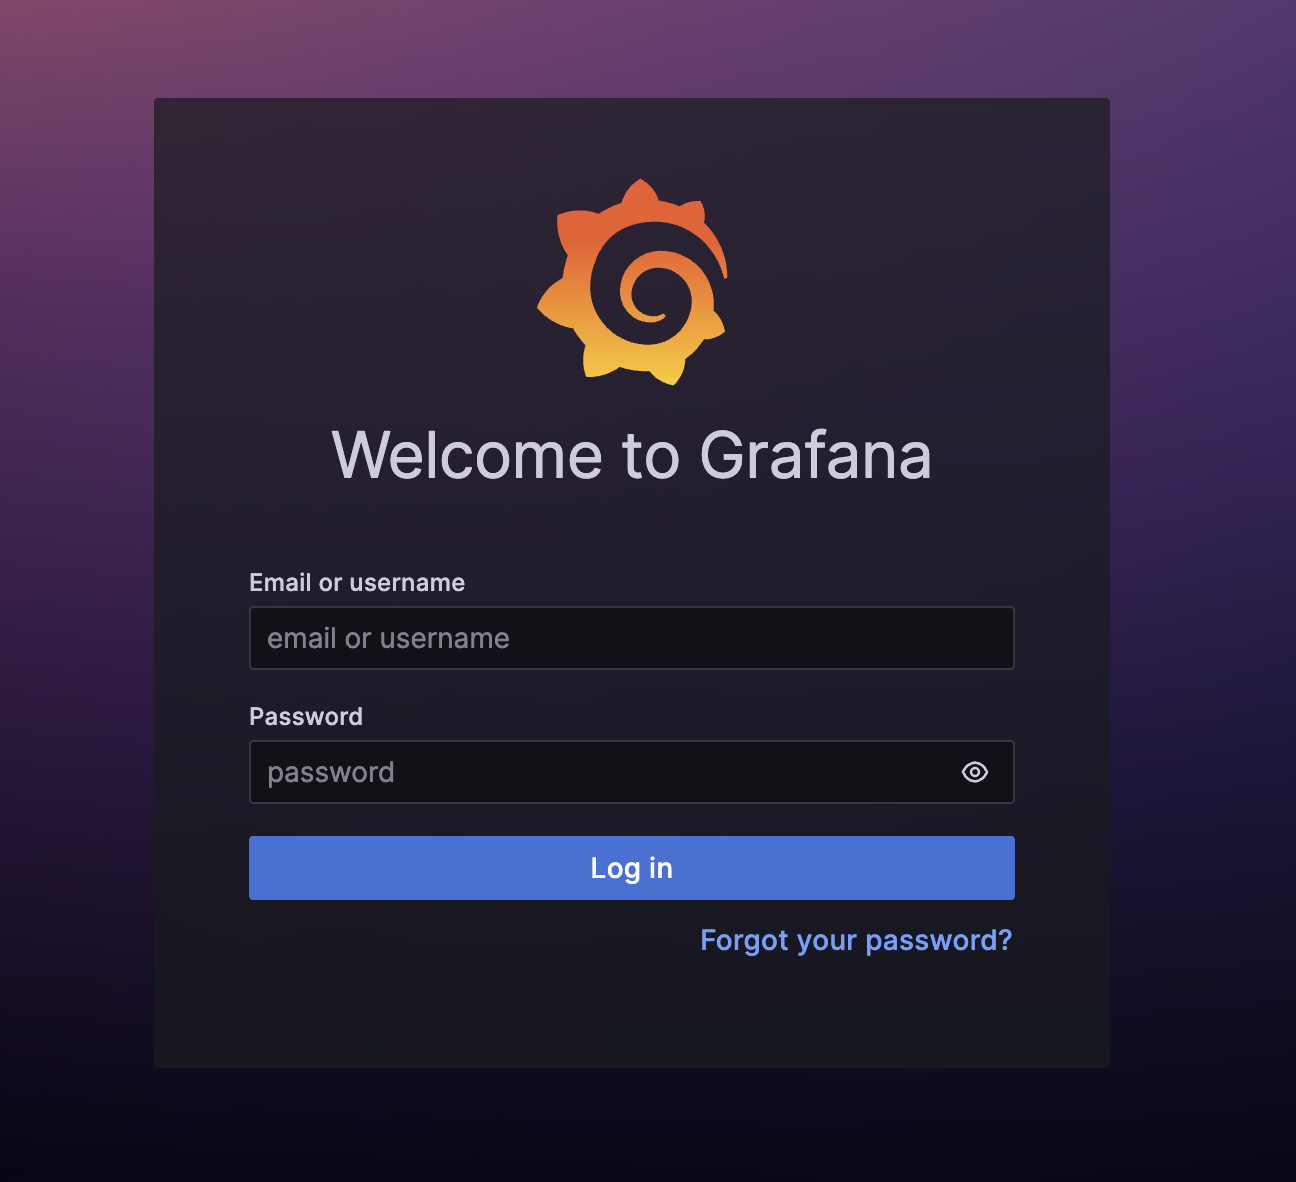
접속 후 로그인 화면 이 보여진다면 정상적으로 작동하고 있는 것 이다.
Default Username = admin
Default Password = admin
으로 입력 하면 된다.
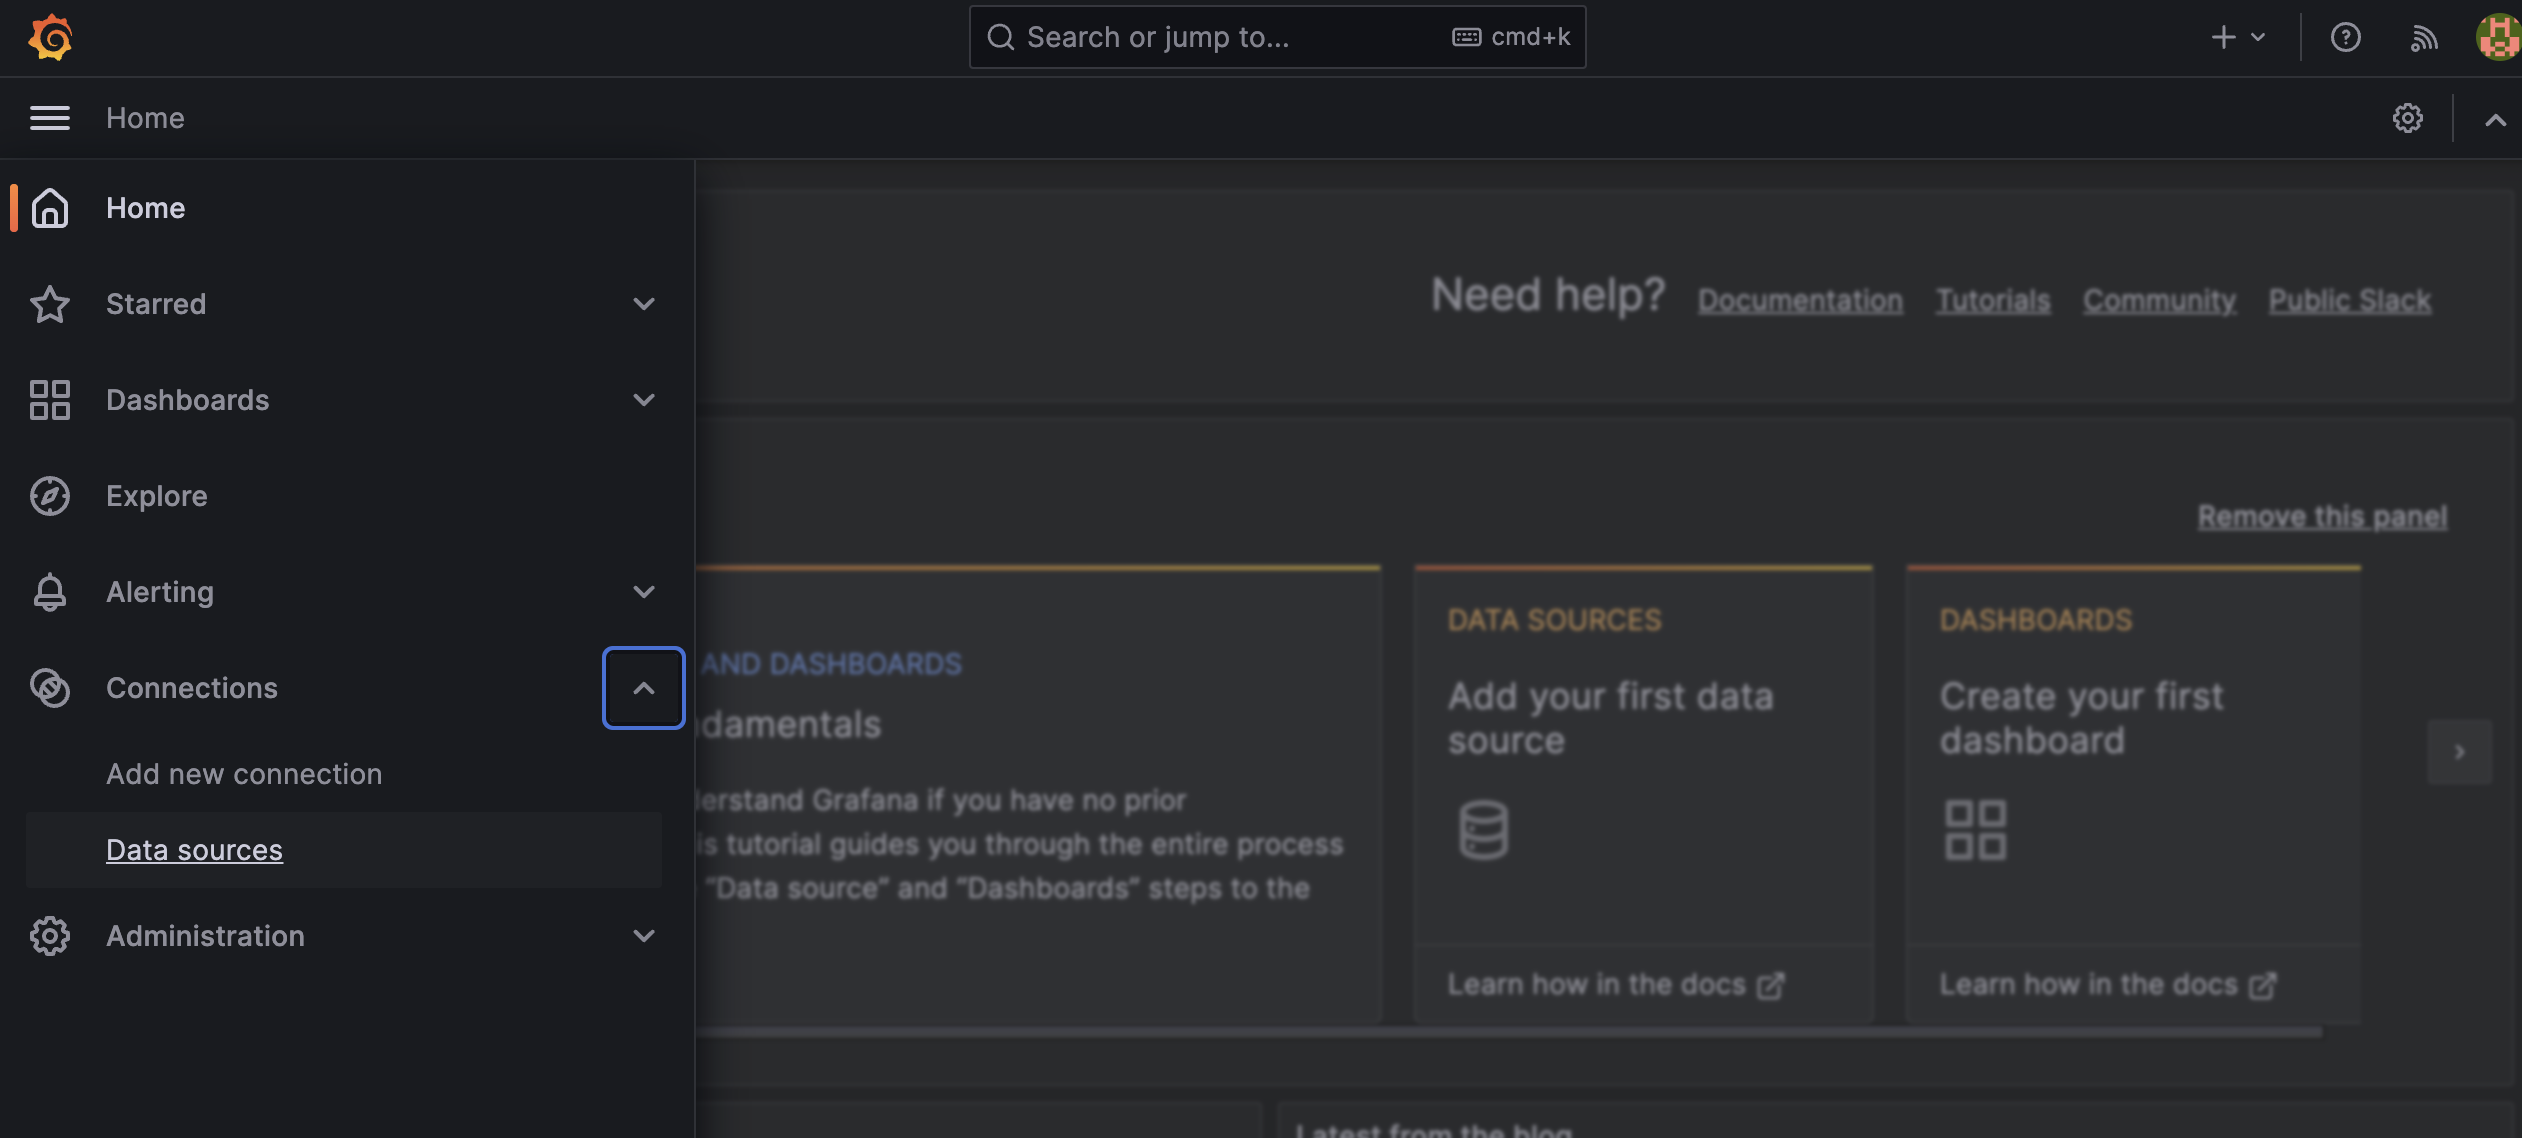
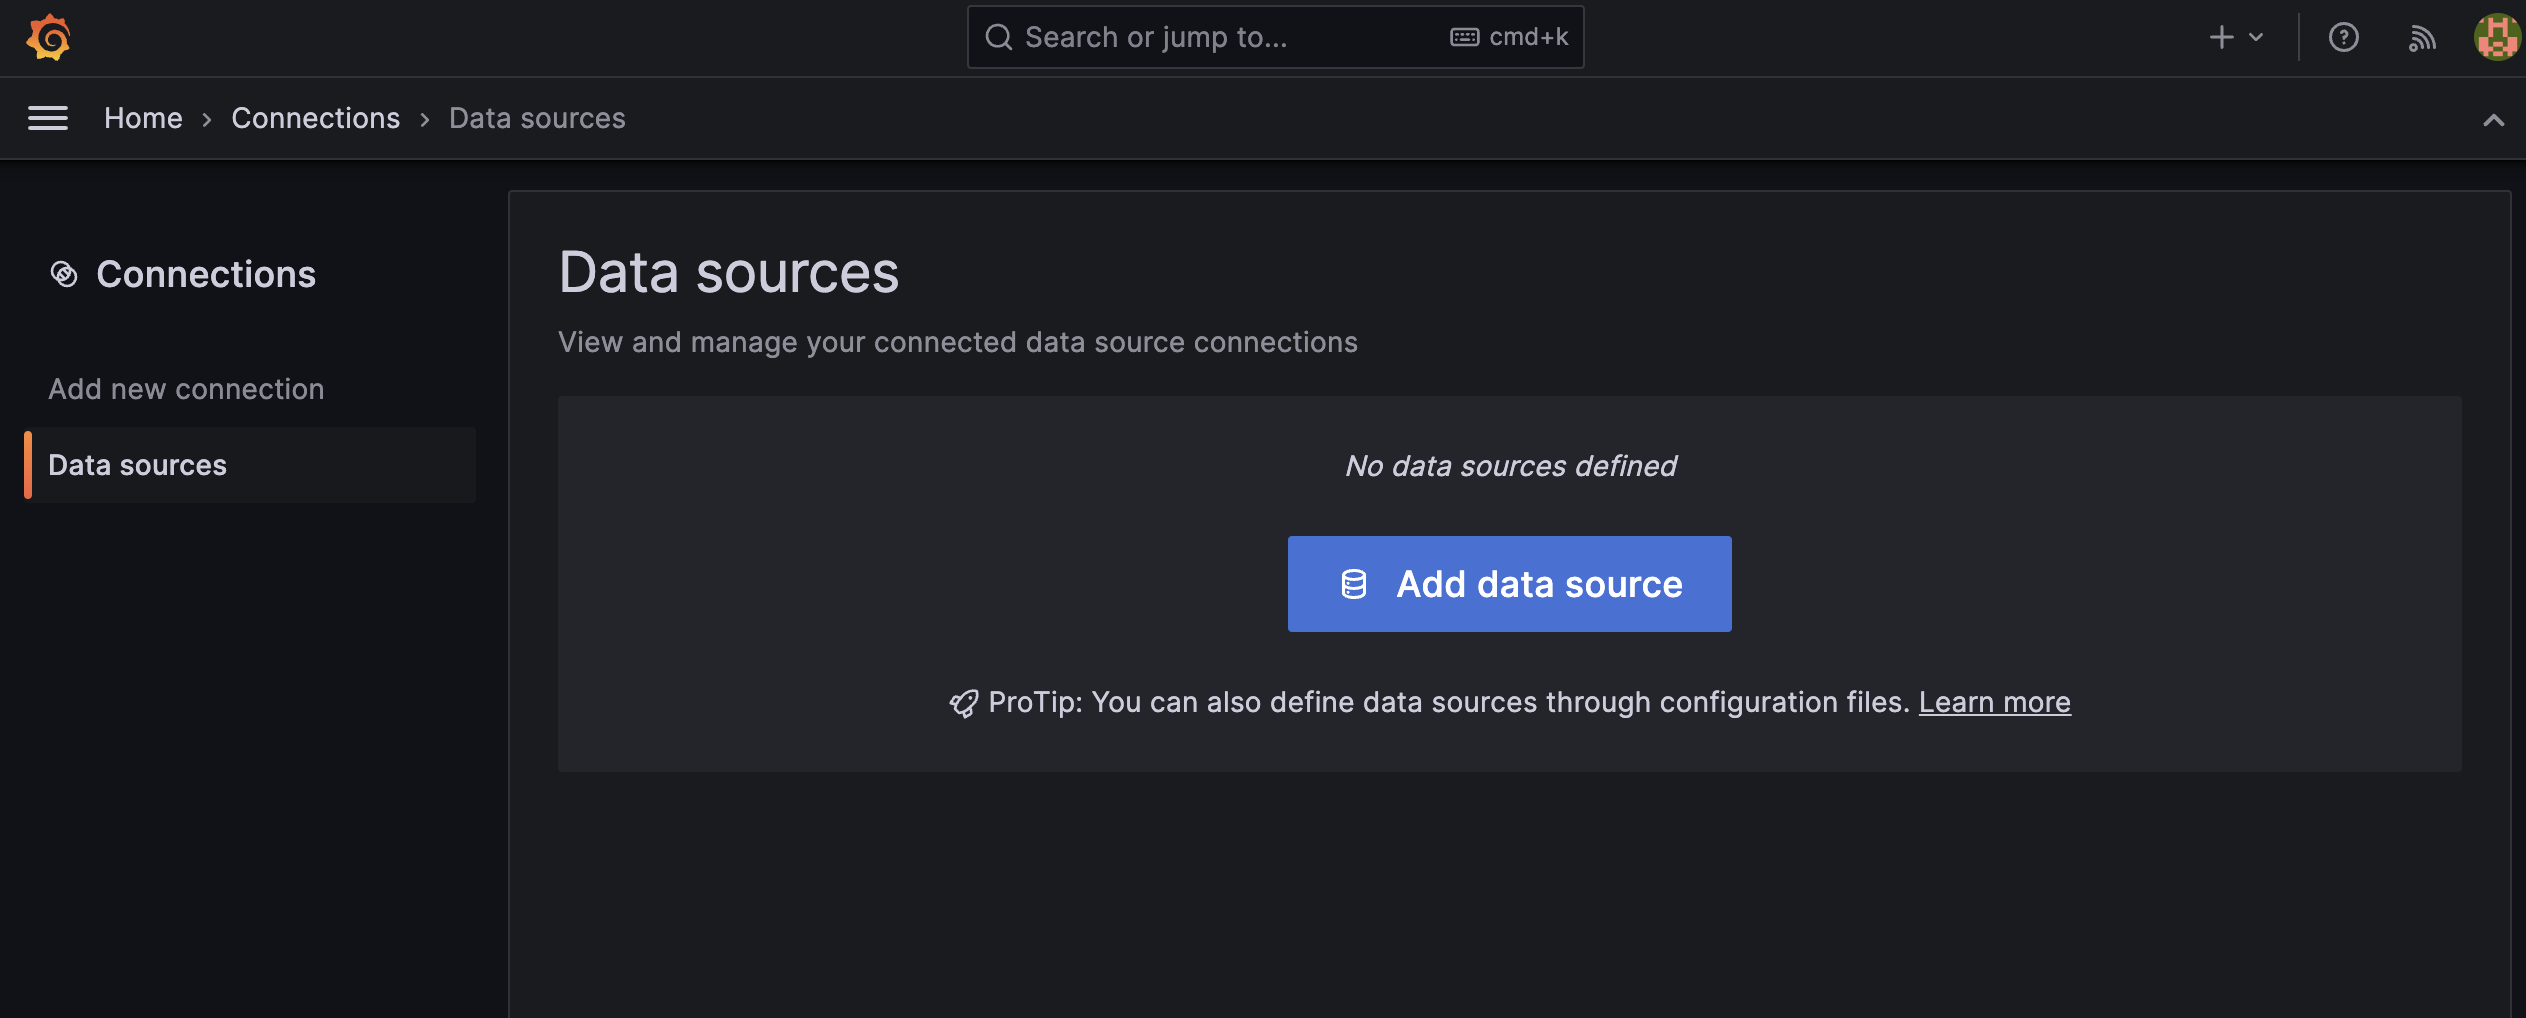
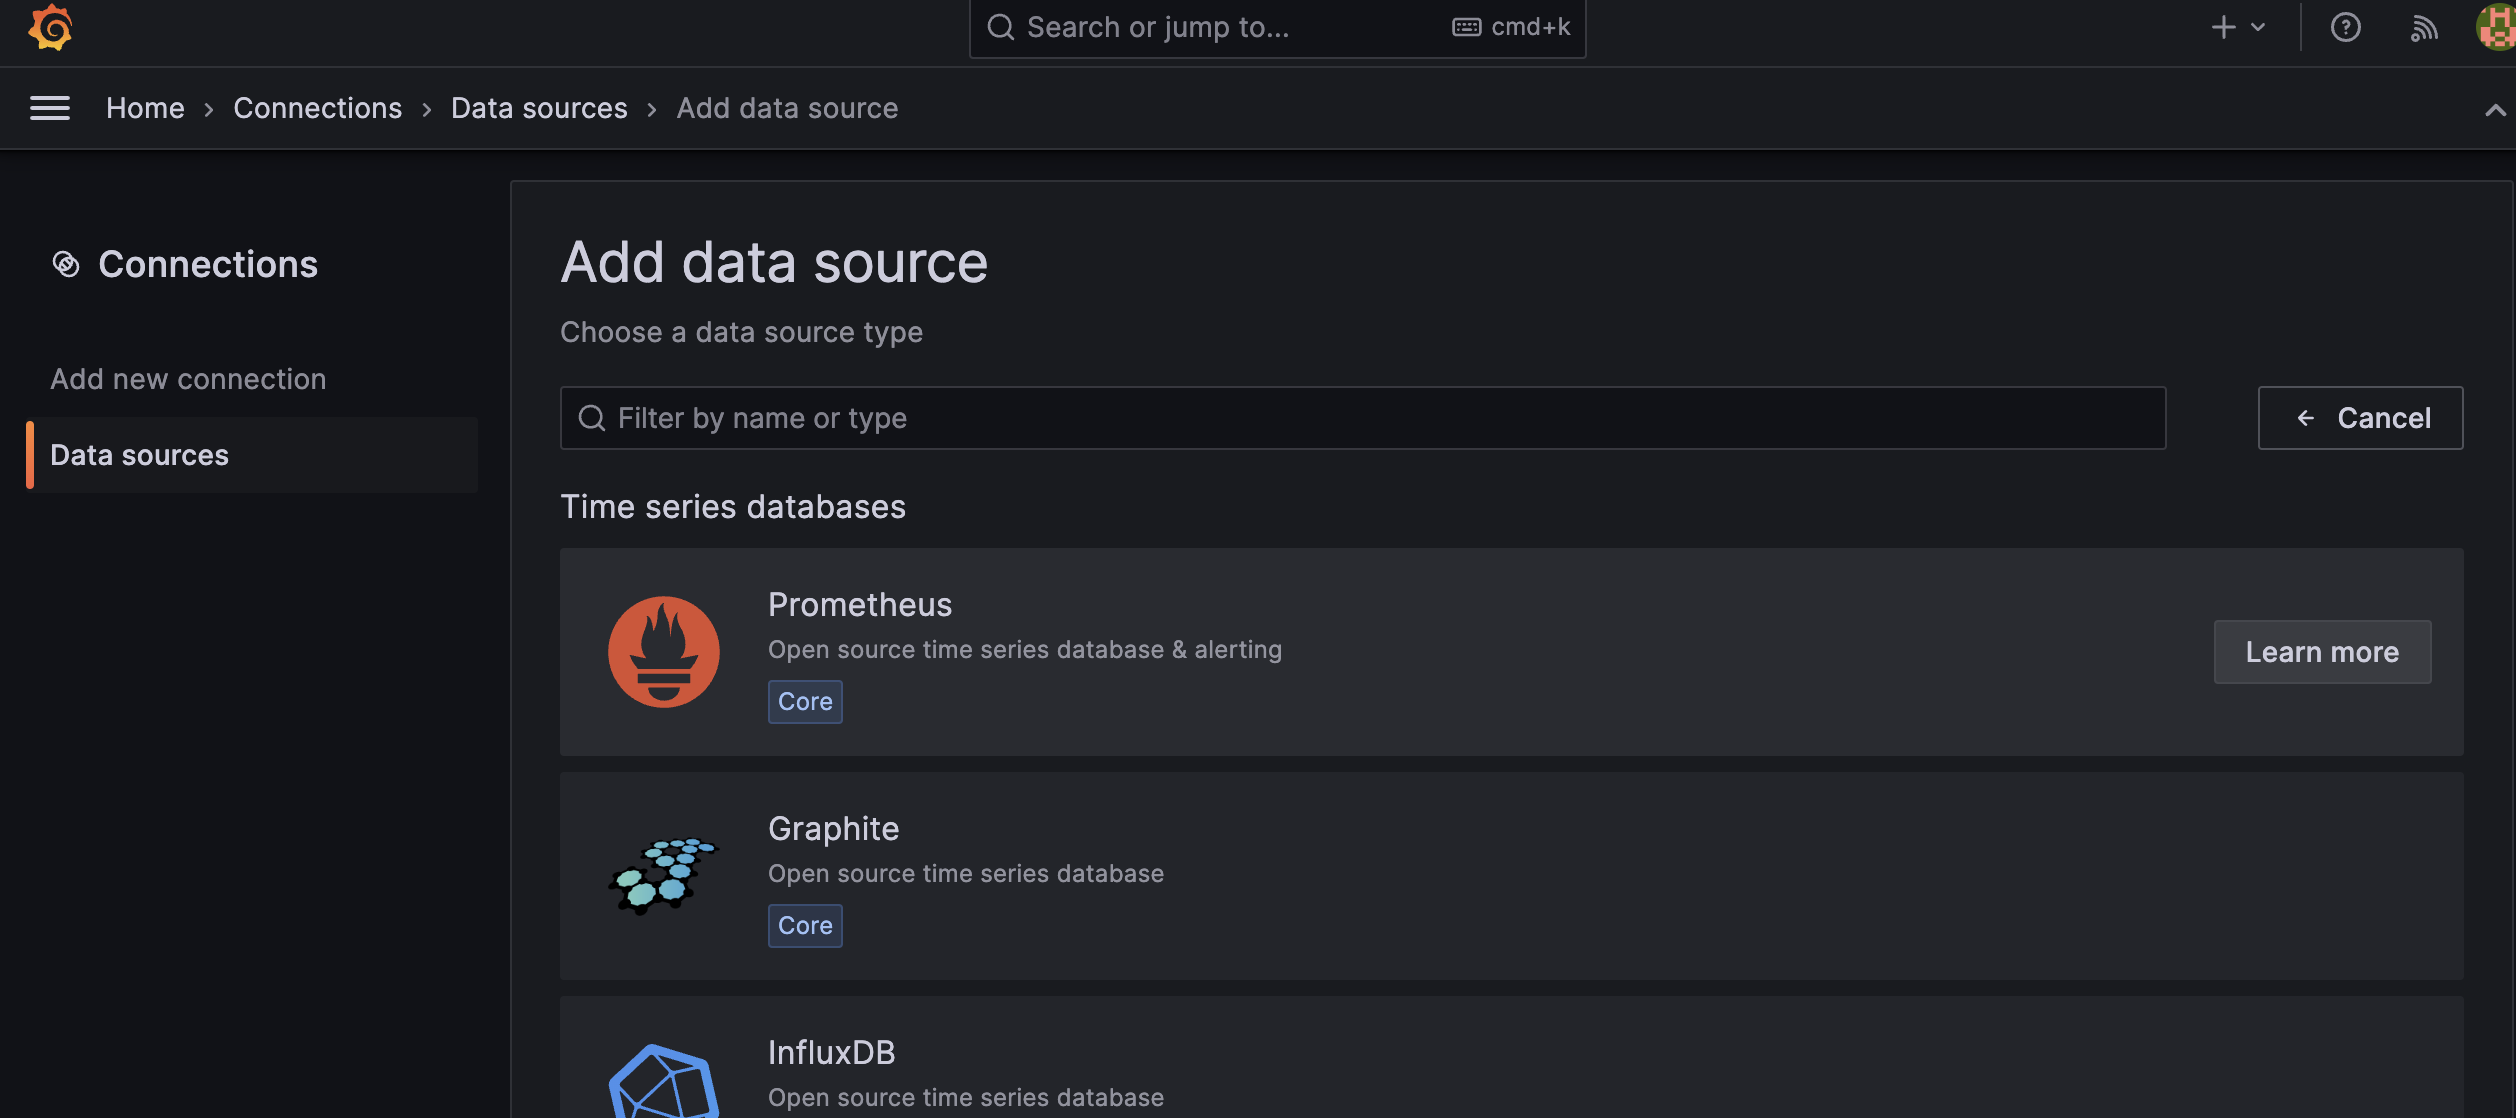
Data Source 에 Prometheus 를 추가 해준다.
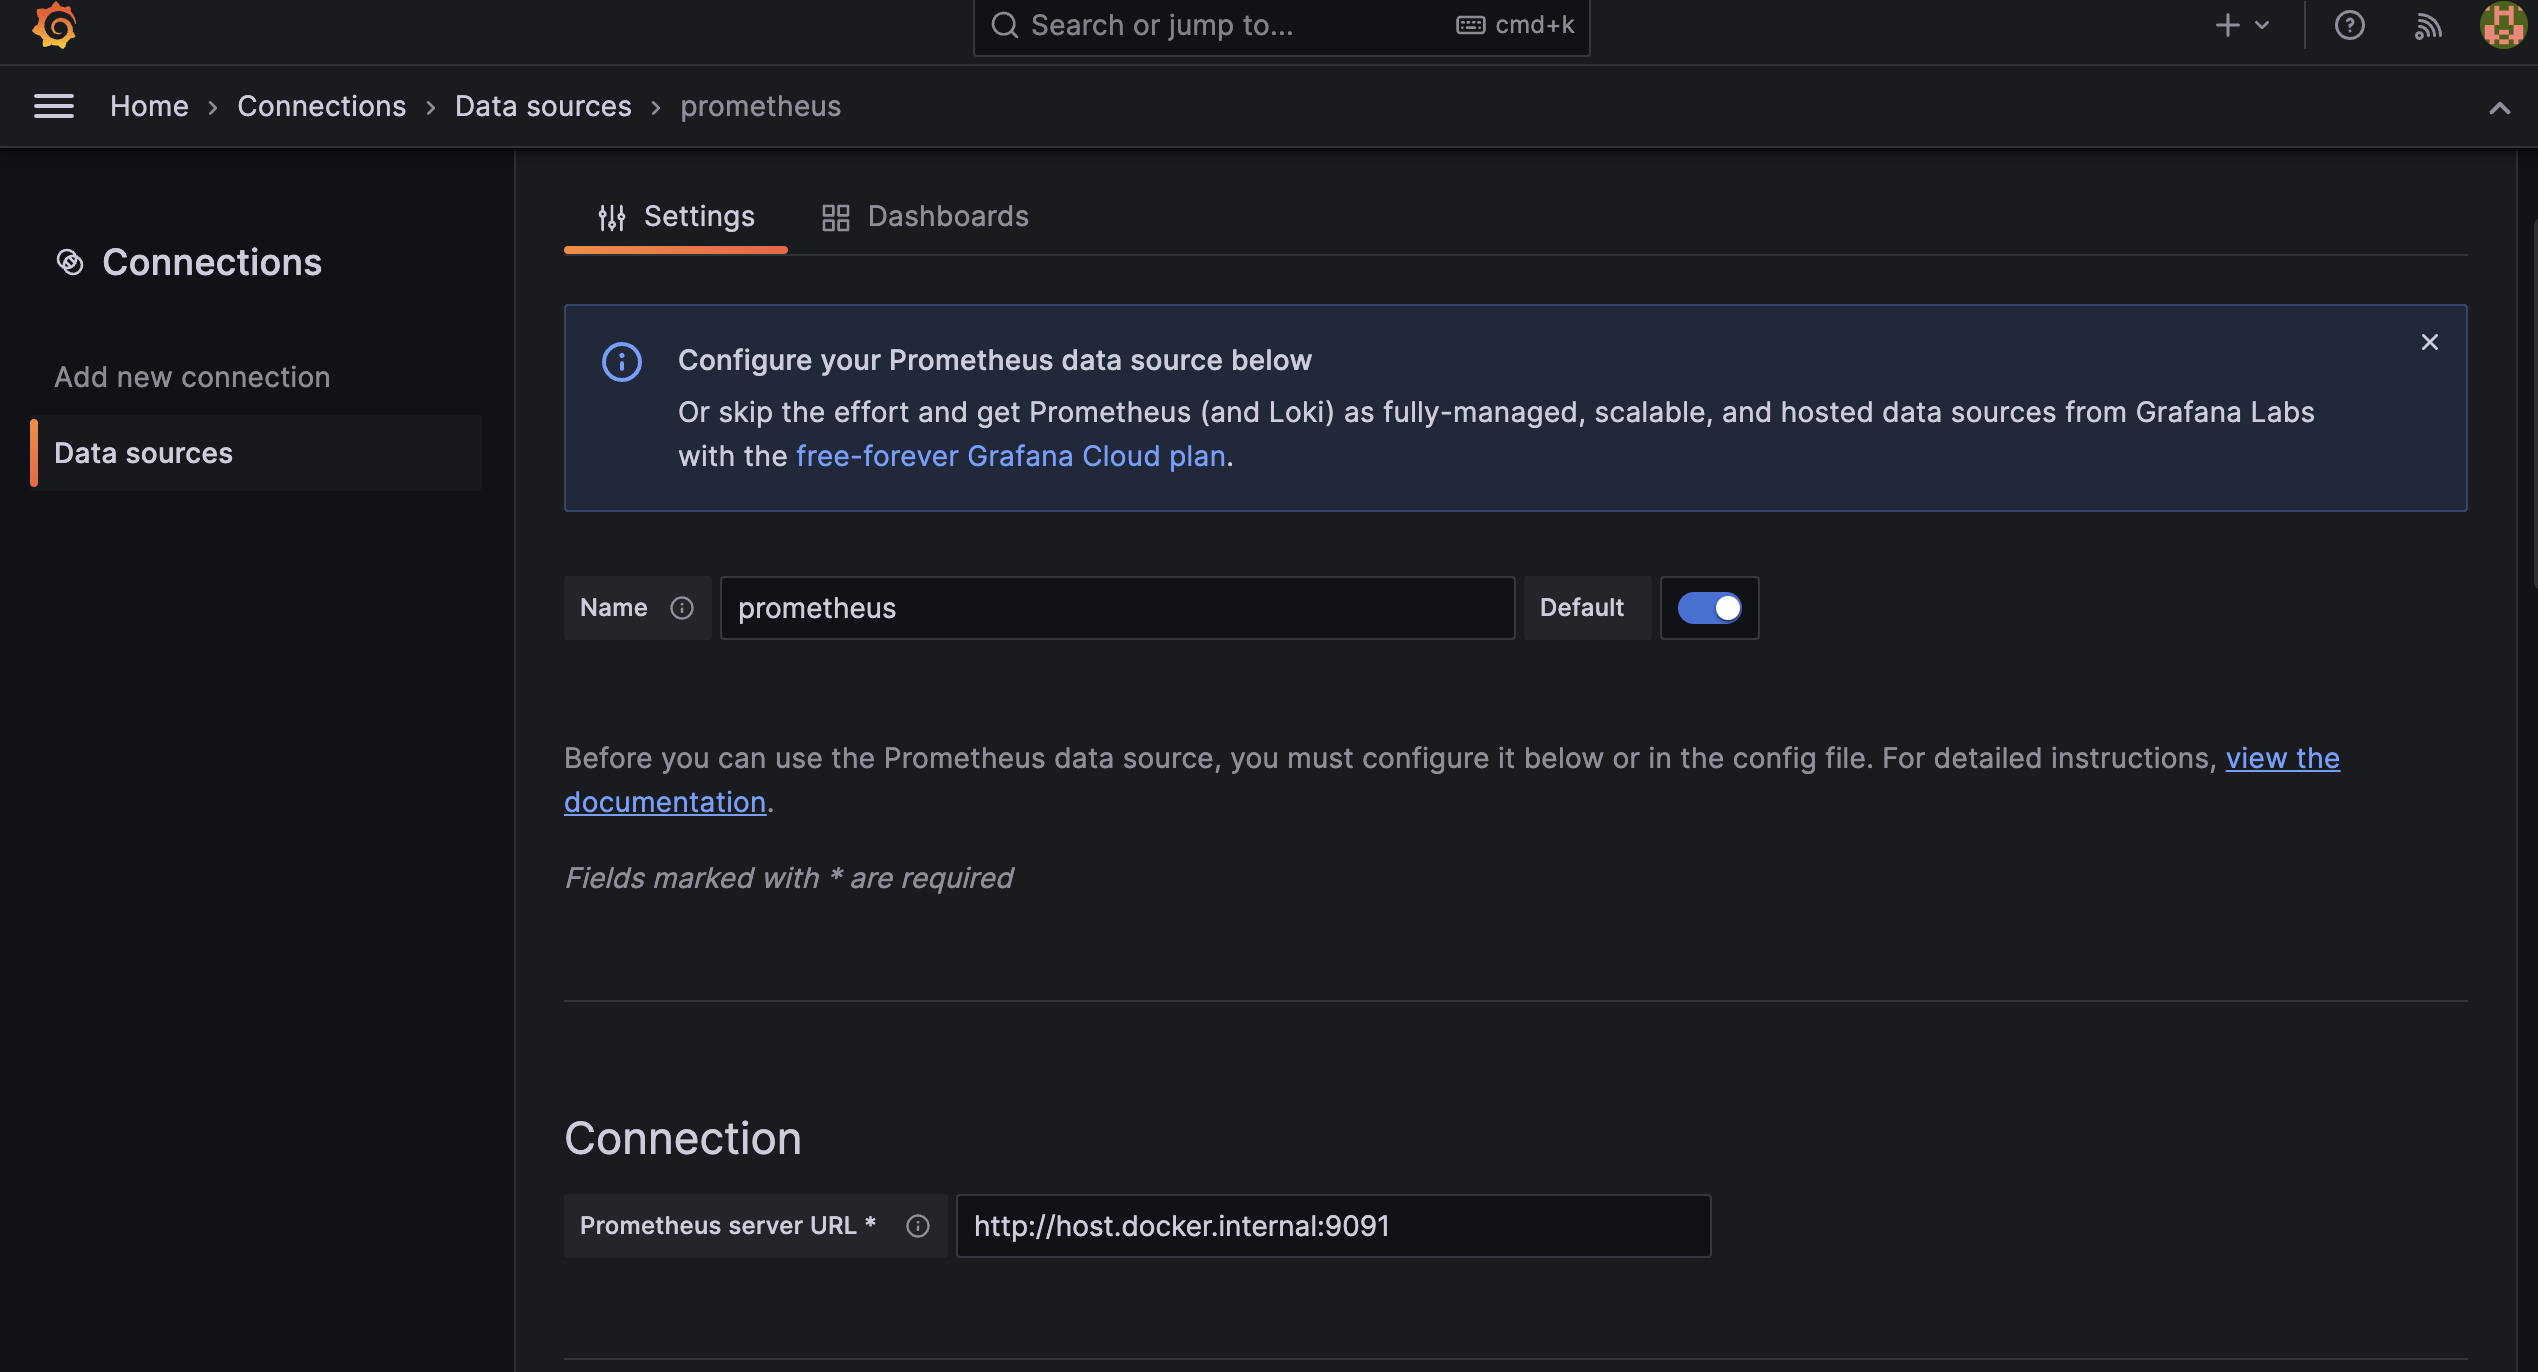
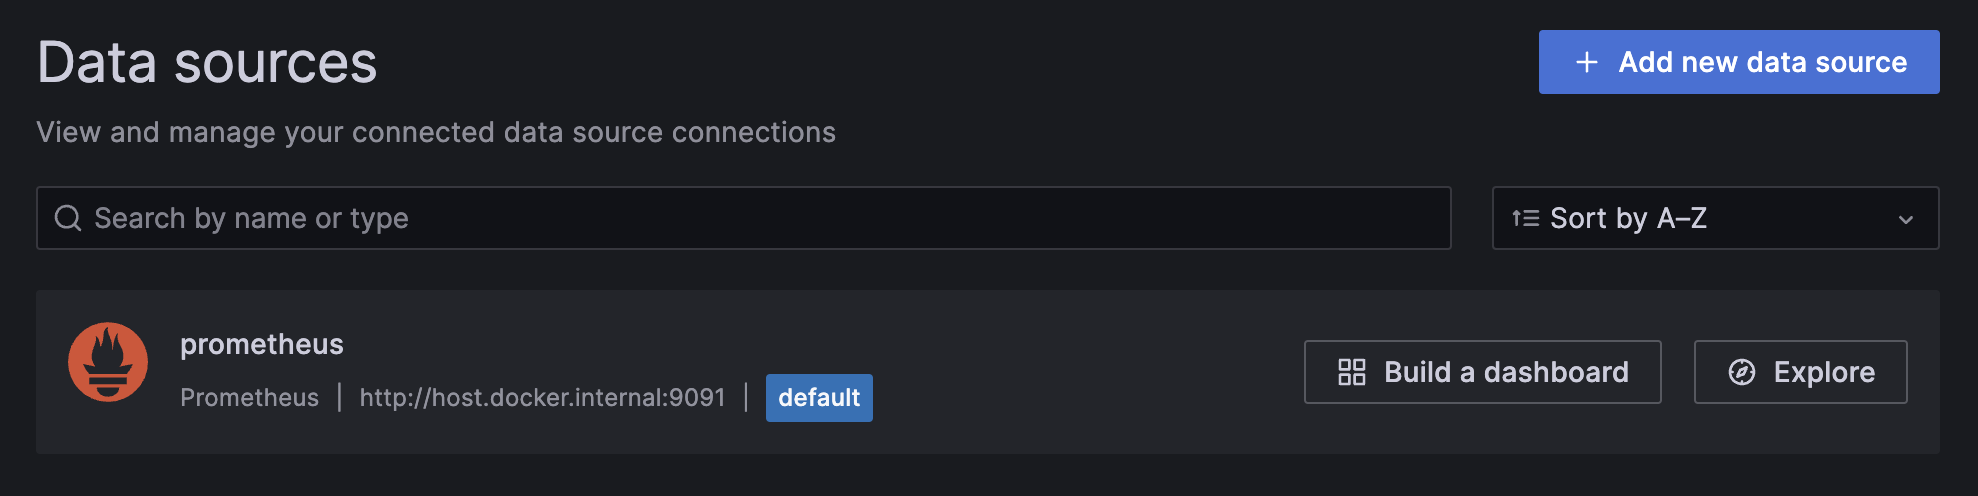
Spring Boot 서버와 Connection을 연결 해줘야 하는데
Grafana는 Docker Container 에서 작동하고 Spring Boot 는 사용자의 Local에서 작동하고 있다보니 포트 포워딩을 해주거나 Container 에서 사용자의 Local로 접근 할 수 있도록 주소를
http://host.docker.internal:{SpringBoot포트번호} 로 명시 해줘야 한다.
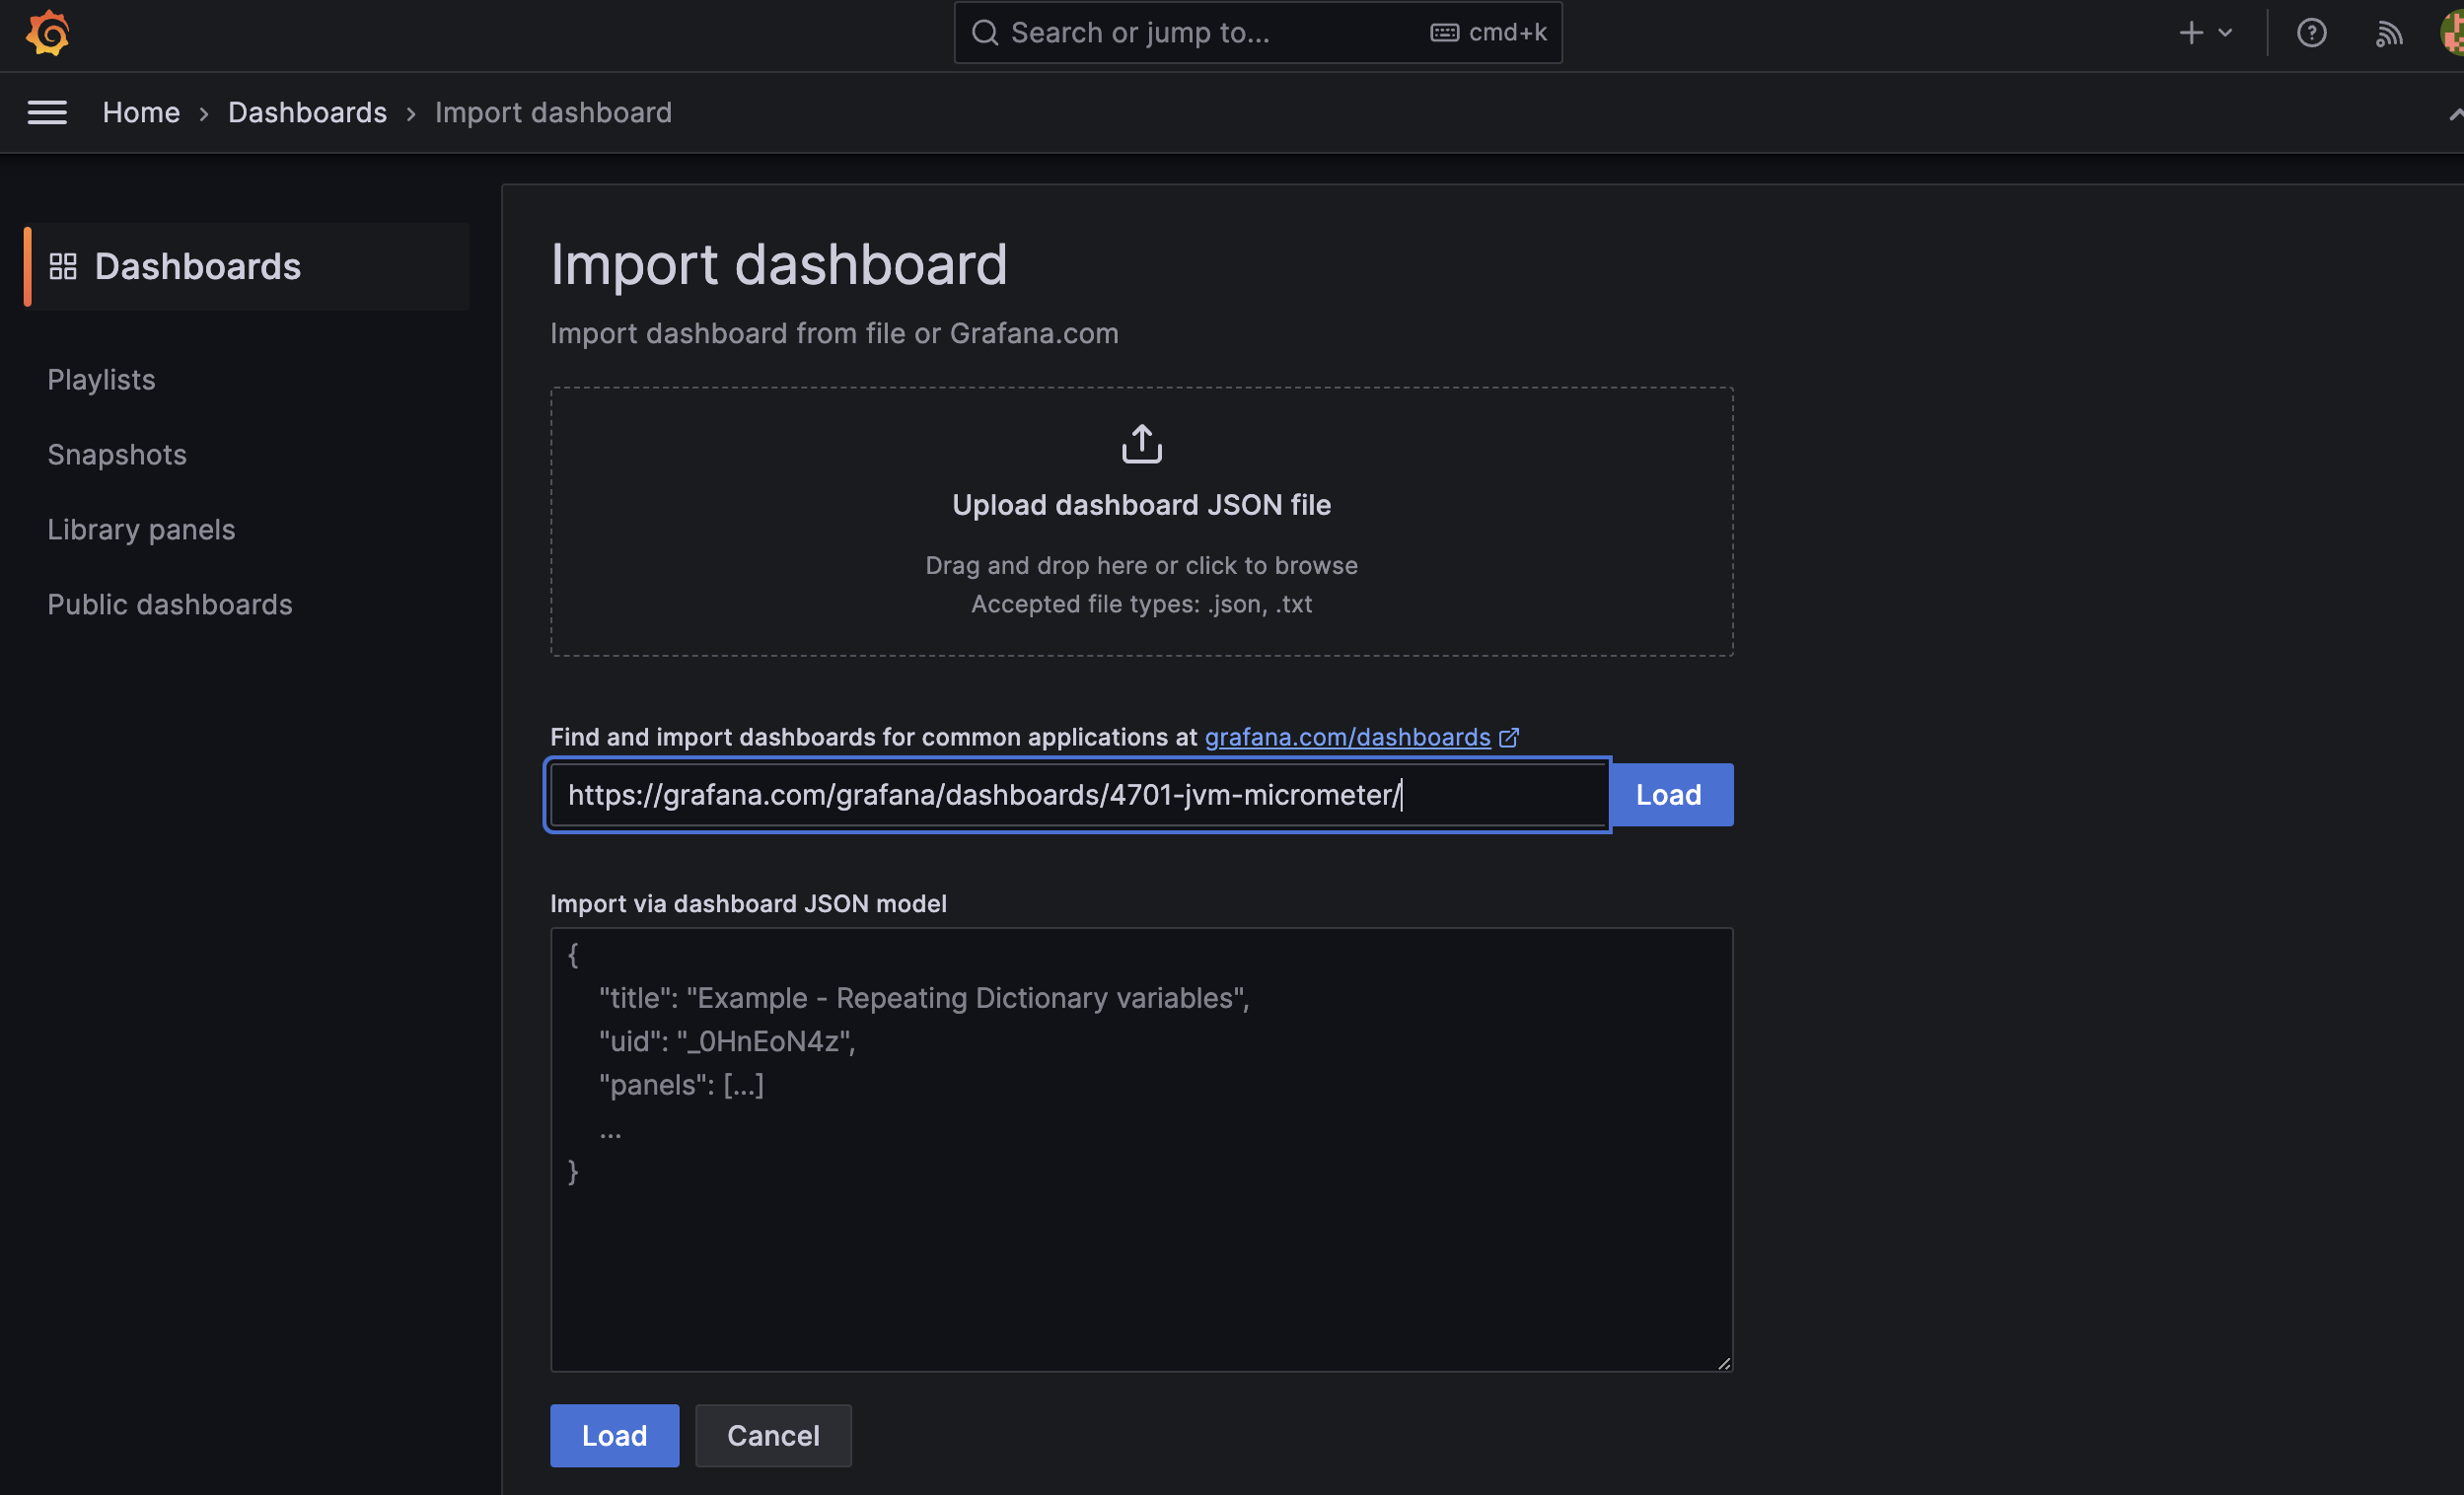
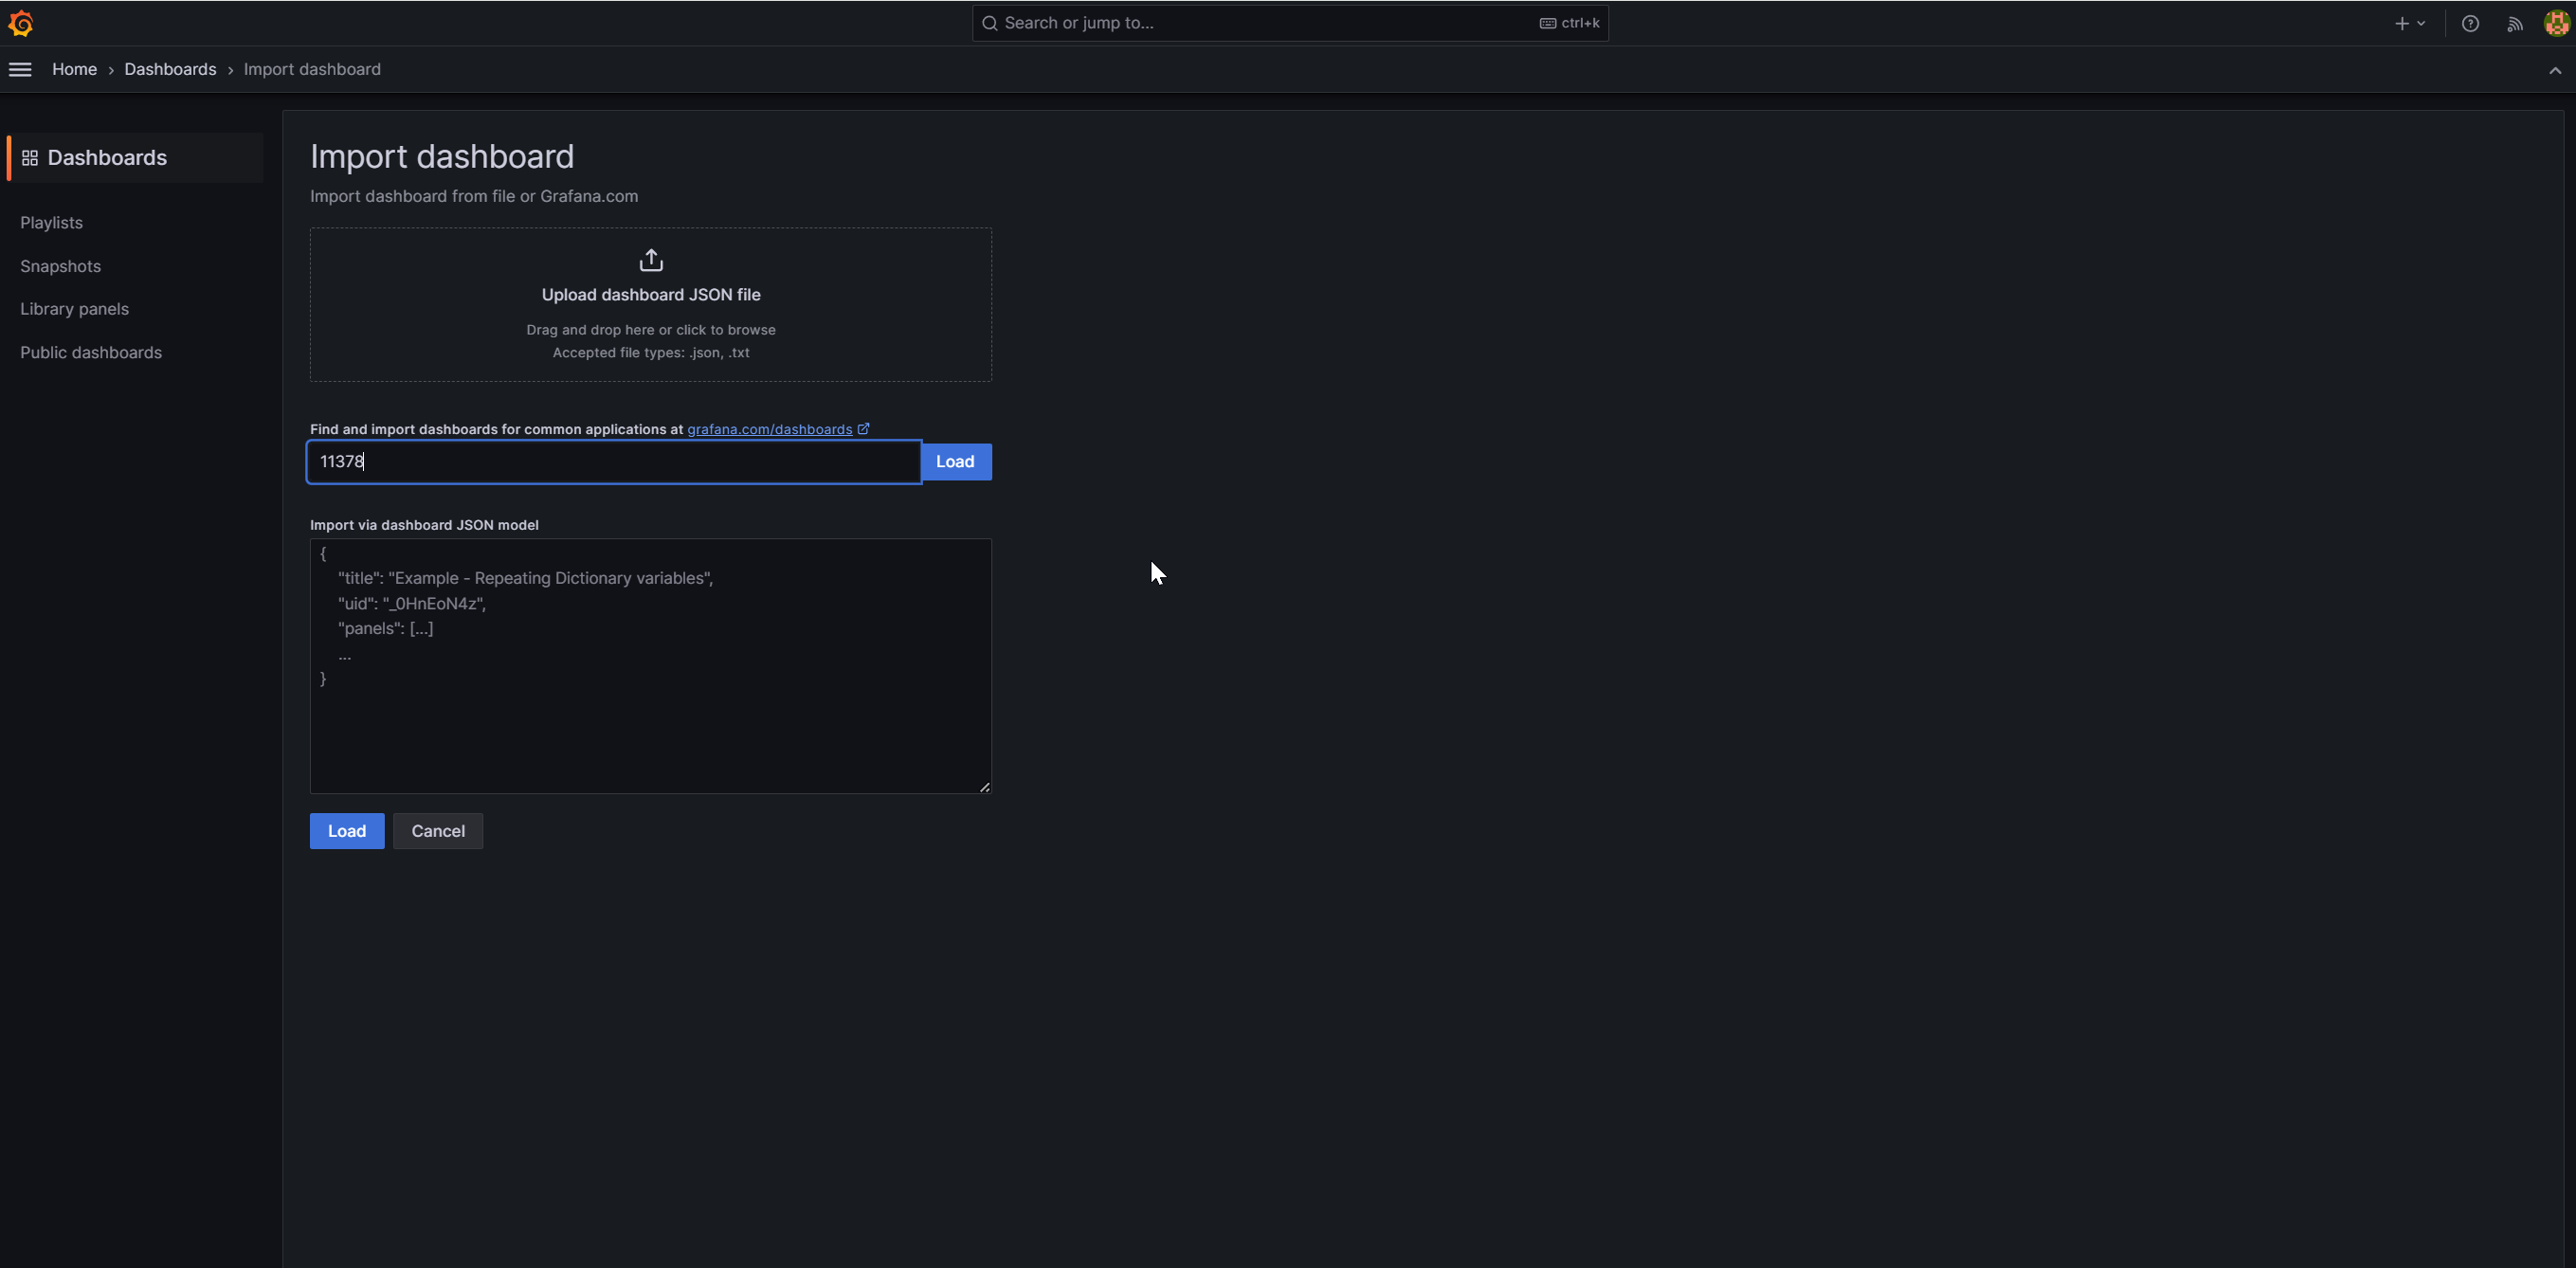
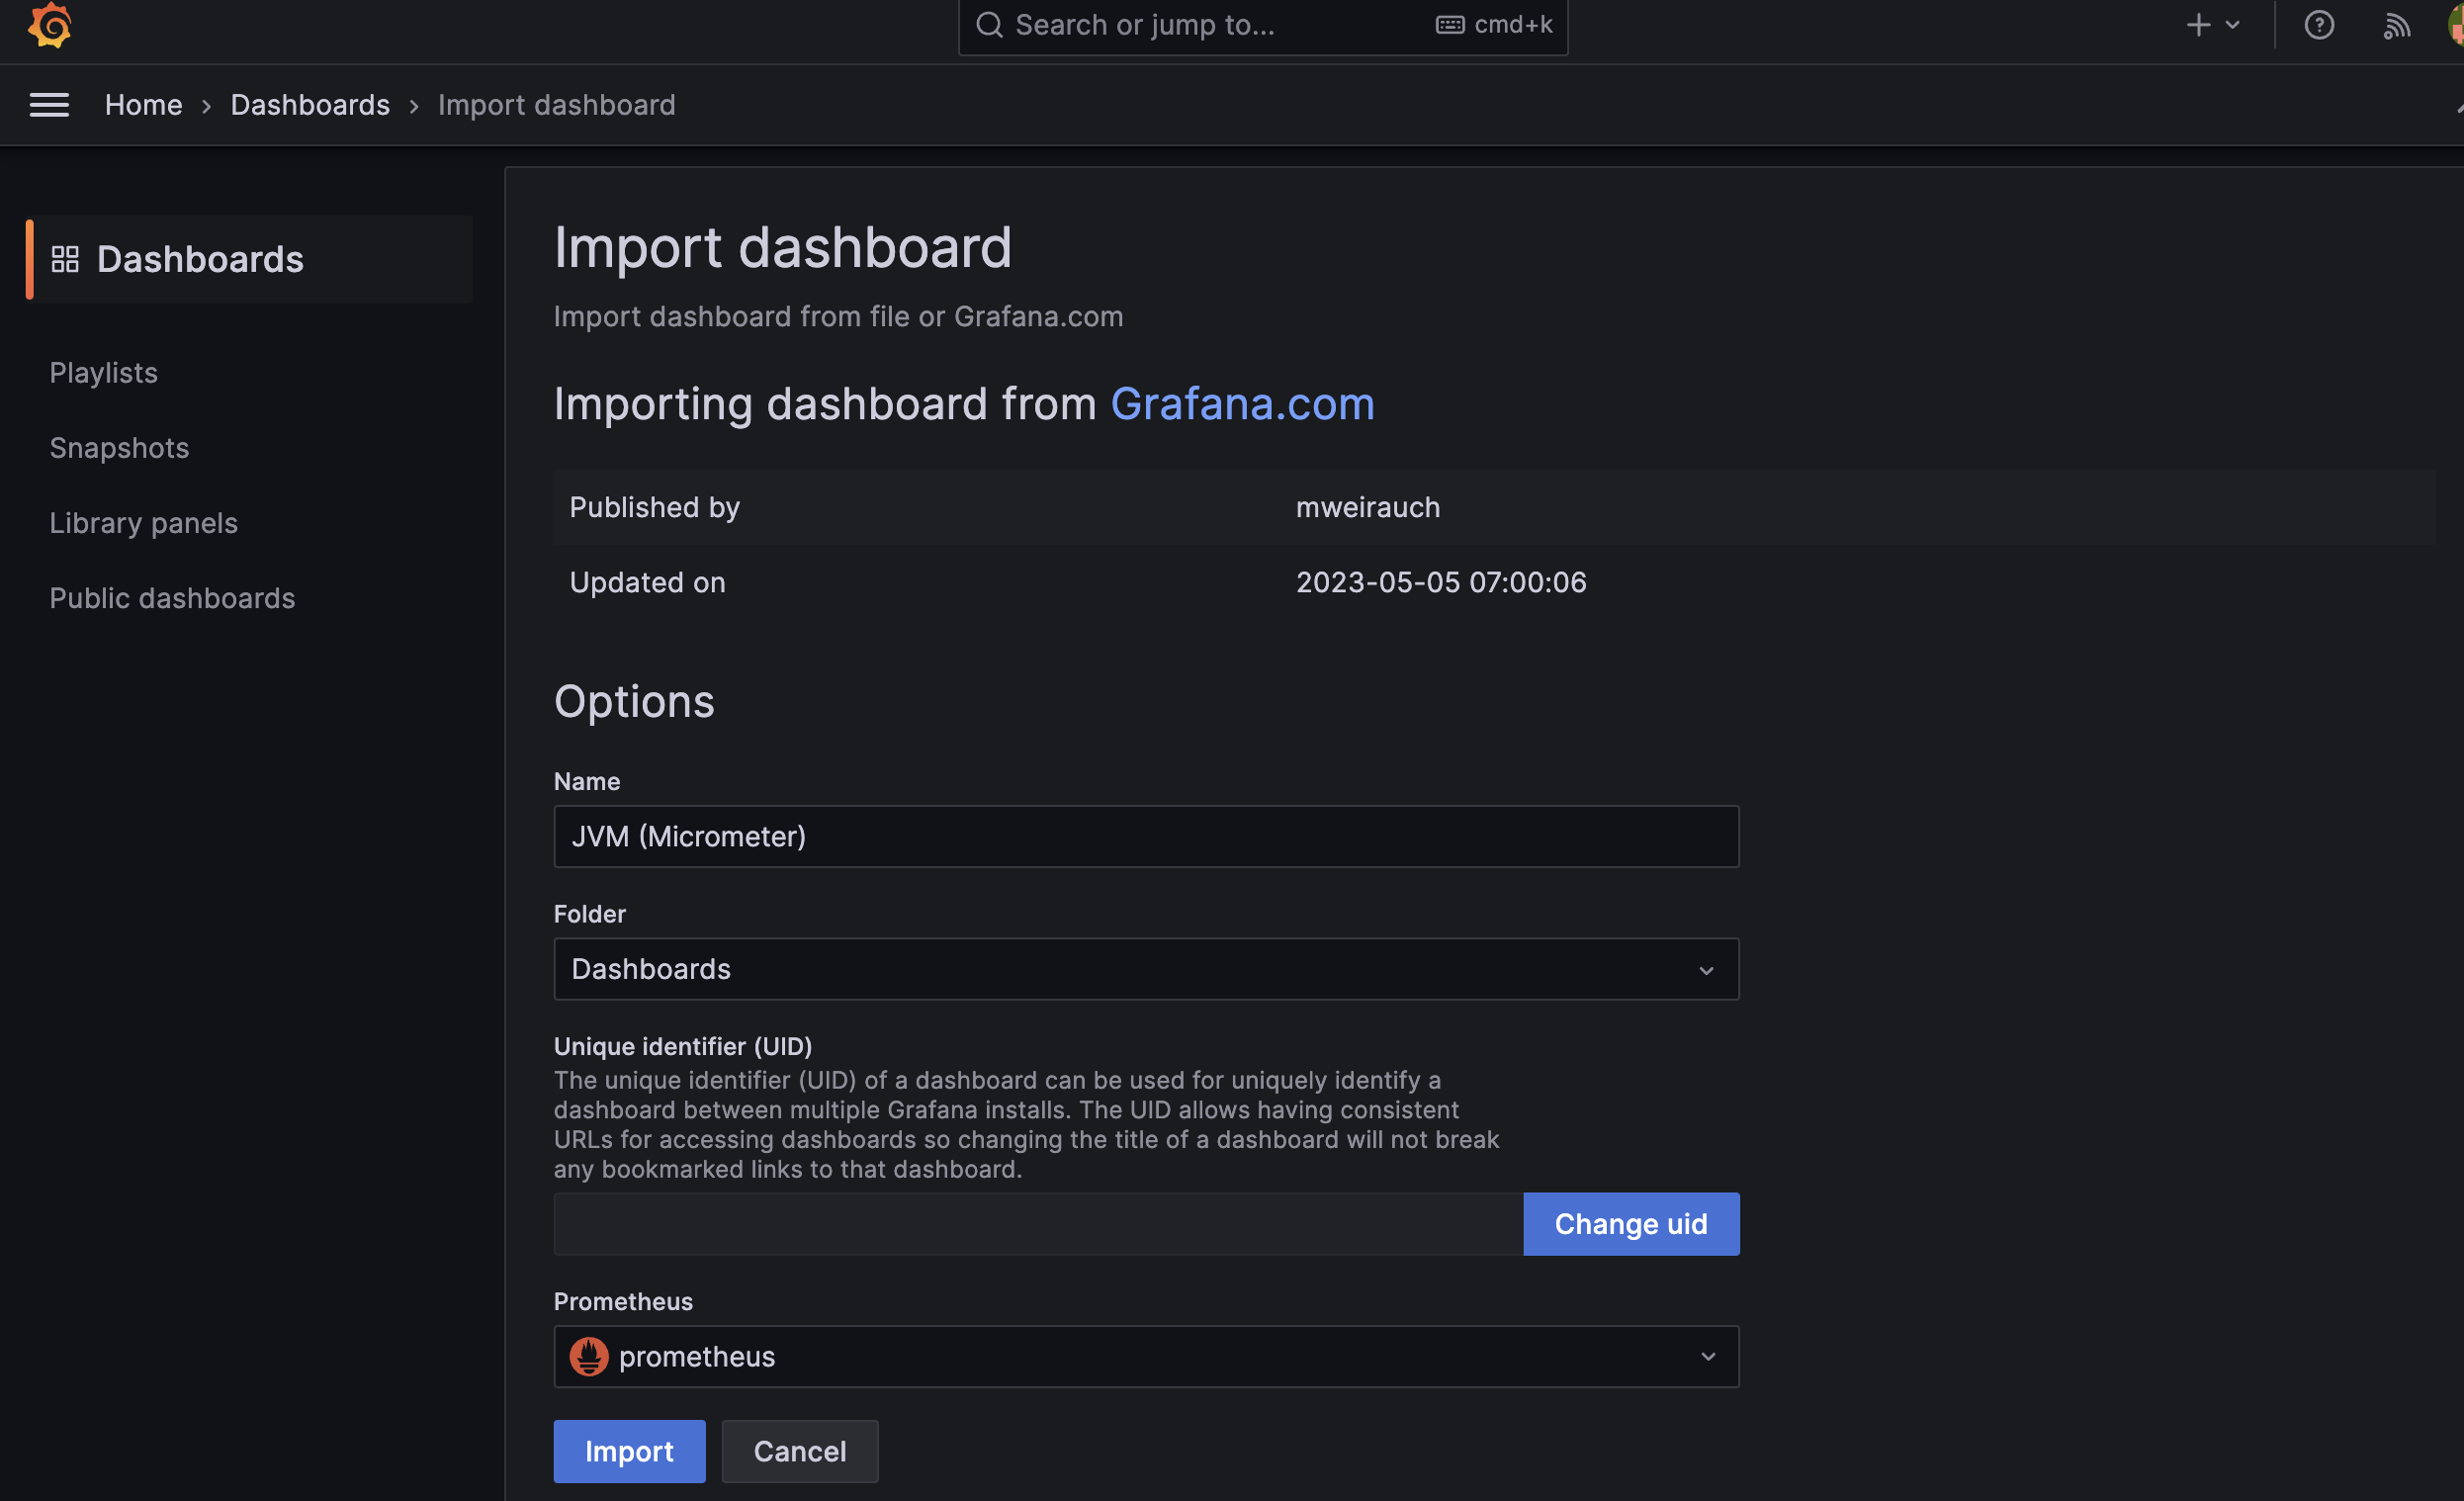
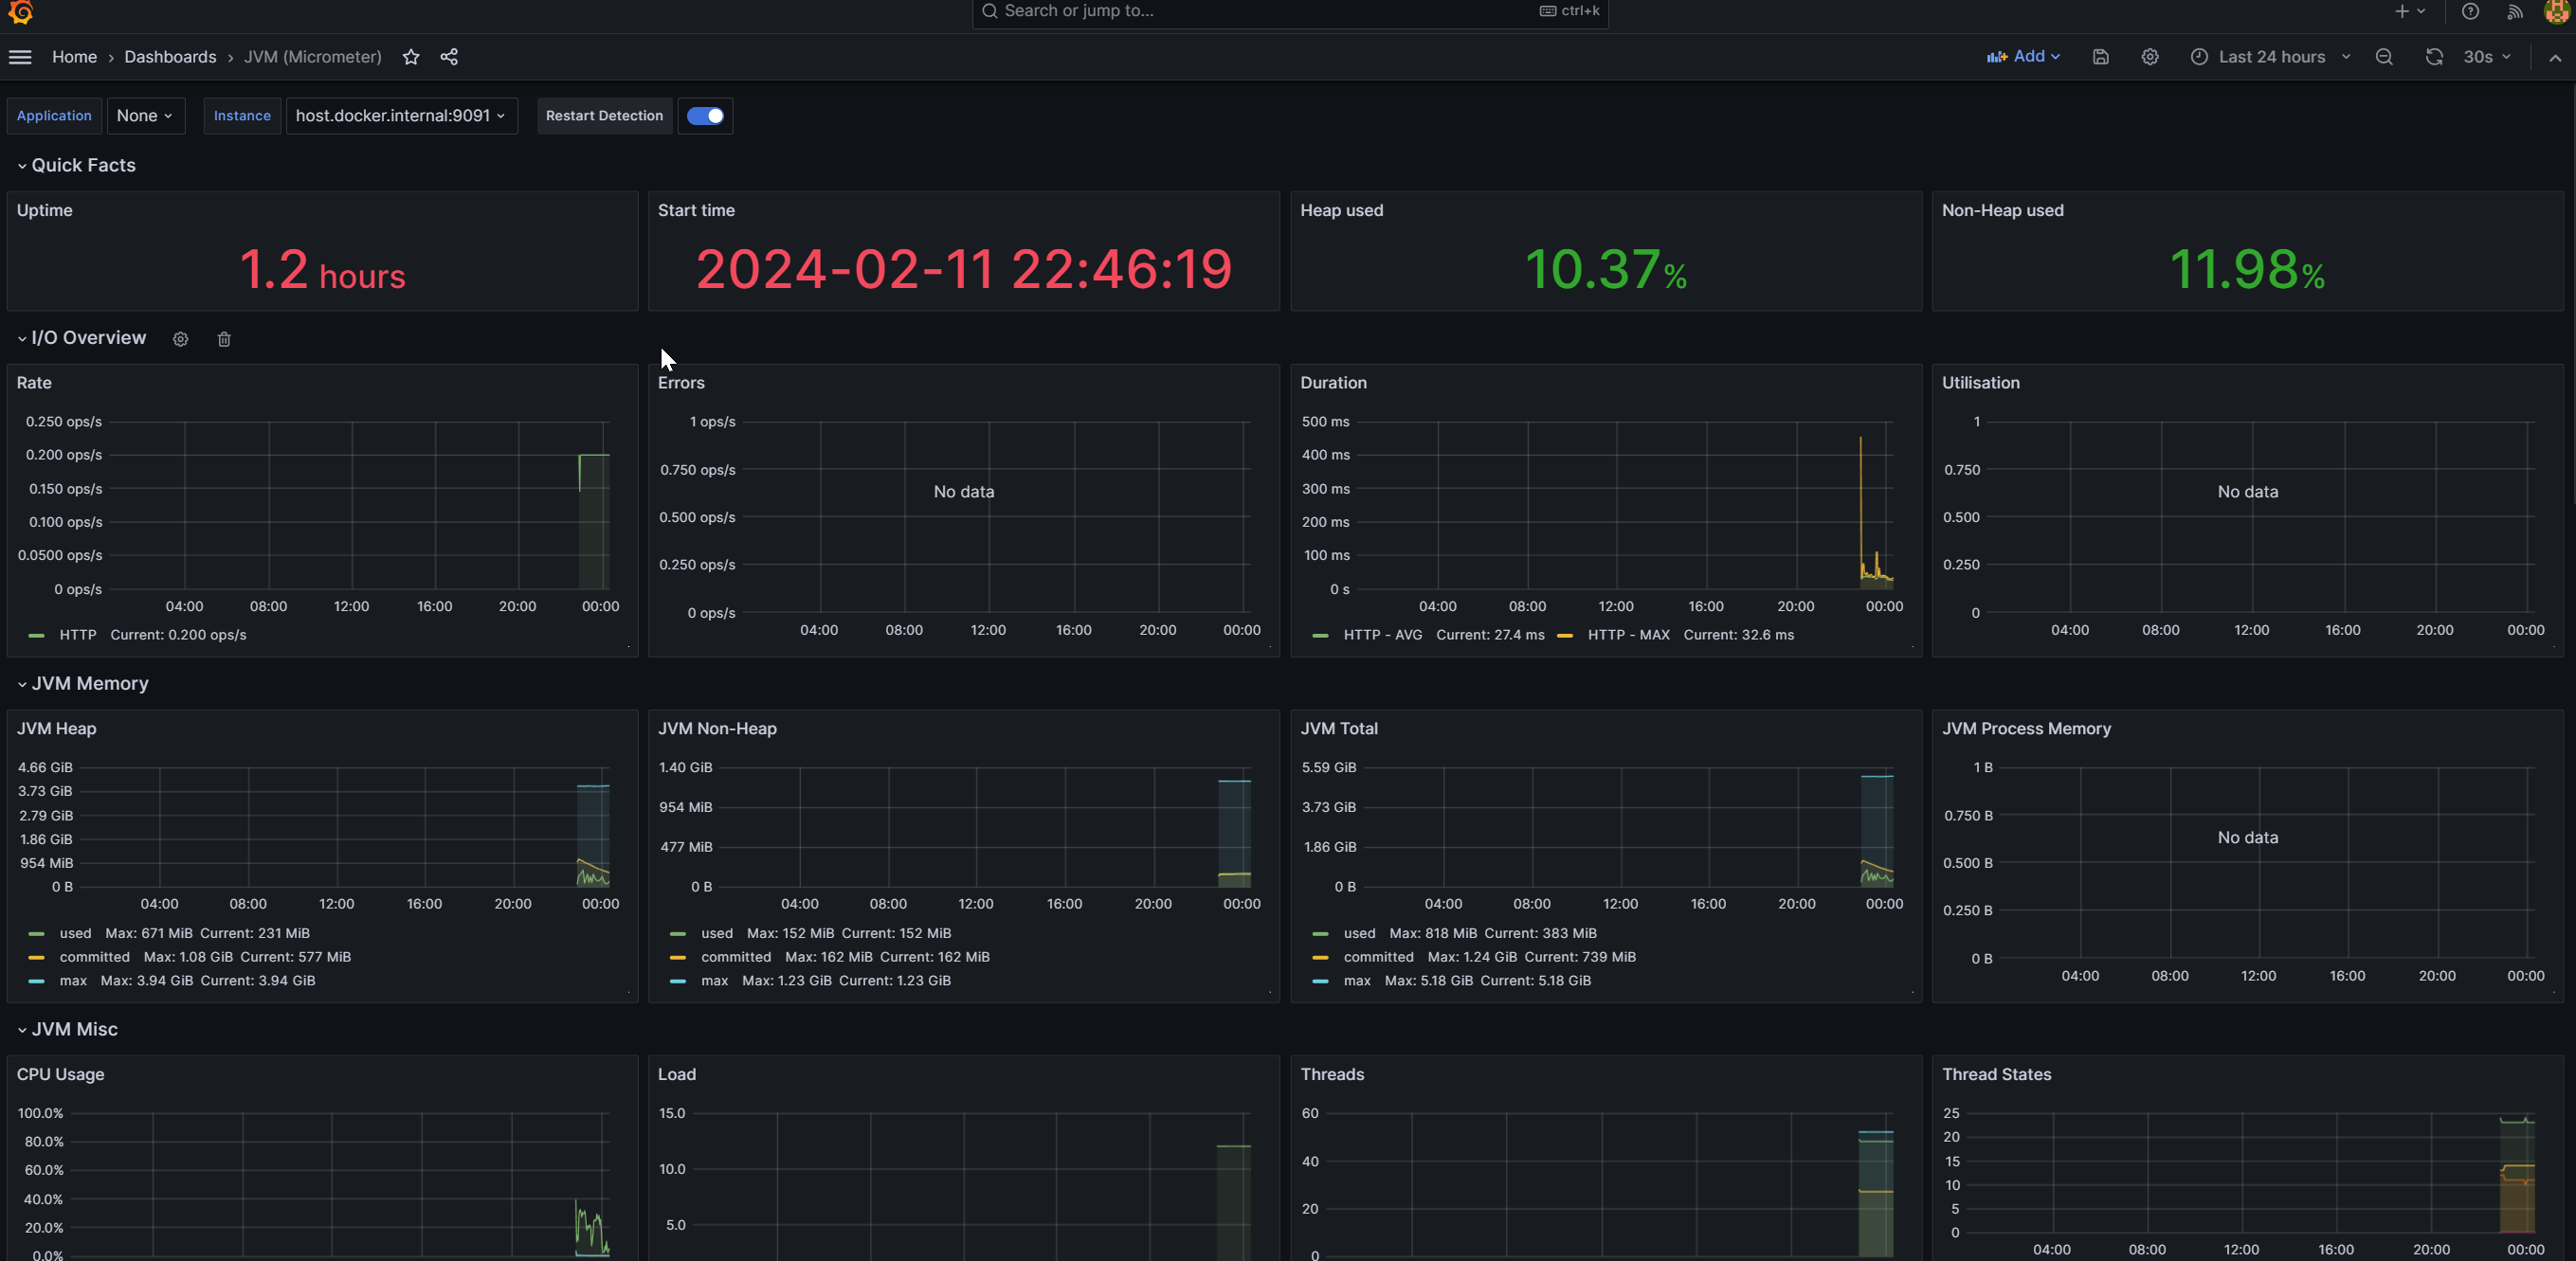
11378 UUID 의 시각화 템플릿을 적용 시켰다.
📗 정리
Spring Boot 서버의 CPU 사용량 과 새로운 기술을 프로젝트에 추가 시켰을때 어떤 부하 가 발생하는지 확인 하고 싶어 Prometheus 와 Grafana 를 적용 시켜 봤다.
아직 적용만 시켜놓고 어떤 방식으로 측정이 되는지 확인을 못해 봤기 때문에 다양한 시도를 통해 숙련이 되어야 할 것 같다.
Mysql Polling 와 RabbitMQ 를 비교해서 프로젝트에 미치는 정도를 확인하여 Server Connection 에서 사용될 기술을 선정 할 것 이다.
참고 사이트
https://jojaeng2.tistory.com/82
https://www.devkuma.com/docs/prometheus/spring-boot/
당시 가지고 있던 기술 개념으로 작성된 글 이므로 정확하지 않을 수 있으며 문제가 발견 된다면 수정 하겠습니다.