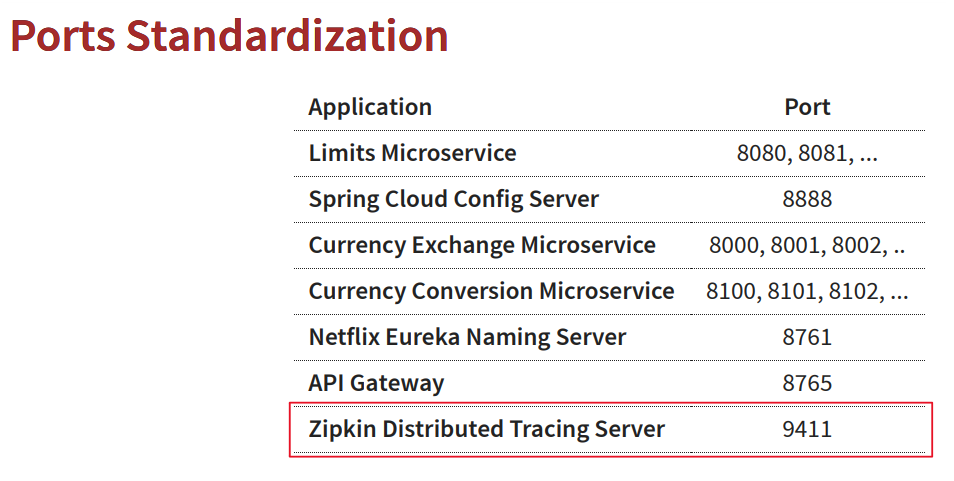
포트 구성
도커 허브 zipkin
목표
- zipkin을 위한 Java 프로젝트를 만드는 대신 docker 컨테이너로 실행
- Exchange Microservice과 같은 모든 마이크로서비스의 추적 정보를 Zipkin으로 확인
docker로 zipkin 실행
docker run -p 9411:9411 openzipkin/zipkin:2.23브라우저 접속 테스트

시작 전..
간단한 시나리오를 생각해 보죠
여러 개의 마이크로서비스를 통해 요청이
들어왔는데 시간이 오래 걸려요
네 각 마이크로서비스에 사용되는
시간을 알 수 있고 어떤 마이크로서비스에
가장 많은 시간이 소요되는지 알 수 있습니다
그래서 분산 추적이라는 게 정말 유용하죠
마이크로 백신에 대한 요청을 추적할 수 있어요
요청에 대한 세부 사항도 알 수 있고
이런 마이크로서비스에 소요된 시간도 알 수 있습니다
Distributed Tracing(분산 추적)을 구현하는 가장 인기 있는 도구는 Zipkin이라는 거죠
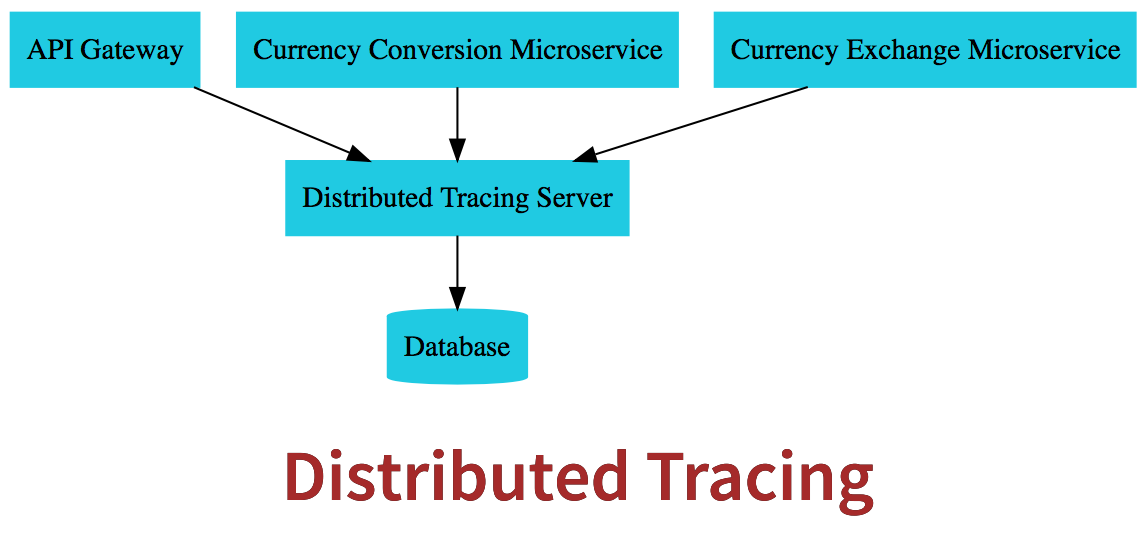
분산 추적은 각 마이크로서비스들이
분산 추적 서버로 추적 정보를 보내는 방식입니다
분산 추적 서버는 모든 정보를 데이터베이스에 저장하고 UI를 제공합니다
UI에 대한 쿼리를 내 실행된 요청에 대한 정보를 찾을 수 있습니다
네 그래서
API Gateway, Conversion Microservice, Exchange Microservice 모두
분산 추적 서버로 추적 정보를 전송해요
네 이 단계에서 할 일은 Exchange Microservice에서 분산 추적 서버로 정보를 보내는 겁니다
01. Currency Exchange Microservice
pom.xml
- 의존성 추가
		<groupId>io.micrometer</groupId>
		    <artifactId>micrometer-observation</artifactId>
		</dependency>

		<!-- OPTION 1: Open Telemetry as Bridge (RECOMMENDED) -->
		<!-- Open Telemetry
		    - Simplified Observability (metrics, logs, and traces) -->

		<dependency>
		    <groupId>io.micrometer</groupId>
		    <artifactId>micrometer-tracing-bridge-otel</artifactId>
		</dependency>

		<dependency>
		    <groupId>io.opentelemetry</groupId>
		    <artifactId>opentelemetry-exporter-zipkin</artifactId>
		</dependency>
스프링부 부트 3에서는 Micrometer를 사용하는 것을 권장합니다
Sleuth 은 trace만 다룰 수 있어요
하지만 마이크로미터는 로그, 메트릭스(지표), trace도 다룰 수 있죠
Micrometer가 업체 중립적인 응용 프로그램 관찰성 패이사드입니다
Micrometer is a vendor-neutral application observability facade
"vendor-neutral"은 특정 업체나 기술 스택에 종속되지 않는 것을 의미
이는 특정 모니터링 솔루션에 종속되지 않고, 다양한 메트릭을 수집하고 다양한 모니터링 도구에 데이터를 전송할 수 있도록 해줍니다.
OpenTelemetry는 공개적인 기준으로
로그, 메트릭, tracing 작업을 해요
(참고용) spring boot 2
- Sleuth 은 trace만 다룰 수 있어요
<!--
<dependency>
    <groupId>org.springframework.cloud</groupId>
    <artifactId>spring-cloud-starter-sleuth</artifactId>
</dependency>
<dependency>
    <groupId>org.springframework.cloud</groupId>
    <artifactId>spring-cloud-sleuth-brave</artifactId>
</dependency>
<dependency>
    <groupId>org.springframework.cloud</groupId>
    <artifactId>spring-cloud-sleuth-zipkin</artifactId>
</dependency>
-->
application.properties
- 샘플링 : 모든 마이크로서비스에 들어오는 모든 요청을 추적하면 성능에 큰 영향이 있을 겁니다
샘플링하고 싶은 요청의 퍼센트(%)를 구성할 수 있습니다 - 100% 추적은 1.0작성하고 5%만 추적하려면 0.05를 작성하면 된다
- 로그 패턴 : application name, traceId, spanId 나오게 할것임
management.tracing.sampling.probability=1.0 // 100% 추적, 5%추적시 0.05 이런식으로 작성
logging.pattern.level=%5p [${spring.application.name:},%X{traceId:-},%X{spanId:-}]
// 2023-11-19T06:20:28.665+09:00  INFO [currency-exchange,3909ebcc9e5c42845aef2ff8f70d42bd,70af809cf84c41ac]
CurrencyExchangeController - 수정
- 로깅 추가
@RestController
public class CurrencyExchangeController {
	private Logger logger = LoggerFactory.getLogger(CurrencyExchangeController.class); // 추가

	@Autowired
	private CurrencyExchangeRepository repository;

	@Autowired
	private Environment environment;

	@GetMapping("/currency-exchange/from/{from}/to/{to}")
	public CurrencyExchange retrieveExchangeValue(@PathVariable String from
												, @PathVariable String to) {


		logger.info("retrieveExchangeValue called with {} to {}", from, to);// 추가

		CurrencyExchange currencyExchange = repository.findByFromAndTo(from, to);
		if(currencyExchange == null) {
			throw new RuntimeException("Uable to Find data for " + from + " to " + to );
		}

		String port = environment.getProperty("local.server.port");
		currencyExchange.setEnvironment(port);

		return currencyExchange;
	}
}
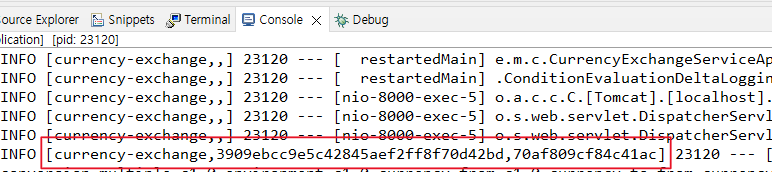
로그가 찍히면 application.properties에 설정한 log.pattern.level이 수정되어
application name, traceId, spanId이 앞에 찍히는 것이 보입니다
traceId, spanId 이 두 ID가 정말 중요해요
네 여러 개의 마이크로서비스의 요청을 추적할 수 있습니다
요청을 추적하기 위해서는 할당된 ID가 있어야 합니다
마이크로미터가 하는 일이 그거예요
마이크로미터가 특정 요청에 ID를 부여하죠
03. Api Gateway, Conversion MicroService
- Api Gateway, Conversion MicroService에
- 분산 추적을 위해 똑같이 pom.xml, application.properties 작성
pom.xml - (Api Gateway, Conversion MicroService)
- 의존성 추가
		<groupId>io.micrometer</groupId>
		    <artifactId>micrometer-observation</artifactId>
		</dependency>

		<!-- OPTION 1: Open Telemetry as Bridge (RECOMMENDED) -->
		<!-- Open Telemetry
		    - Simplified Observability (metrics, logs, and traces) -->

		<dependency>
		    <groupId>io.micrometer</groupId>
		    <artifactId>micrometer-tracing-bridge-otel</artifactId>
		</dependency>

		<dependency>
		    <groupId>io.opentelemetry</groupId>
		    <artifactId>opentelemetry-exporter-zipkin</artifactId>
		</dependency>
application.properties - (Api Gateway, Conversion MicroService)
management.tracing.sampling.probability=1.0 // 100% 추적, 5%추적시 0.05 이런식으로 작성
logging.pattern.level=%5p [${spring.application.name:},%X{traceId:-},%X{spanId:-}]
// 2023-11-19T06:20:28.665+09:00  INFO [currency-exchange,3909ebcc9e5c42845aef2ff8f70d42bd,70af809cf84c41ac]
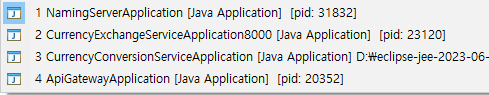
현재 실행중인 applications
- gate way도 사용할 것이기 때문에 유레카 네이밍서버도 실행
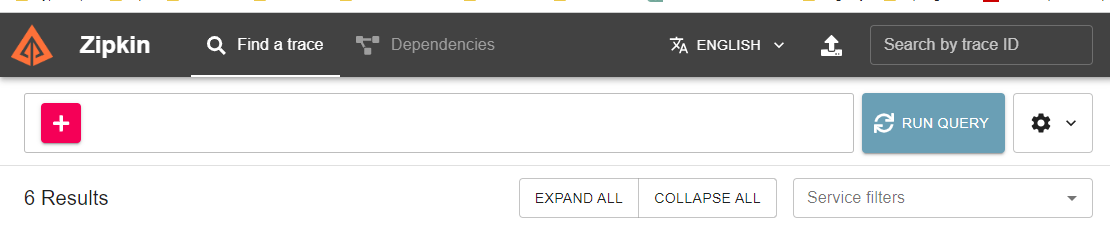
요청 테스트, 집킨 확인
- 요청 테스트
http://localhost:8100/currency-conversion/from/USD/to/INR/quantity/10
http://localhost:8100/currency-conversion-feign/from/USD/to/INR/quantity/10
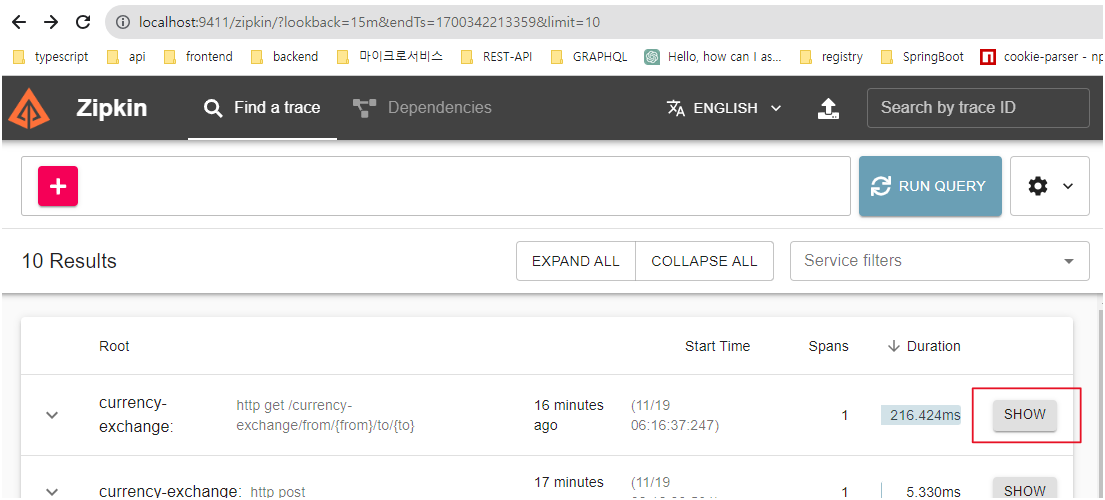
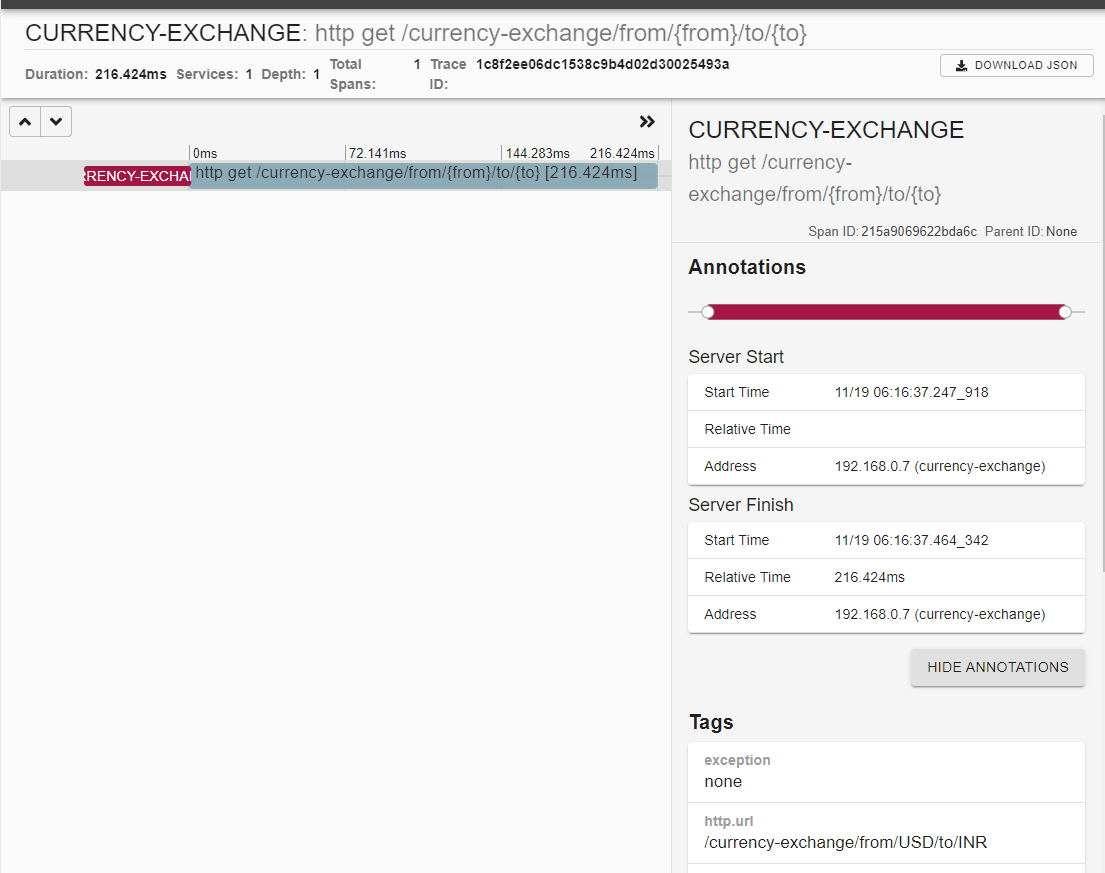
http://localhost:8765/currency-conversion/from/USD/to/INR/quantity/10- 집킨 확인
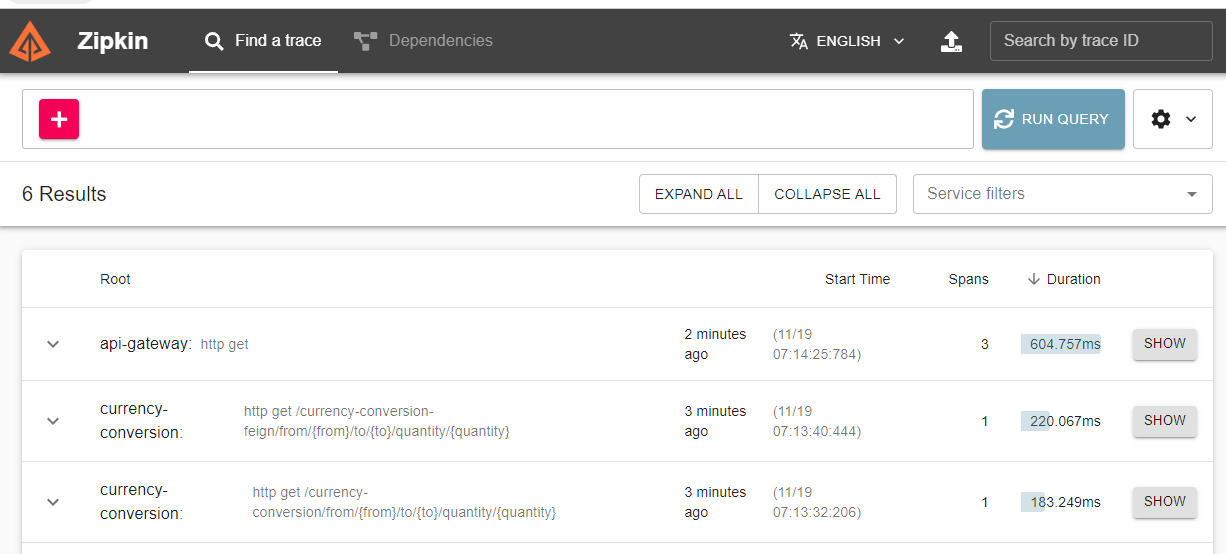
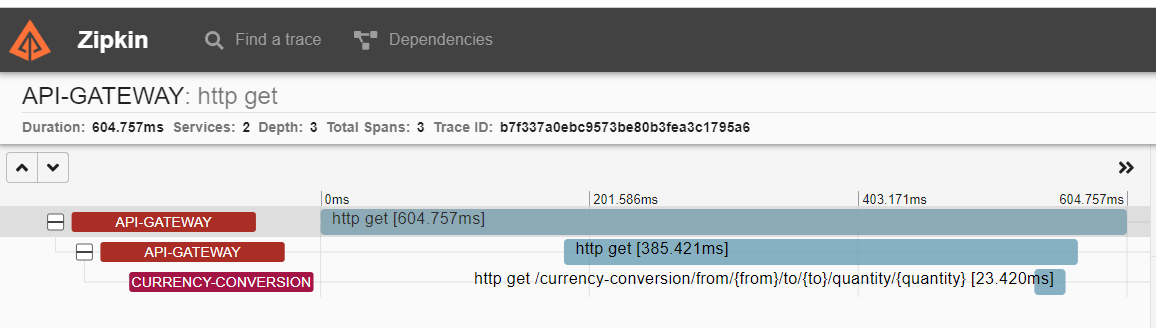
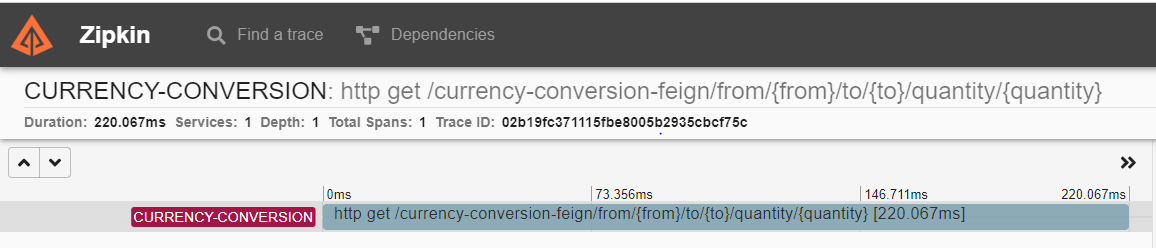
이 요청들을 보면 공통점이
Currency Conversion에서 Currency Exchage로 요청을 보내는 추적은 할 수가 없다..
그래서 추가적인 설정이 필요함
01. feign 요청 수정
Currency Conversion - 수정
- Conversion에서 Exchange로 요청을 추적하기 위해 의존성 추가
pom.xml
- 추적을 위한 feign-micrometer 의존성 추가
<!-- COMMON CHANGES + -->
<!-- Enables tracing of REST API calls made using Feign - V3 ONLY-->
<dependency>
<groupId>io.github.openfeign</groupId>
<artifactId>feign-micrometer</artifactId>
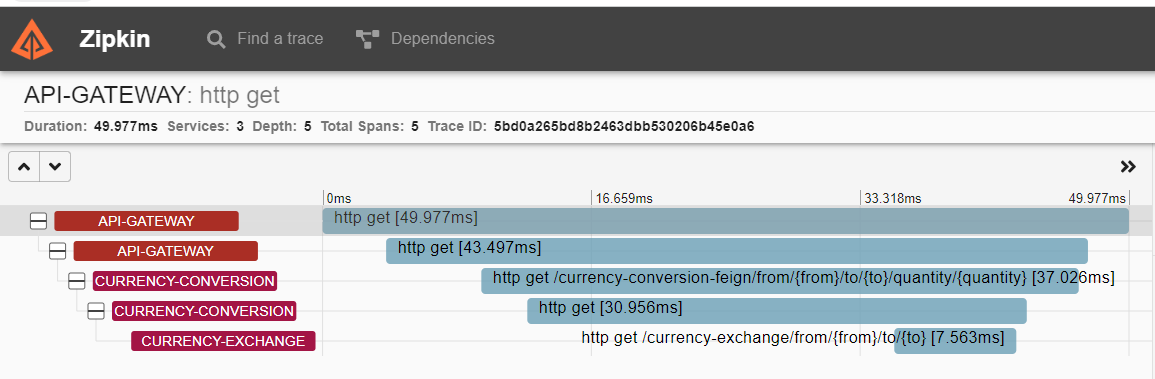
</dependency>/currency-conversion-feign/from/USD/to/INR/quantity/10 테스트
- http://localhost:8765/currency-conversion-feign/from/USD/to/INR/quantity/10
- 다시 요청하면 Conversion에서 Exchange로 요청을 추적이 가능하다
02. RestTemplate 요청 수정
CurrencyConversionController - RestTemplate Bean 추가
- RestTemplate로 요청하는건 아직 추적이 안된 상태라 코드 추가 및 변경
// 추가
@Configuration(proxyBeanMethods = false)
class RestTemplateConfiguration {

    @Bean
    RestTemplate restTemplate(RestTemplateBuilder builder) {
        return builder.build();
    }
}
// 추가

@RestController
public class CurrencyConversionController {

	@Autowired
	private CurrencyExchangeProxy proxy;

    // 추가
    @Autowired
    private RestTemplate restTemplate;

	@GetMapping("/currency-conversion/from/{from}/to/{to}/quantity/{quantity}")
	public CurrencyConversion calculateCurrencyConversion(@PathVariable String from
														, @PathVariable String to
														, @PathVariable BigDecimal quantity) {


		HashMap<String, String> uriVariables = new HashMap<>();
		uriVariables.put("from", from);
		uriVariables.put("to", to);

//		ResponseEntity<CurrencyConversion> responseEntity = new RestTemplate().getForEntity
		// 변경
		ResponseEntity<CurrencyConversion> responseEntity = restTemplate.getForEntity(
										"http://localhost:8000/currency-exchange/from/{from}/to/{to}"
										, CurrencyConversion.class
										, uriVariables);


		CurrencyConversion currencyConversion = responseEntity.getBody();

		return new CurrencyConversion(currencyConversion.getId()
									, from, to, quantity
									, currencyConversion.getConversionMultiple()
									, quantity.multiply(currencyConversion.getConversionMultiple())
									, currencyConversion.getEnvironment());
	}
/currency-conversion/from/USD/to/INR/quantity/10 테스트