
5 CRYPTO TRACKER
#5.13 ~ 5.16 2023.04.10 (월)
5.13 Price Chart part Two (ApexCharts)
이번에는 API에서 받아온 data를 시각화 해볼거임.
APEXCHART는 수 많은 차트들을 만들 수 있는 자바스크립트 chart library임.
ApexCharts 세팅
Apex공식홈페이지의 docs/integrations/react에 들어가서 밑의 명령어로 설치해줌.
npm install --save react-apexcharts apexcharts//Chart.tsx
import { useQuery } from "react-query";
import { fetchCoinHistory } from "../api";
import ApexChart from "react-apexcharts"; // 1. import 해오기
interface IHistorical {
time_open: number;
time_close: number;
open: string;
high: string;
low: string;
close: string;
volume: string;
market_cap: number;
}
interface ChartProps {
coinId: string;
}
function Chart({ coinId }: ChartProps) {
const { isLoading, data } = useQuery<IHistorical[]>(["ohlcv", coinId], () =>
fetchCoinHistory(coinId)
);
console.log(data);
console.log(data?.map((price) => parseFloat(price.close)));
return (
<div>
{isLoading ? (
"Loading chart"
) : (
<ApexChart
type="line"
series={[
{
name: "Price",
data: data?.map((price) => parseFloat(price.close)) ?? [],
},
]}
options={{
theme: {
mode: "dark",
},
chart: {
height: 300,
width: 500,
toolbar: {
show: false,
},
background: "transparent",
},
grid: { show: false },
stroke: {
curve: "smooth",
width: 4,
},
yaxis: {
show: false,
},
xaxis: {
axisBorder: { show: false },
axisTicks: { show: false },
labels: { show: false },
},
}}
/>
)}
</div>
);
}
export default Chart;- Chart.tsx 파일에가서 Chart는 원래의 컴포넌트와 겹치니
ApexChart를 import 해옴. {isLoading ? "Loading chart" : <ApexChart/>}: 삼항연산자로 isLoading이 true면 "Loading chart"라는 문자가 보이게 false면<ApexChart/>가 보이게 return 해줌.- 공식 홈페이지의 수 많은 options들을 참고해서 위와 같이 property들을 자동완성 기능으로 작성하면 됨.
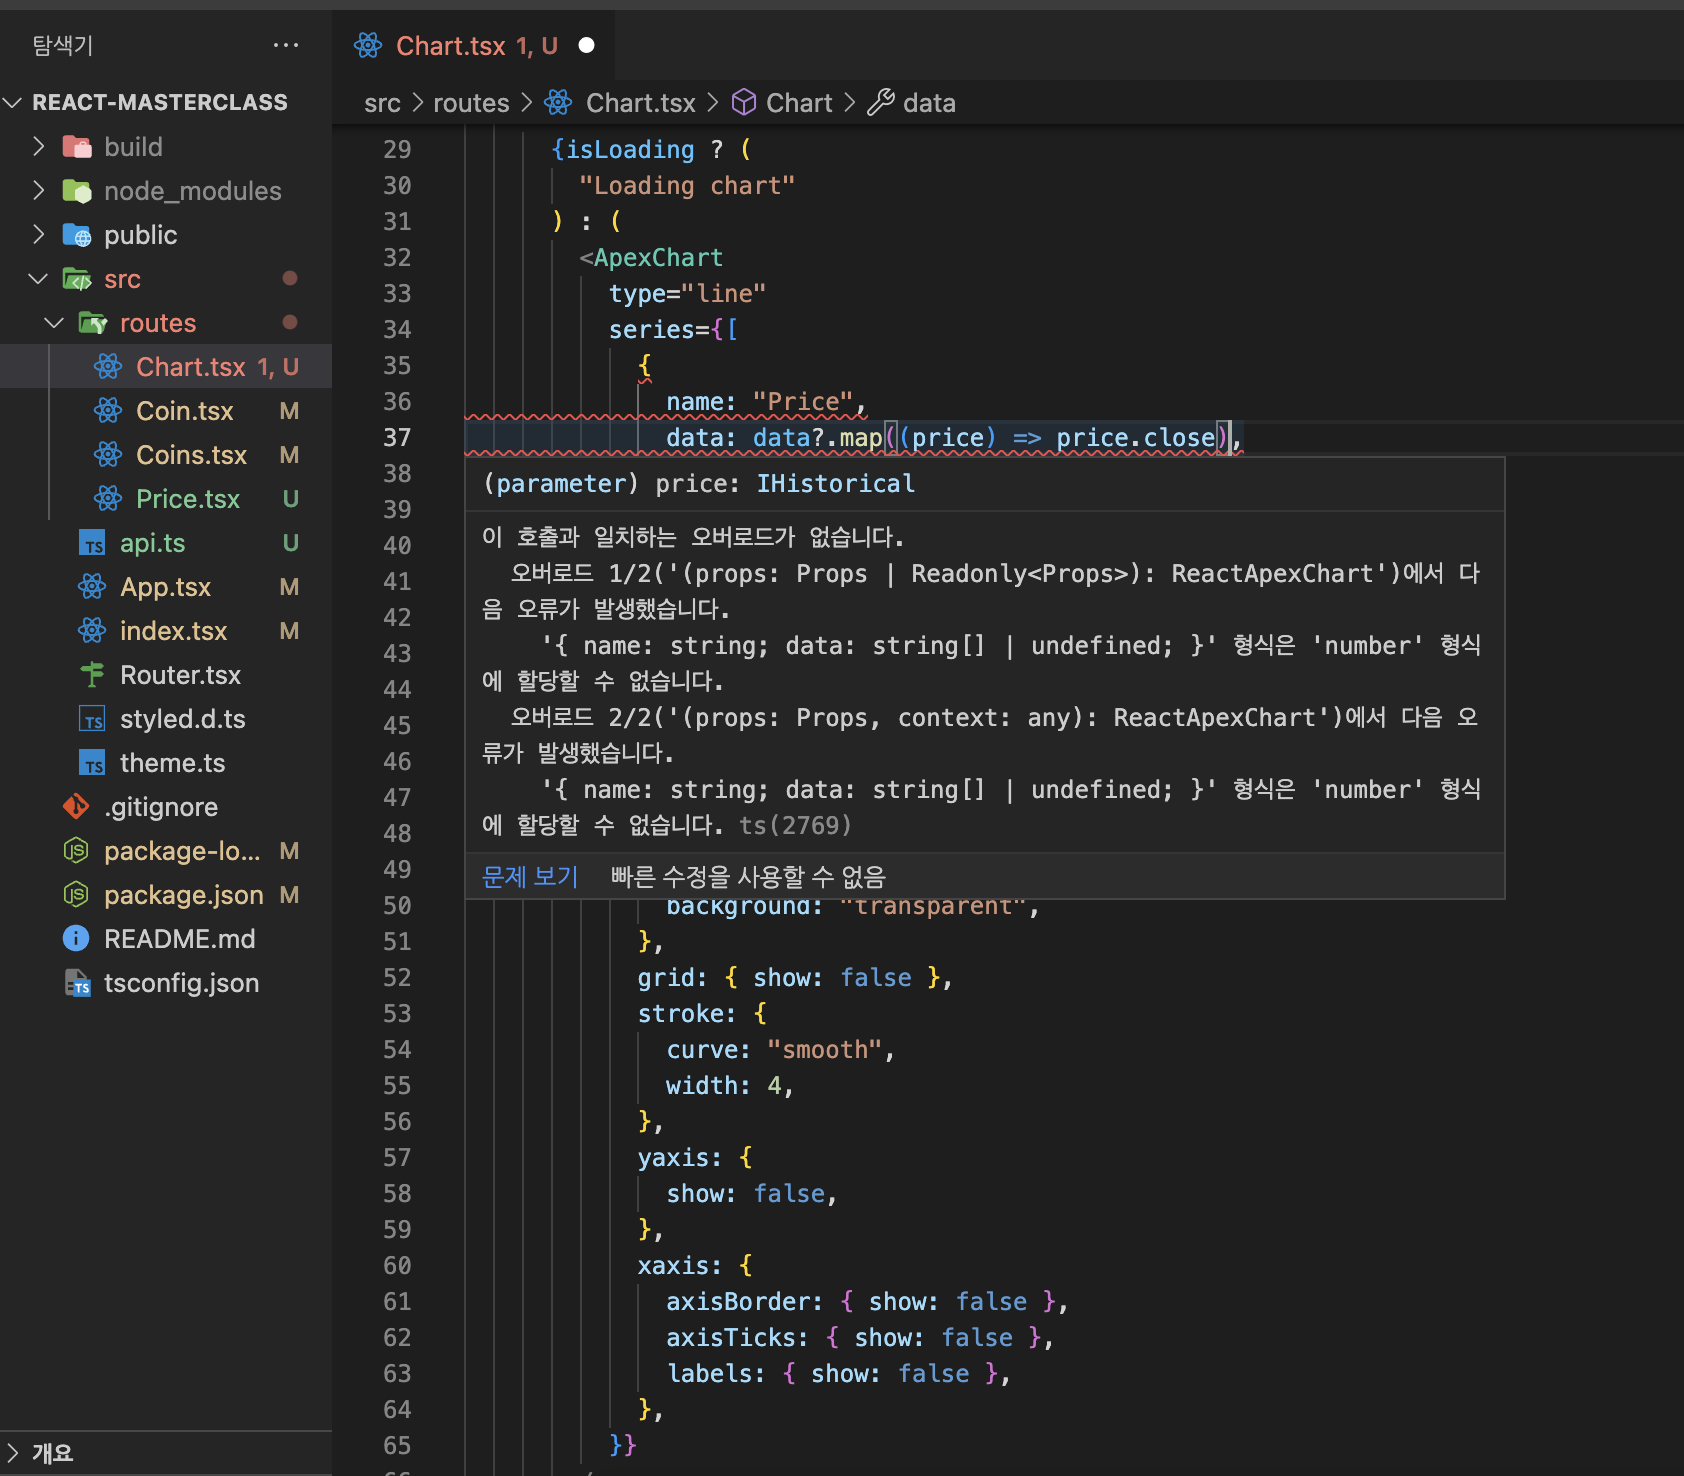 위와 같이 코드를 작성했을때 오류가 났는데, 강의에서 제공해준 API는 close 데이터가 string이기 때문에 parseFloat를 통해 형 변환을 시켜줘야 했음.
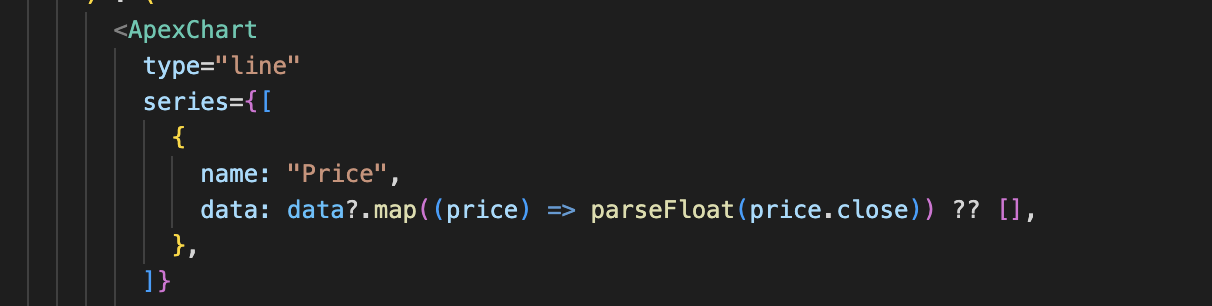 위와 같이 작성해서 오류 해결함!
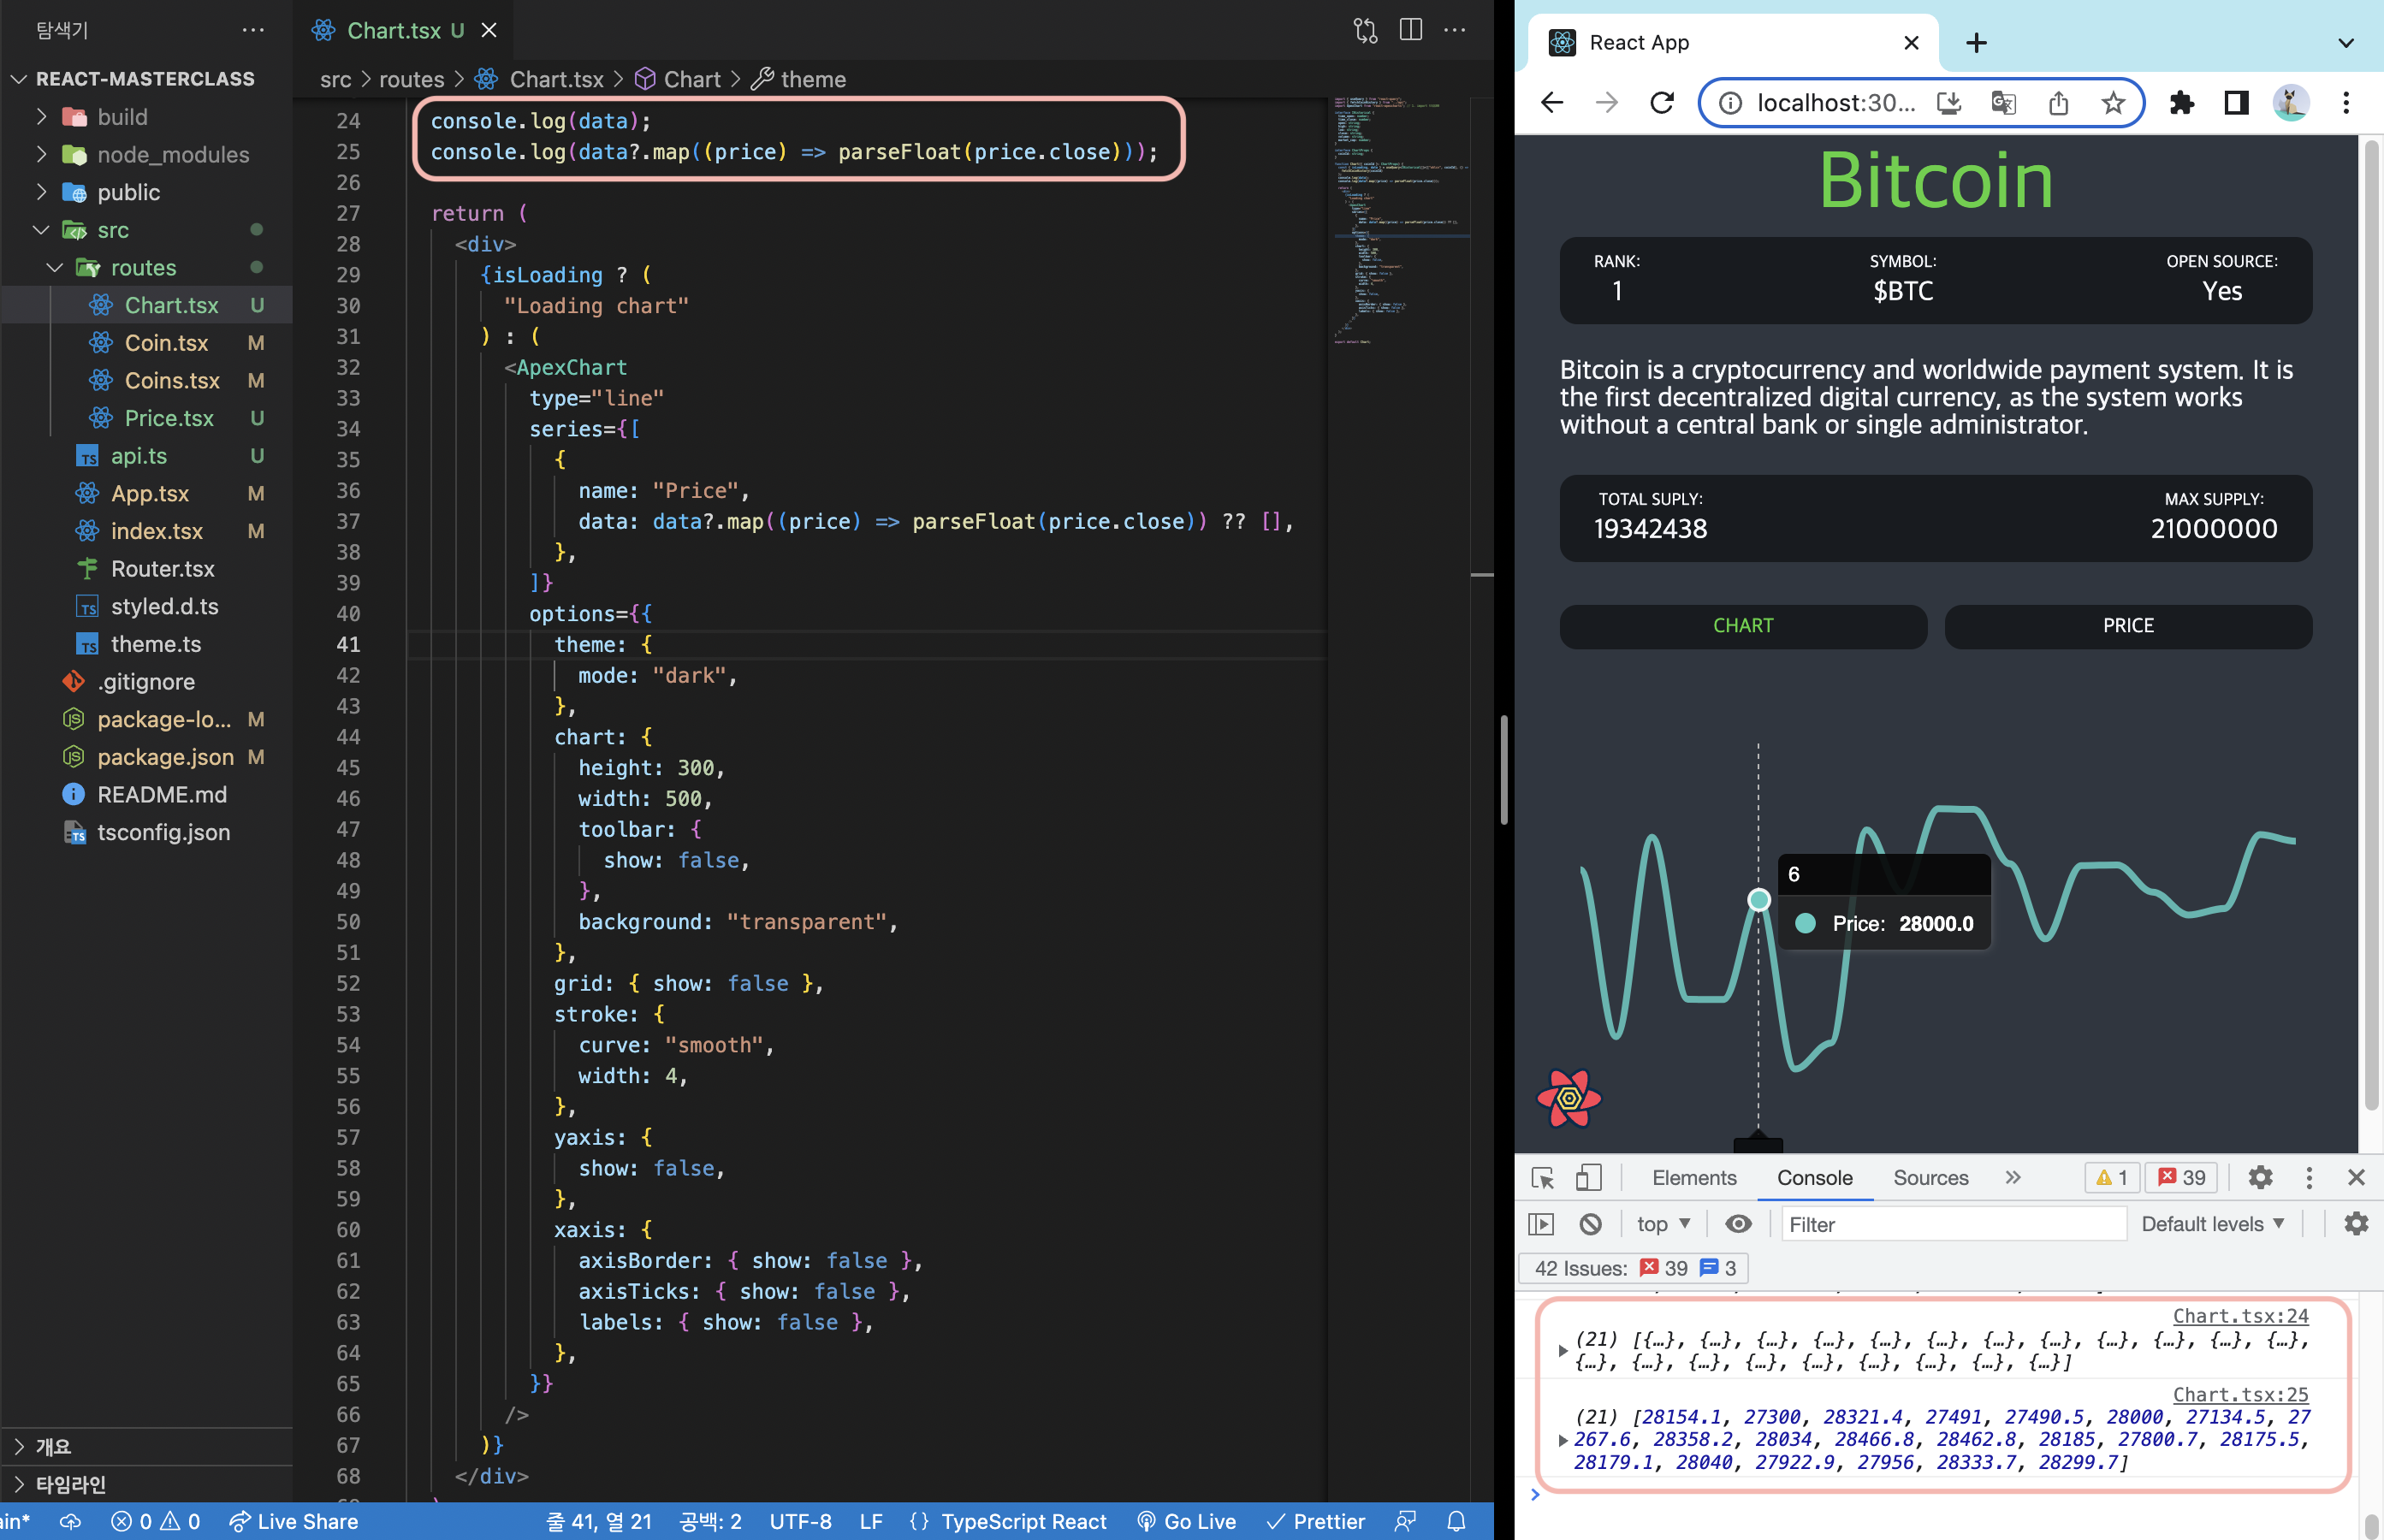
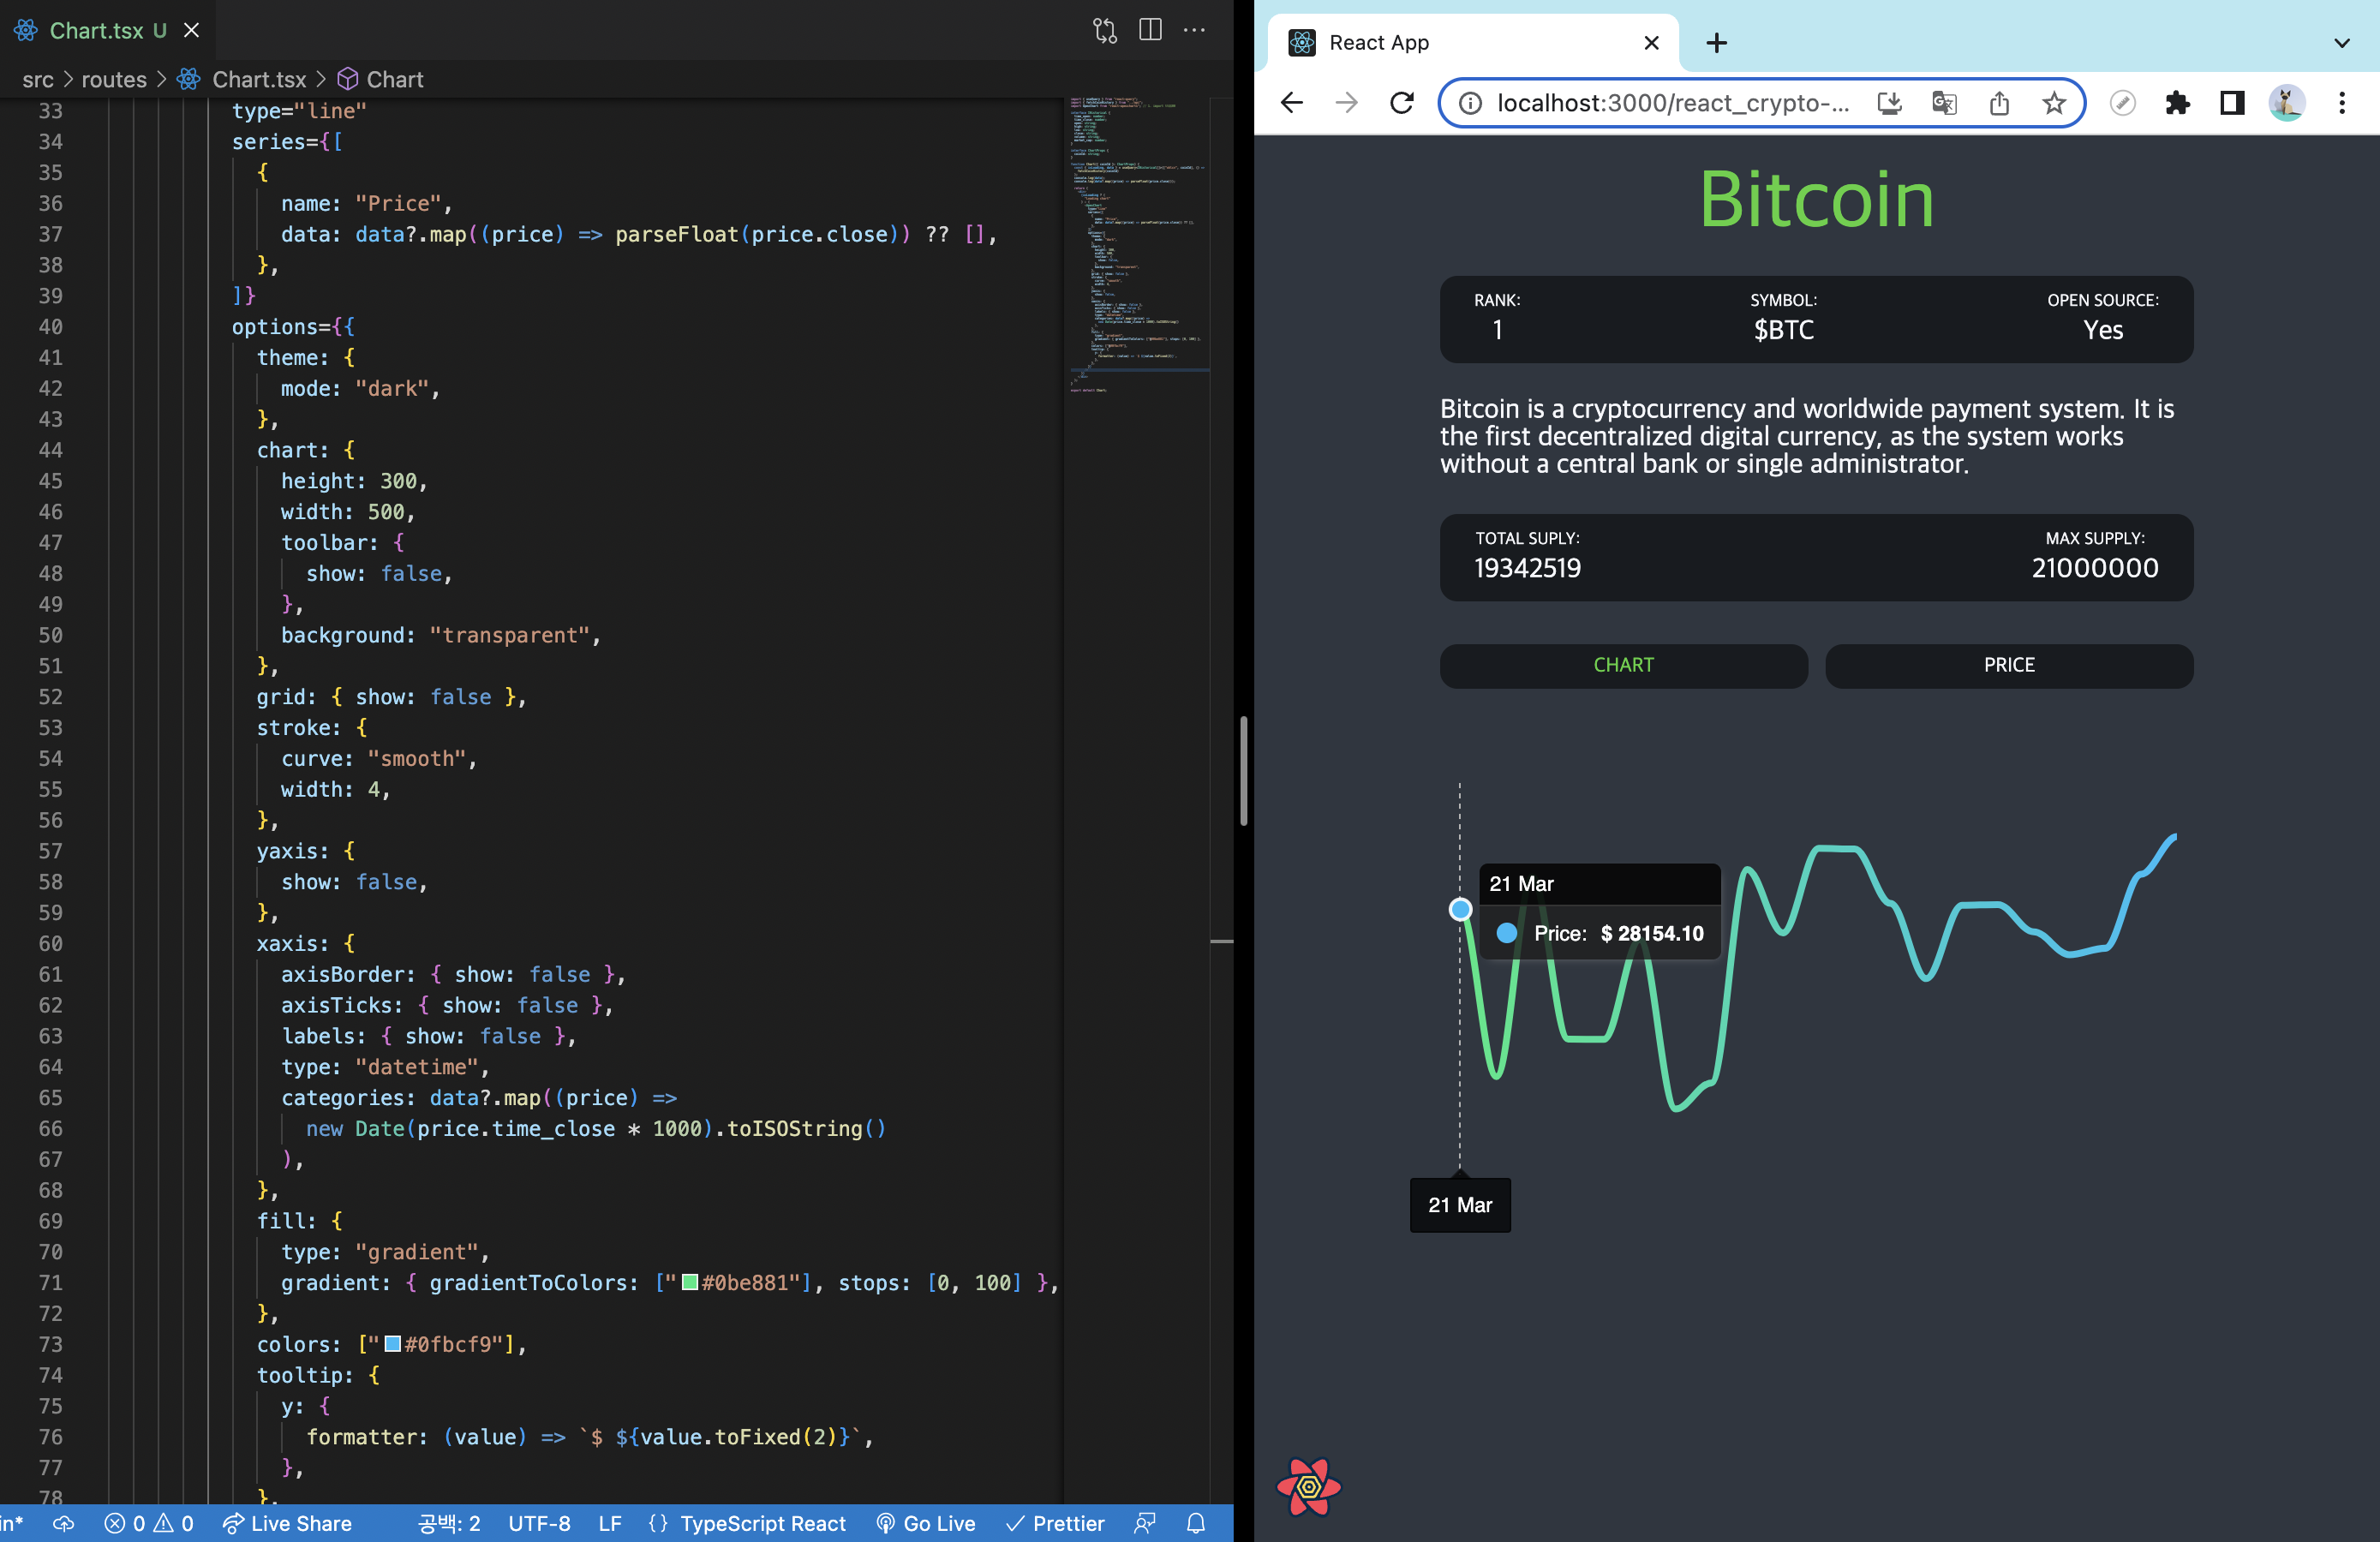
결과화면 ↓
5.14 Price Chart part Three
차트를 좀 더 예쁘게 꾸며보자.
//Chart.tsx
import { useQuery } from "react-query";
import { fetchCoinHistory } from "../api";
import ApexChart from "react-apexcharts"; // 1. import 해오기

interface IHistorical {
  time_open: number;
  time_close: number;
  open: string;
  high: string;
  low: string;
  close: string;
  volume: string;
  market_cap: number;
}

interface ChartProps {
  coinId: string;
}

function Chart({ coinId }: ChartProps) {
  const { isLoading, data } = useQuery<IHistorical[]>(["ohlcv", coinId], () =>
    fetchCoinHistory(coinId)
  );
  console.log(data);
  console.log(data?.map((price) => parseFloat(price.close)));

  return (
    <div>
      {isLoading ? (
        "Loading chart"
      ) : (
        <ApexChart
          type="line"
          series={[
            {
              name: "Price",
              data: data?.map((price) => parseFloat(price.close)) ?? [],
            },
          ]}
          options={{
            theme: {
              mode: "dark",
            },
            chart: {
              height: 300,
              width: 500,
              toolbar: {
                show: false,
              },
              background: "transparent",
            },
            grid: { show: false },
            stroke: {
              curve: "smooth",
              width: 4,
            },
            yaxis: {
              show: false,
            },
            xaxis: {
              axisBorder: { show: false },
              axisTicks: { show: false },
              labels: { show: false },
              type: "datetime",
              categories: data?.map((price) =>
                new Date(price.time_close * 1000).toISOString()
              ),
            },
            fill: {
              type: "gradient",
              gradient: { gradientToColors: ["#0be881"], stops: [0, 100] },
            },
            colors: ["#0fbcf9"],
            tooltip: {
              y: {
                formatter: (value) => `$ ${value.toFixed(2)}`,
              },
            },
          }}
        />
      )}
    </div>
  );
}

export default Chart;- y: {formatter: (value) =>
$ ${value.toFixed(2)},}- toFixed로 소수점 뒤의 숫자들을 2개로 줄임. (ex: 54.24245 -> 54.24)
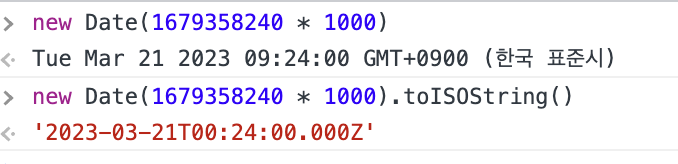
categories: data?.map((price) => new Date(price.time_close * 1000).toISOString())- xaxis의 categories 옵션으로 데이터가 날짜 형태로 나오게 만듦.
price.time_close를 밀리초로 바꾸기 위해 1000을 곱해줌. 밑의 콘솔창 예시 참고하기
- xaxis의 categories 옵션으로 데이터가 날짜 형태로 나오게 만듦.
결과화면 ↓
apex chart의 옵션들을 다 찾는게 어렵다면 Demos를 살펴보는 것이 배우기 가장 좋은 방법임! 만들어진 코드를 보면서 어떻게 data를 구조화했고 어떻게 커스텀했는지 살펴보면 좋음.
5.15 Final Touches
마지막으로 좀 더 바꿔보자.
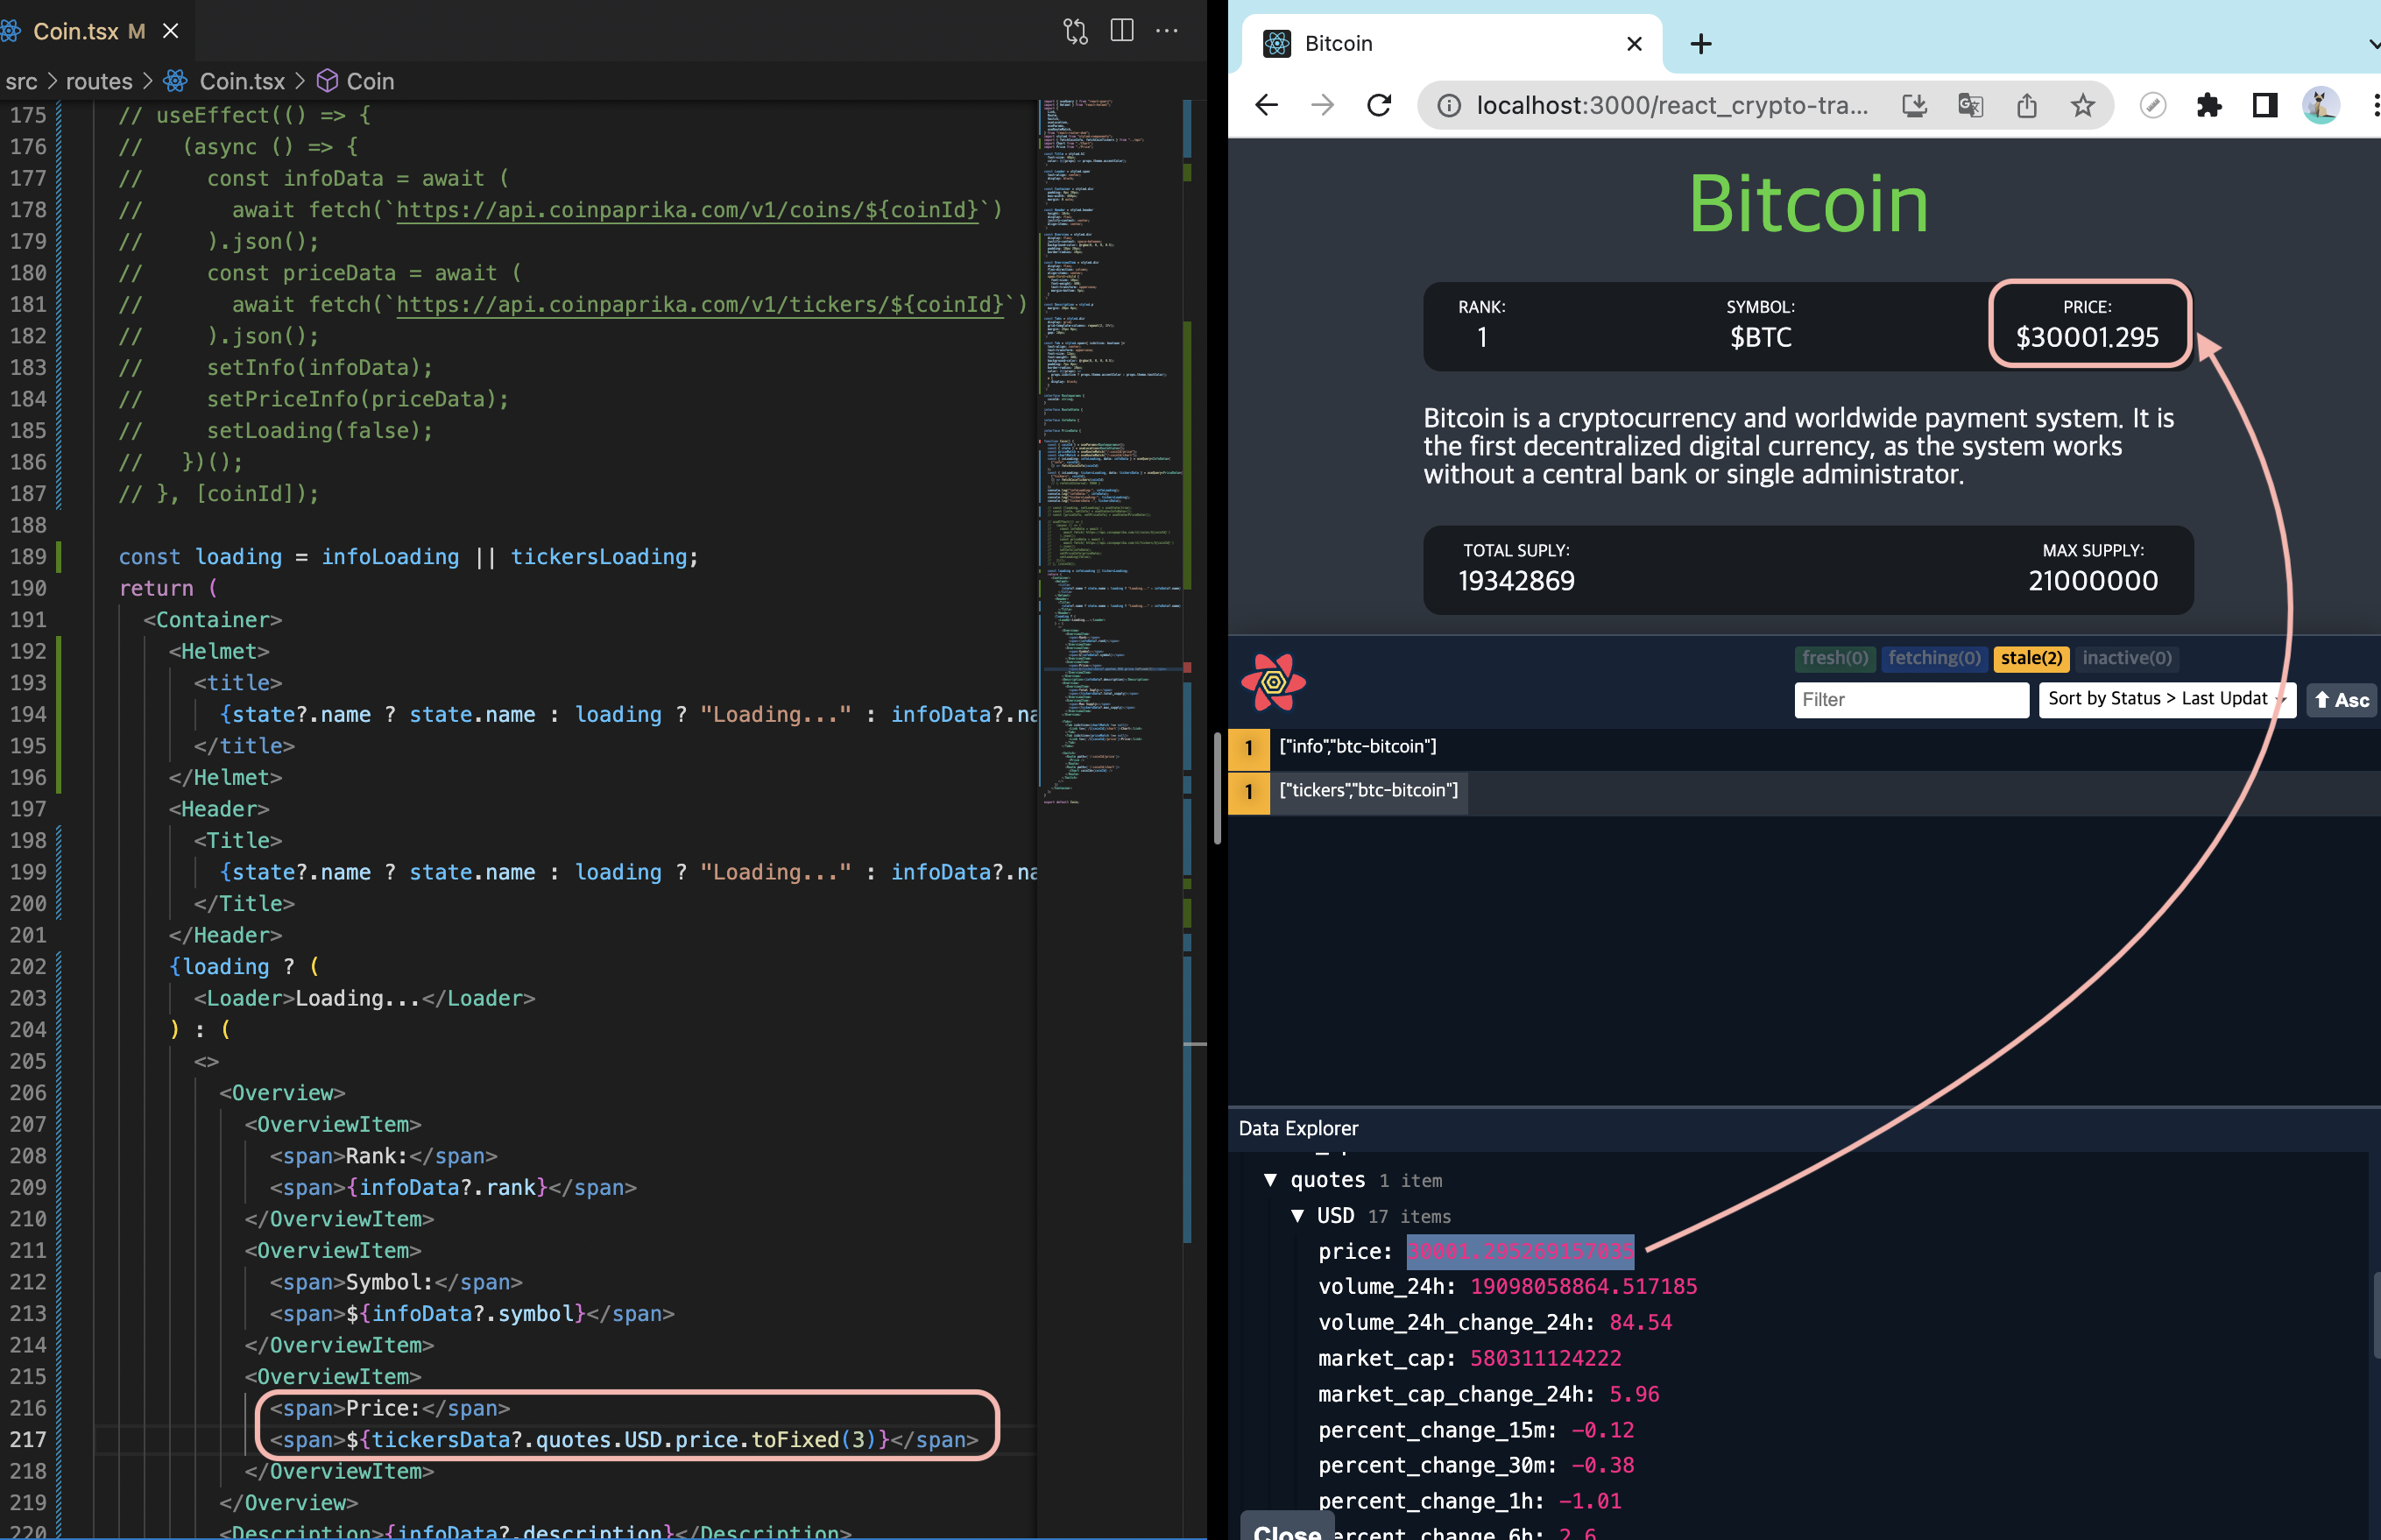
- 위와 같이 코인의 가격이 보이도록 코드를 고쳐주고 소수점 3자리만 보이게 해줌.
이제 코인의 가격이 실시간으로 보여주기 위해 5초마다 fetching을 할거임.
 const { isLoading: tickersLoading, data: tickersData } = useQuery<PriceData>(
    ["tickers", coinId],
    () => fetchCoinTickers(coinId),
    { refetchInterval: 5000 }
)- useQuery 훅의 3번째 argument도 쓸 수 있는데 3번째는 선택적인 object이며 원한다면 refetch interval을 밀리세컨드단위로 할 수 있음.위와 같이 5000ms(5초)로 설정함.
- query를 5초마다 refetch하면서 실시간으로 가격이 바뀔거임.
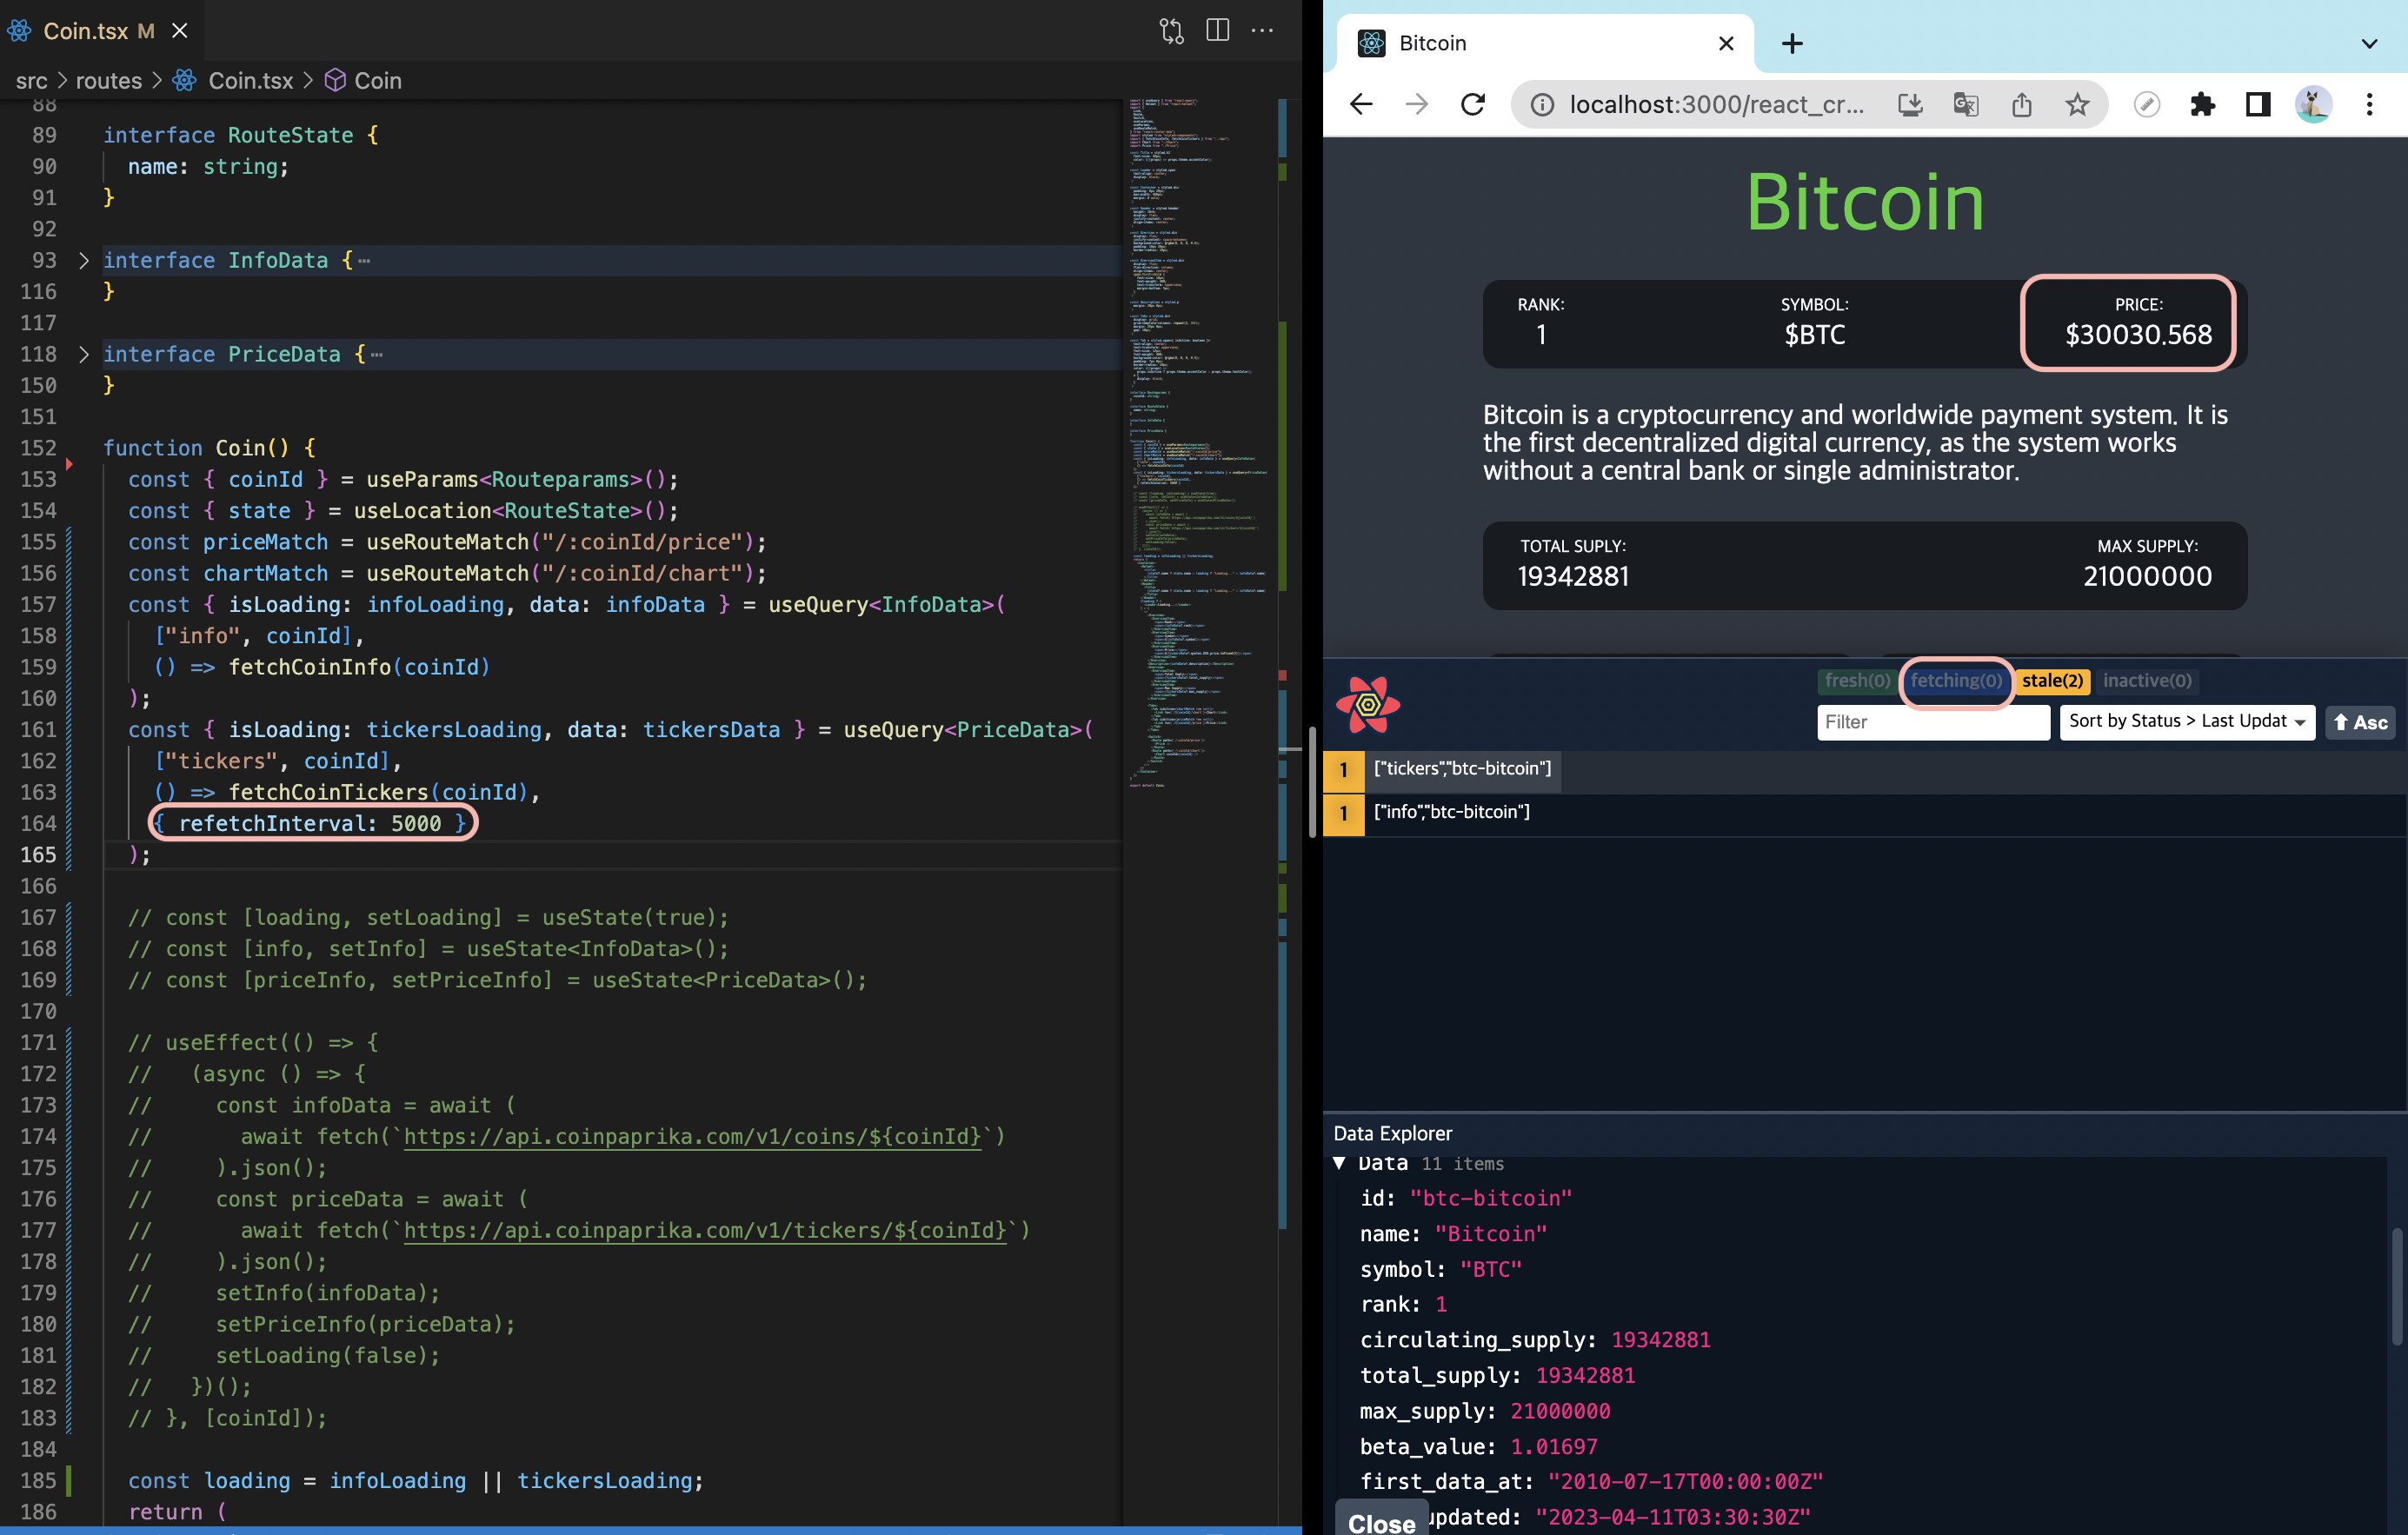
- query devtools로 5초마다 fetching 처리되는 것을 확인가능.
- 코인가격이 실시간으로 업데이트 됨.
React Helmet
마지막으로 위의 제목을 바꿔볼건데 이걸 하기 위해선 React Helmet을 사용해야 함.
npm i react-helmet
npm i --save-dev @types/react-helmet
첫번째 명령어로 설치해주고 타입스크립트는 react-helmet을 모르기 때문에 두번째 명령어도 설치해주자.
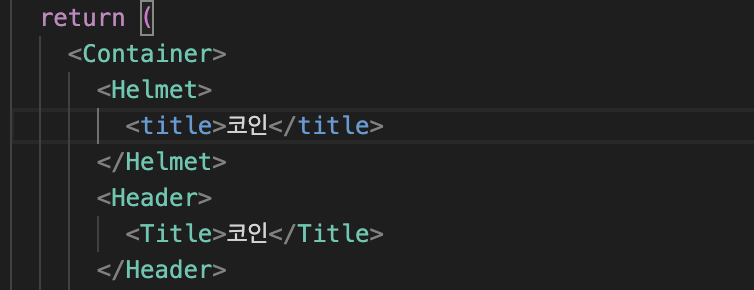
//coin.tsx
import { Helmet } from "react-helmet"; // 1. import하기


function Coin() {
  //코드생략
  //state: { name: coin.name }
  return (
    <Container>
     <Helmet>
        <title>
          {state?.name ? state.name : loading ? "Loading..." : infoData?.name}
        </title>
      </Helmet>

      <Header> //원래 있었던 코드
        <Title>
          {state?.name ? state.name : loading ? "Loading..." : infoData?.name}
        </Title>
      </Header>
    </Container>
  );
}

export default Coin;- 먼저 import 해주고
<Helmet>컴포넌트를 만들어서 안에title태그를 render해 줌. 여기서 무엇을 render하던 그게 문서의 head로 감. - title은 코인 화면의 title과 같도록 만듦.
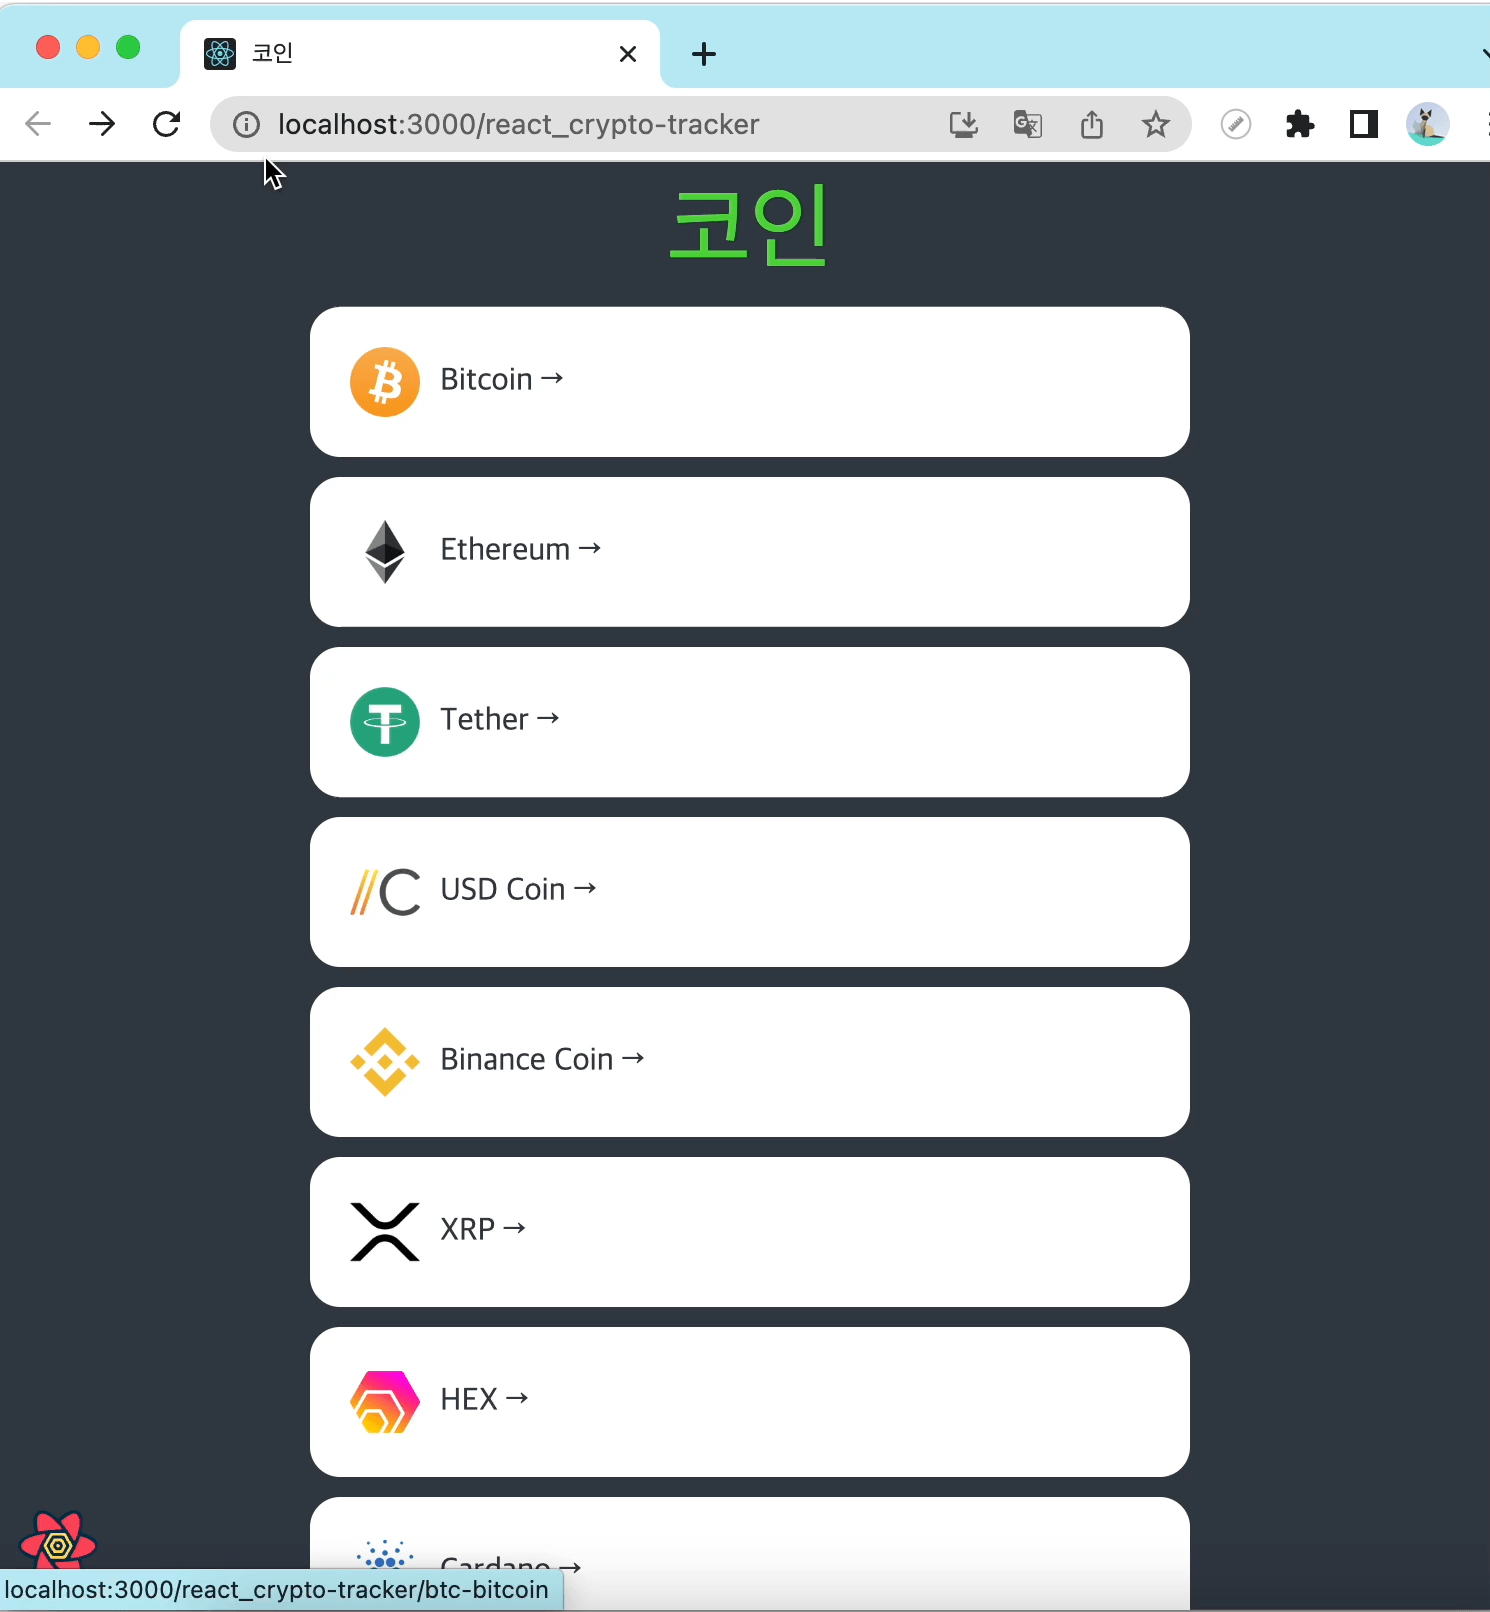
- 홈페이지로 가서도 코인이 title이 되도록 해줌.
- Helmet은 그저 head로 가는 direct link일 뿐임.
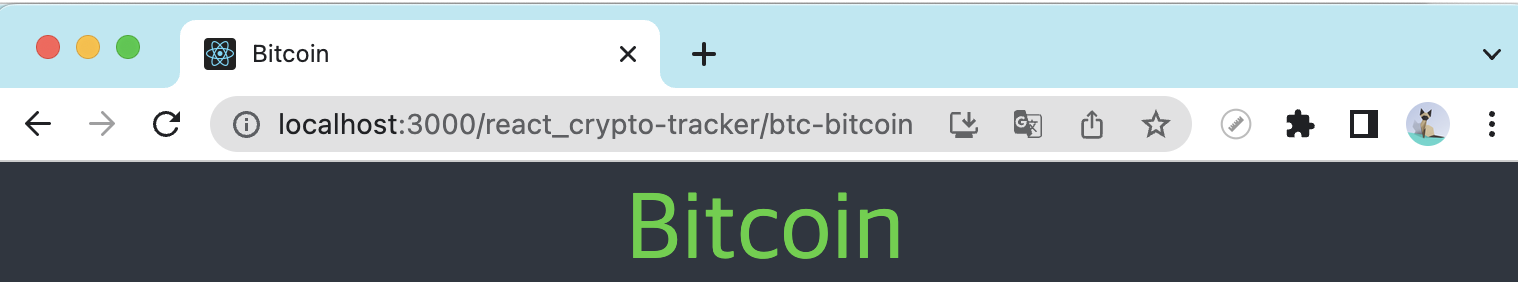
결과 화면 ↓

Frontend Developer