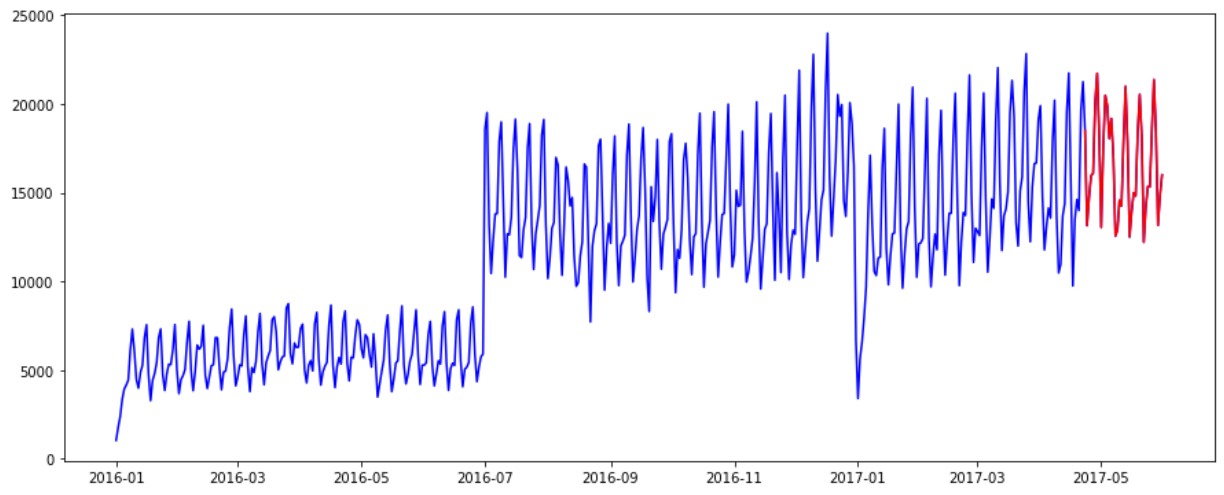
kaggle을 진행하다보니 시각화 과정에서 기존의 데이터 + predict 데이터를 함께 플롯할 일이 생기더라고요
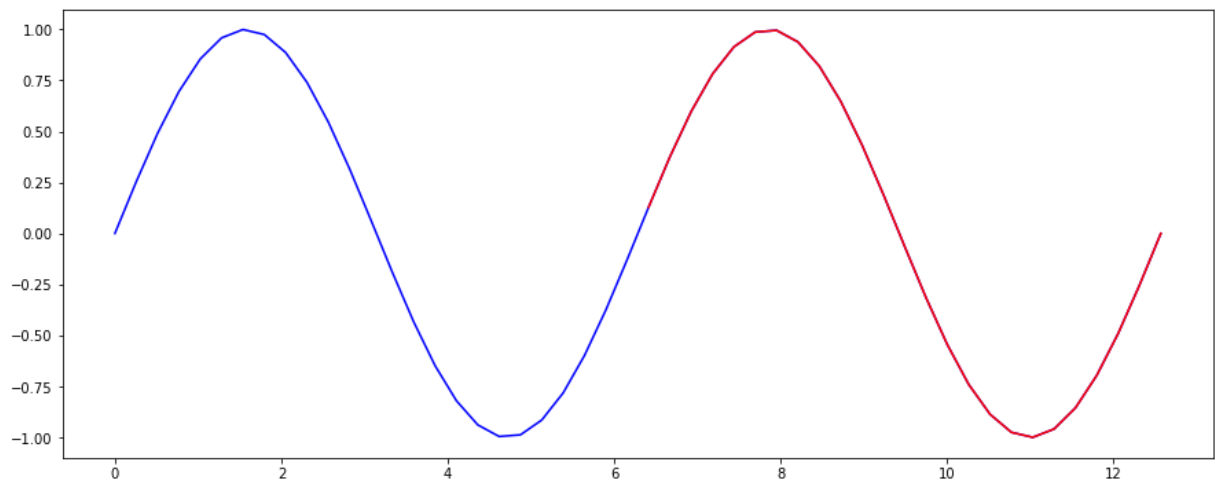
그런데 그냥 두개의 그래프를 플롯하면 중간지점이 끊기는 현상이 생겨서 이런저런 정보를 찾아보다가 Threshold를 사용하여 plot하는 방법을 알아내서 포스트해봅니다.
import pandas as pd
import numpy as np
import matplotlib.pyplot as plt
import math

# x,y 선언
x = np.linspace(0,4*math.pi)
y = np.sin(x)

# 색 경계 설정
threshold = 2*math.pi    # 2파이를 기점으로 색이 변하고 싶다!

# line plot
plt.figure(figsize=(15,6))
plt.plot(x, y, color='blue')
below_threshold = x < threshold
print("below_threshold : \n", below_threshold)
print()

# Add above threshold markers
above_threshold = np.logical_not(below_threshold) # true/false 반대로
print("above_threshold : \n", above_threshold)

plt.plot(x[above_threshold], y[above_threshold], color='red') 

Plot 과정
1. 0~4π 까지 blue로 plot --> 이 과정은 평범한 plt.plot과 다를 바 없음
2. threshold = 2π 기준으로 2π ~ 4π 구간만 True인 array 생성
3. "blue" 범위 위에 "red" 그래프 덧붙이기
4. 완성
- 캐글에서 Plot한 그래프
