개요
그 동안 바쁘게 지내다 정말 오랜만에 포스팅을 하는 것 같다.
오늘은 마케팅 부서에 근무하는 지인의 회사에 n8n을 도입하게 되었고 개발자가 아니더라도 n8n의 workflow에 능숙해지라는 업무지시를 받은 것 같다. 따라서 의도에 맞춰 도움을 조금 주면서 작성한 후기를 포스팅을 해보겠다.
n8n이 뭔데 ?
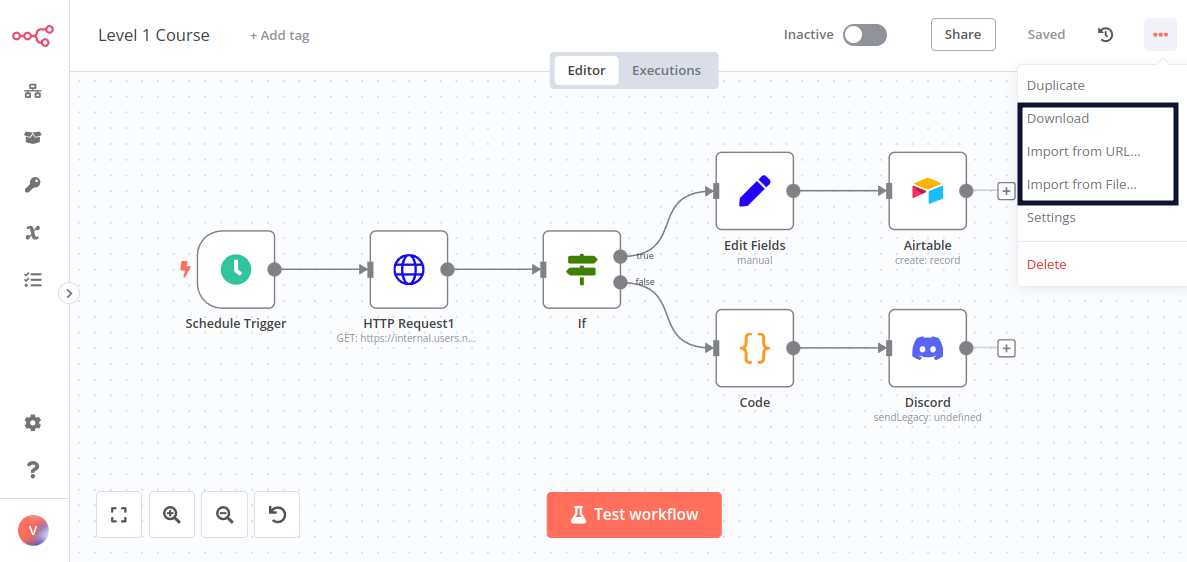
n8n은 시각적인 워크플로우 자동화 도구로, 비전문가도 쉽게 사용할 수 있다. 사용자는 그래픽 사용자 인터페이스(GUI)를 통해 다양한 앱, 서비스 및 시스템을 연결하고 워크플로우를 생성할 수 있다. 이를 통해 데이터의 이동, 처리 및 변환을 자동화하고 다양한 작업을 자동으로 실행할 수 있다.
쉽게 말하면 워크 플로우를 연결해주는 여러가지 기능들을 제공해주고 사용자는 해당하는 정보만 넣어주면 원하는 워크 플로우를 완성할 수 있는 툴이다.
장단점은 아래와 같다.
장점
-
사용이 간편하고 직관적인 시각적 편집기를 제공하여 프로세스의 빠른 구축 및 수정 가능.
-
다양한 앱 및 서비스 간의 통합을 지원하여 복잡한 작업 흐름을 자동화할 수 있음.
-
개발자가 아닌 비전문가도 사용할 수 있어서 업무 효율성을 높일 수 있음.
-
오픈 소스이며 확장성이 뛰어나고 커뮤니티가 활발하여 다양한 플러그인 및 지원을 제공.
단점
-
복잡한 워크플로우의 경우에도 사용자가 실수를 할 수 있으며, 이에 따른 오류를 해결해야 할 수 있음.
-
대용량 데이터 처리 및 고도의 커스터마이징이 필요한 경우에는 적합하지 않을 수 있음.
-
서비스의 변경이나 업데이트에 따라 호환성 문제가 발생할 수 있음.
-
일부 고급 기능은 유료 플랜에서만 제공될 수 있어서 추가 비용이 발생할 수 있음.
그래서 오늘 뭘 만들건데 ?
간단하게 설명하자면..
- 슬랙 봇 생성
- 사용자는 슬랙 봇에 본인이 원하는 키워드를 검색
- 슬랙 봇은 최근 한달간의 데이터를 naver datalabs api & 검색광고 api 의 데이터를 토대로 통계를 수치화 시켜서 사용자에게 응답한다.
ex) 사용자가 "캠핑" 을 검색하면 아래와 같은 데이터를 슬랙 봇에게 응답 받게 만든다.
[캠핑] 검색량 상세 데이터 결과
—————————————
+ 검색량 상세 데이터 조회 +
—————————————
*총 검색량: 80,600

*기기별 검색량
 - PC: 15,300 (19.0%)
 - 모바일: 65,300 (81.0%)

*성별 검색량
 - 남성: 45,136 (56%)
 - 여성: 35,464 (44%)

* 연령대별 검색 현황

 ✓ 1위 50대 (41%)
 ✓ 2위 40대 (40%)
 ✓ 3위 60대 (13%)

—————————————
*통계기간 : 2024-04-25 ~ 2024-05-25
1. naver 검색광고 api 신청하기

서비스 신청을 하자 .
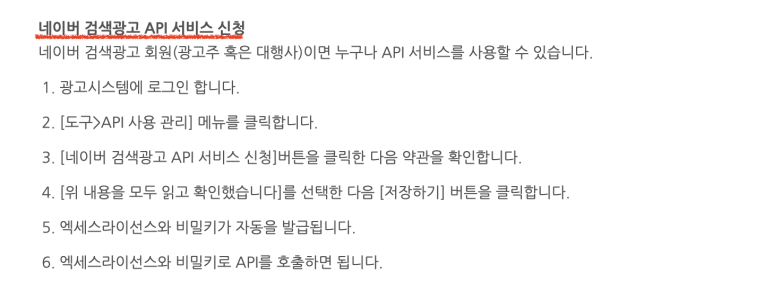
해당 메뉴로 들어가자.
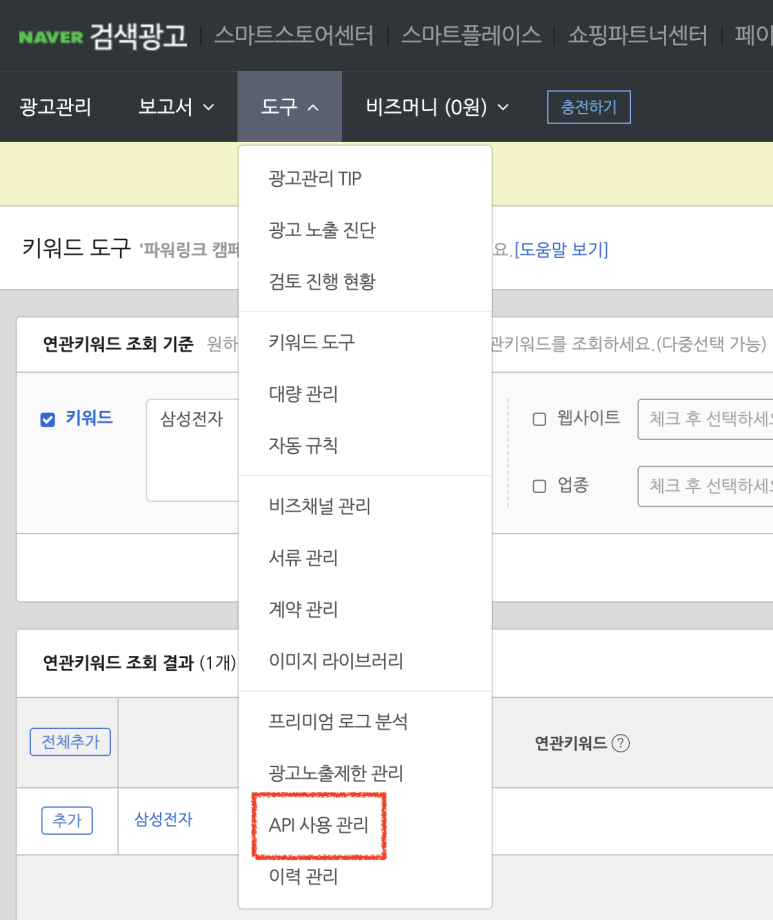
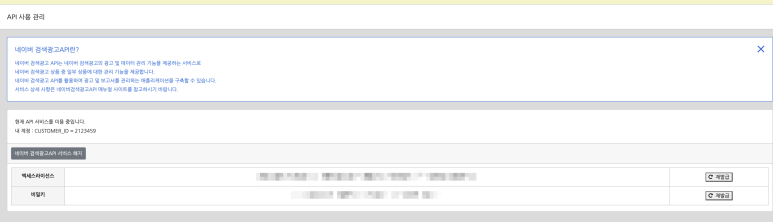
신청을 하게 되면 이렇게 엑세스라이선스와 비밀키를 발급 해줌.
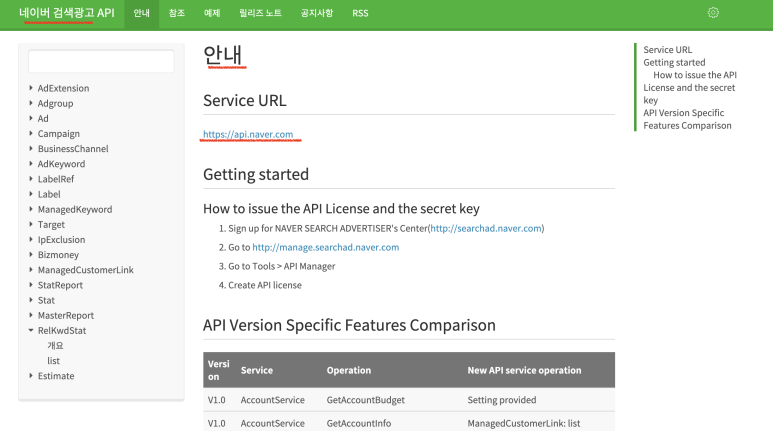
네이버에서 공식으로 제공하는 github 페이지
제가 사용할 API 는 RelKwdStat 가 될 것 같네요
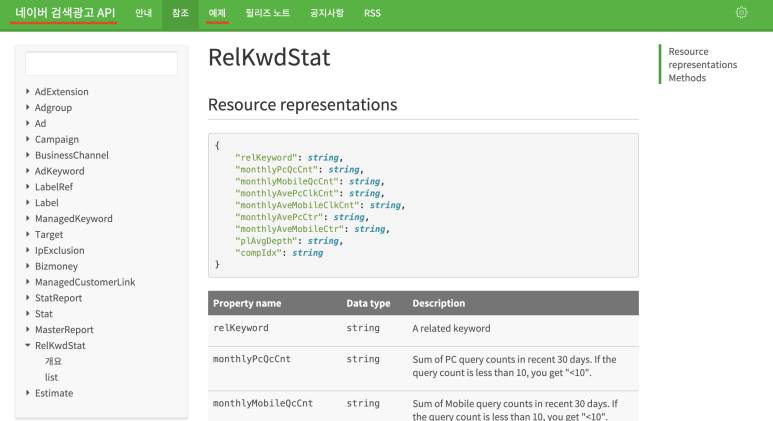
특정 keyword의 통계 데이터를 제공해준다고하네요
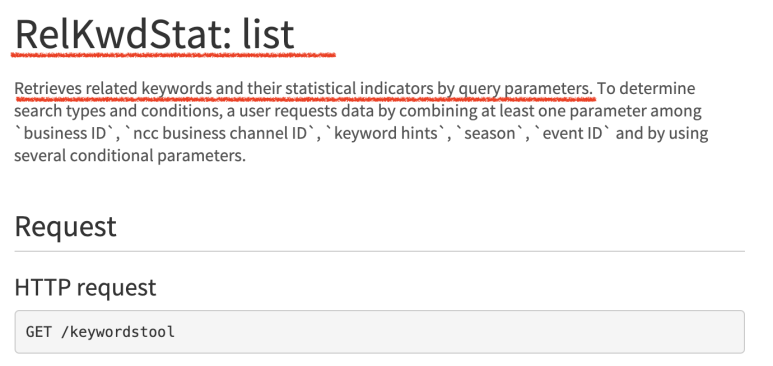
GET /keywordstool API의 Response를 살펴보니 제가 원하는 데이터가 들어있습니다.
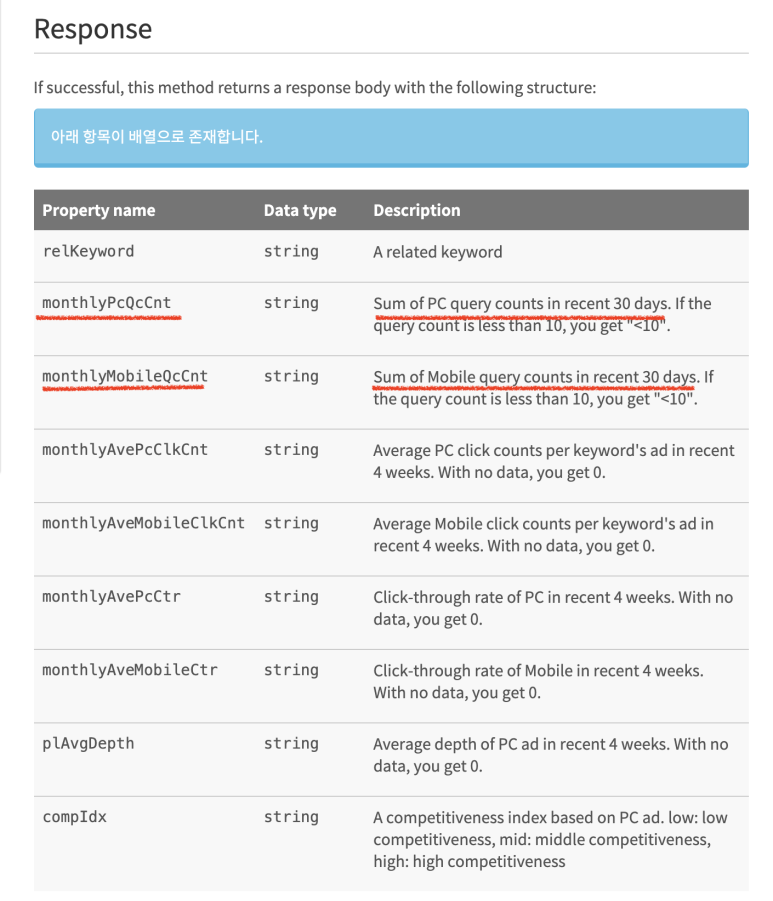
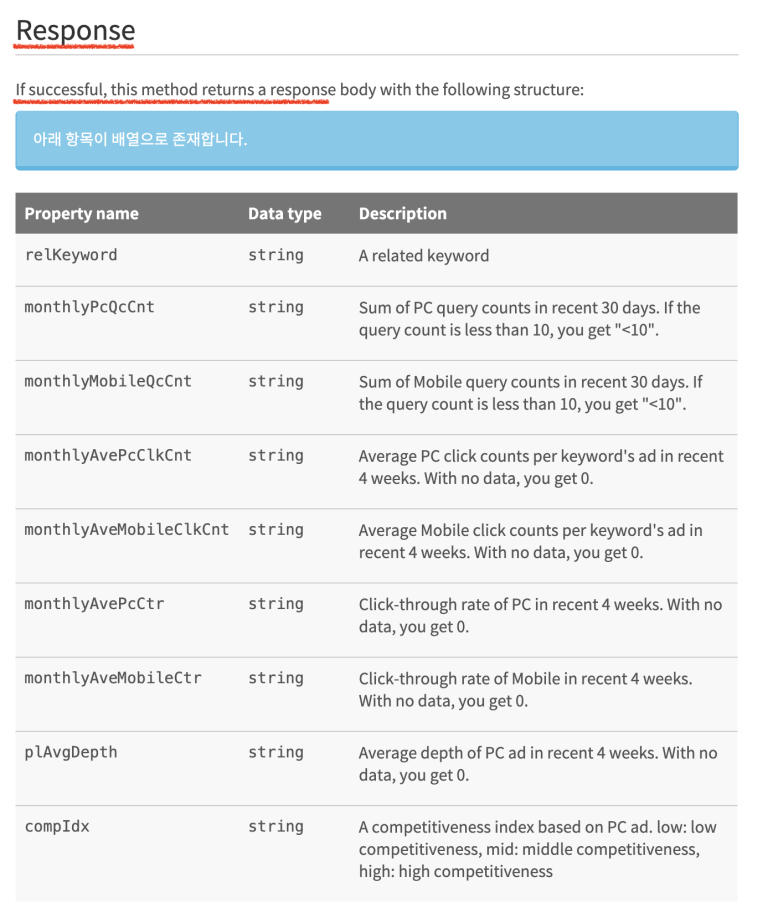
Response(결과 값)도 역시 문서화 되어있어요.
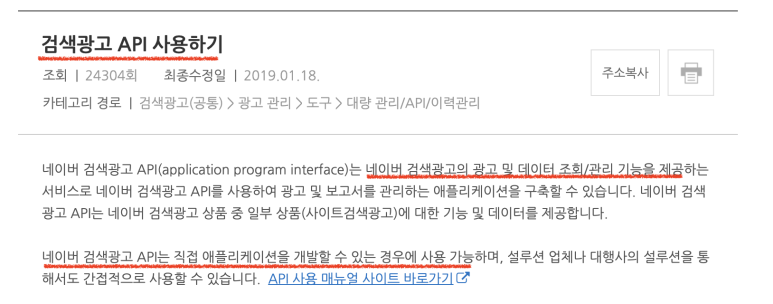
2. 검색광고 api 사용하기
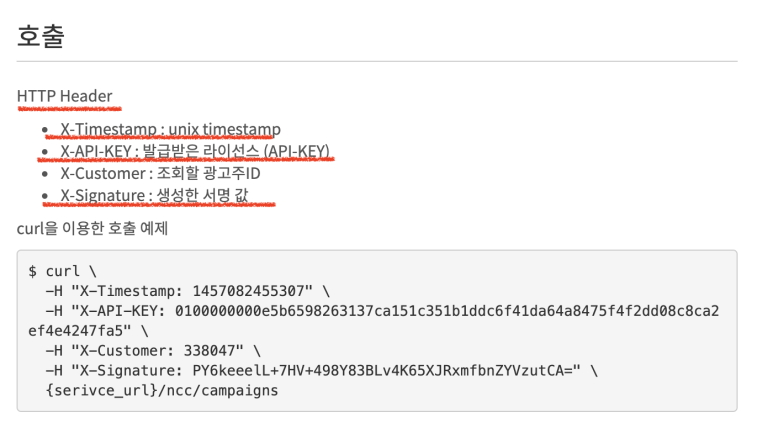
API를 호출할때, HTTP Header에는 네이버 검색광고 API에서 발급받은, 액세스라이센스와 비밀키를 넣어줘야 됨.
저는 n8n의 node를 만들어서 코드레벨에서 전부 구현하였습니다.
3. 최근 한달 총 검색량 & 기기별 검색량
const crypto = require('crypto');
const method = "GET";
const api_url = "/keywordstool";
const timestamp = Date.now().toString();
const accessKey = "YOUR_ACCESS_KEY";
const secretKey = "YOUR_SECRET_KEY";
const customerId = "YOUR_CUSTOMER_ID";
const hintKeywords = "캠핑";
const hmac = crypto.createHmac('sha256', secretKey);
hmac.update(timestamp + '.' + method + '.' + api_url);
const signature = hmac.digest('base64');
const url = 'https://api.naver.com/keywordstool?hintKeywords=' + encodeURIComponent(hintKeywords);
// HTTP 요청 보내기
return this.helpers.httpRequest({
method: 'GET',
url: url,
headers: {
'X-Timestamp': timestamp,
'X-API-KEY': accessKey,
'X-API-SECRET': secretKey,
'X-CUSTOMER': customerId,
'X-Signature': signature
}
}).then((response) => {
const data = response.keywordList[0];
return {
"searchTitle" : hintKeywords,
"pcCnt": data.monthlyPcQcCnt,
"mobileCnt": data.monthlyMobileQcCnt,
"totalCnt": data.monthlyPcQcCnt + data.monthlyMobileQcCnt
};
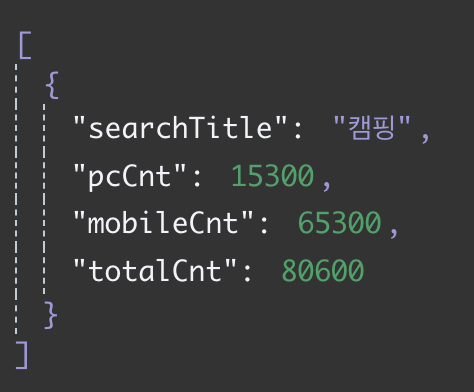
});결과
최근 한달 총 검색량과 pc와 mobile 건수가 같이 추출 되었습니다.
주의할 점
n8n의 코드레벨로 구현할 때 python과 javascript 코드로 구현이 가능한데 js로 구현할 시 axios, fetch 등등 요청 모듈을 사용이 쉽지 않습니다.(외부 모듈 붙일 수 있긴 한데 방법 찾아보다 위의 방법으로 사용함 )
4. 성별 검색량
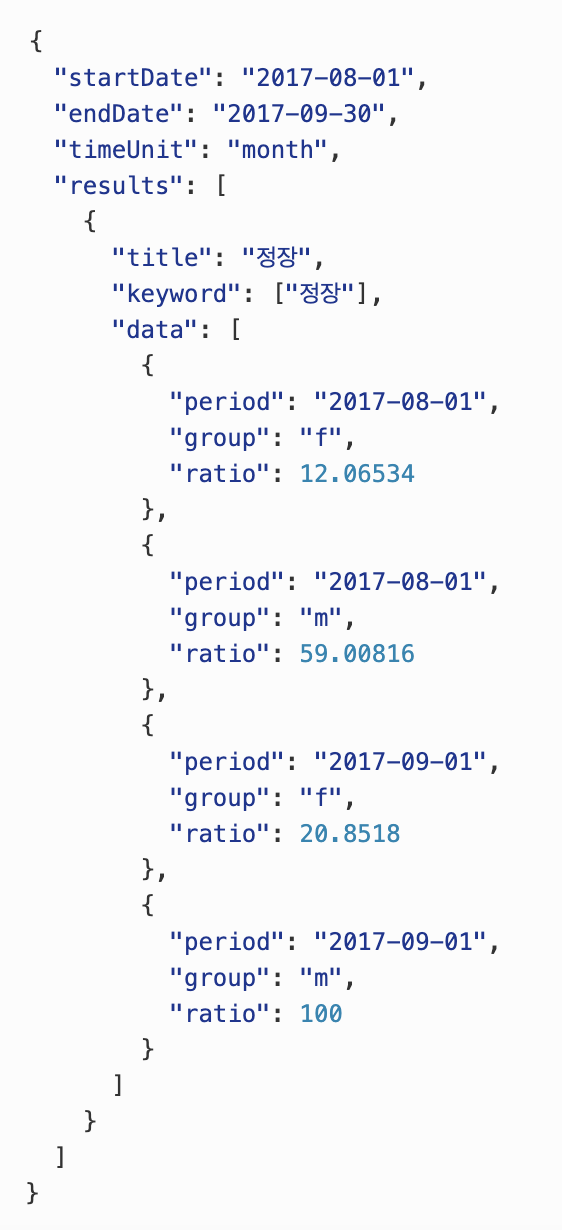
쇼핑인사이트-키워드-성별-트렌드-조회 docs를 참고하시기 바랍니다.
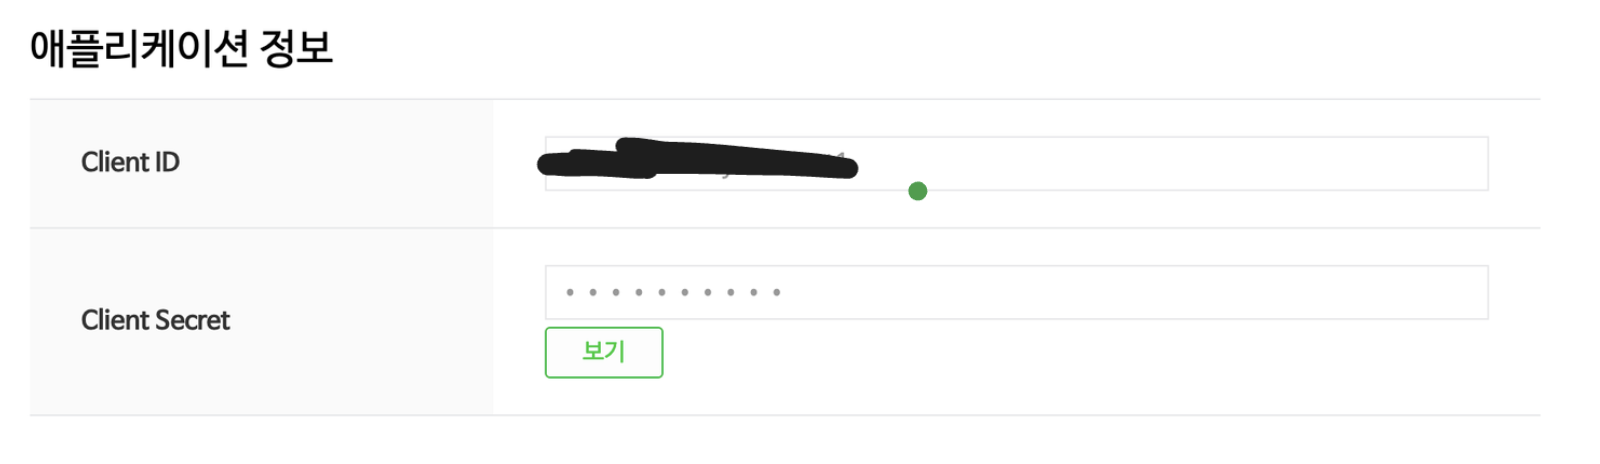
naver api 신청은 따로 하셔서 아래와 같이 key와 secret을 받아놓으셔야 합니다.
응답예시가 추이로 나오기 때문에 비율을 구하는 계산을 해주셔야 합니다.
const url = "https://openapi.naver.com/v1/datalab/shopping/category/keyword/gender";

// 오늘 날짜 구하기
const today = new Date();
const yyyy = today.getFullYear();
const mm = String(today.getMonth() + 1).padStart(2, '0');
const dd = String(today.getDate()).padStart(2, '0');
const endDate = `${yyyy}-${mm}-${dd}`;

// 한 달 전 날짜 구하기
const oneMonthAgo = new Date(today);
oneMonthAgo.setMonth(oneMonthAgo.getMonth() - 1);
const yyyyAgo = oneMonthAgo.getFullYear();
const mmAgo = String(oneMonthAgo.getMonth() + 1).padStart(2, '0');
const startDate = `${yyyyAgo}-${mmAgo}-${dd}`;

function calculateGenderRatio(data) {
  let totalMaleRatio = 0;
  let totalFemaleRatio = 0;

  // 데이터 합산
  data.forEach(entry => {
    if (entry.group === 'm') {
      totalMaleRatio += entry.ratio;
    } else if (entry.group === 'f') {
      totalFemaleRatio += entry.ratio;
    }
  });

  // 전체 비율 계산
  const totalRatio = totalMaleRatio + totalFemaleRatio;

  // 각 성별의 최종 비율 계산
  const malePercentage = (totalMaleRatio / totalRatio) * 100;
  const femalePercentage = (totalFemaleRatio / totalRatio) * 100;

  return {
    malePercentage: malePercentage.toFixed(2), // 소수점 둘째 자리까지 표시
    femalePercentage: femalePercentage.toFixed(2) // 소수점 둘째 자리까지 표시
  };
}

// HTTP 요청 보내기
return this.helpers.httpRequest({
  method: 'POST',
  url: url,
  headers: {
    "X-Naver-Client-Id" : "YOUR_CLIENT_ID",
    "X-Naver-Client-Secret" : "YOUR_CLIENT_SECRET"
  },
  body: {
    "startDate": startDate,
    "endDate": endDate,
    "timeUnit": "month",
    "category" : "50000028",
    "keyword" : "캠핑",
    "device": "",
    "gender": "",
    "ages": []
  }
}).then((response) => {
  const data = response.results[0].data;
  const genderRatio = calculateGenderRatio(data);
  const dataObj = {
    "malePercentage" : `${genderRatio.malePercentage}%`,
    "femalePercentage" : `${genderRatio.femalePercentage}%`
  }
  return dataObj;
});
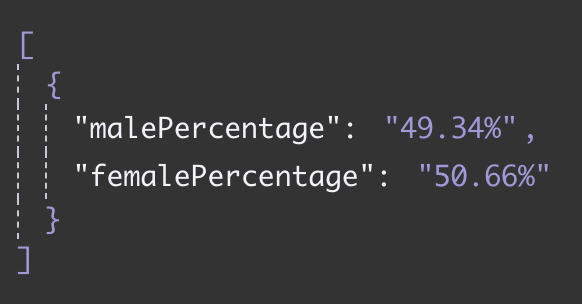
결과
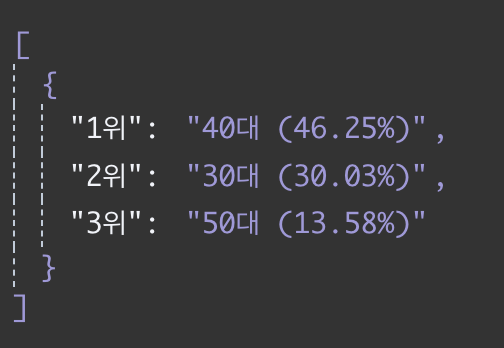
5. 연령대별 검색 현황
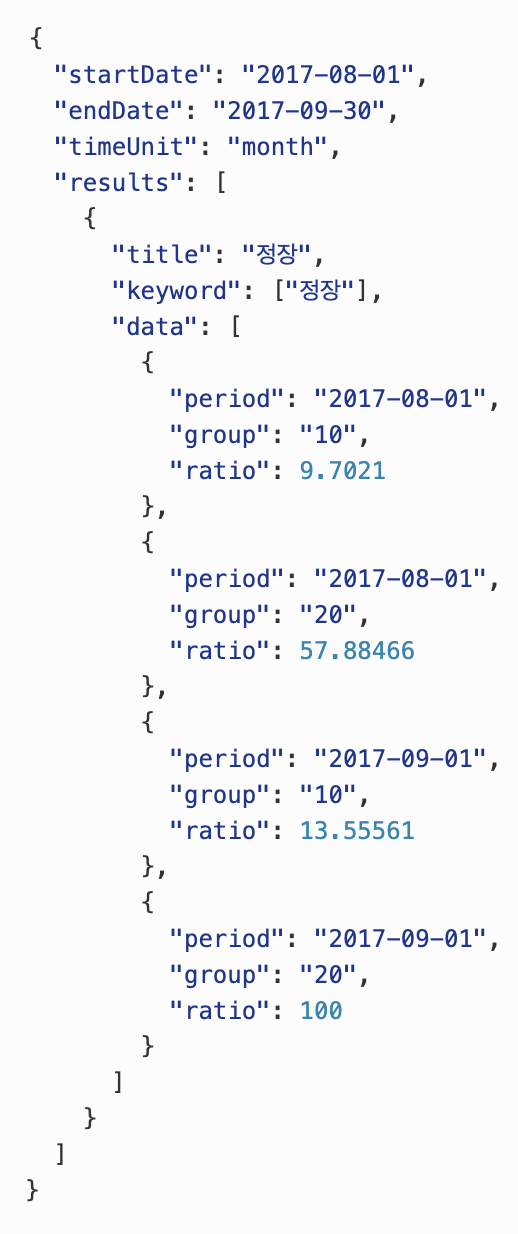
쇼핑인사이트-키워드-연령별-트렌드-조회 docs를 참고하시기 바랍니다.
응답예시 입니다. top3와 내림차순으로 정렬 하겠습니다.
const url = "https://openapi.naver.com/v1/datalab/shopping/category/keyword/age";

// 오늘 날짜 구하기
const today = new Date();
const yyyy = today.getFullYear();
const mm = String(today.getMonth() + 1).padStart(2, '0');
const dd = String(today.getDate()).padStart(2, '0');
const endDate = `${yyyy}-${mm}-${dd}`;

// 한 달 전 날짜 구하기
const oneMonthAgo = new Date(today);
oneMonthAgo.setMonth(oneMonthAgo.getMonth() - 1);
const yyyyAgo = oneMonthAgo.getFullYear();
const mmAgo = String(oneMonthAgo.getMonth() + 1).padStart(2, '0');
const startDate = `${yyyyAgo}-${mmAgo}-${dd}`;


// HTTP 요청 보내기
return this.helpers.httpRequest({
  method: 'POST',
  url: url,
  headers: {
    "X-Naver-Client-Id" : "YOUR_CLIENT_ID",
    "X-Naver-Client-Secret" : "YOUR_CLIENT_SECRET"
  },
  body: {
    "startDate": startDate,
    "endDate": endDate,
    "timeUnit": "month",
    "category" : "50000028",
    "keyword" : "캠핑",
    "device": "",
    "gender": "",
    "ages": []
  }
}).then((response) => {
  const data = response.results[0].data;

  // 연령대별 비율 합산
  const ageGroups = {};
  let totalRatio = 0;

  data.forEach(item => {
    const group = item.group;
    if (!ageGroups[group]) {
      ageGroups[group] = 0;
    }
    ageGroups[group] += item.ratio;
    totalRatio += item.ratio;
  });

  // 전체 비율에서 각 연령대의 비율 계산
const ageGroupPercentages = Object.keys(ageGroups).map(group => {
  return {
      group,
      percentage: (ageGroups[group] / totalRatio * 100).toFixed(2) // 소수점 둘째 자리까지 표시
    };
  });

  // 비율 내림차순 정렬
ageGroupPercentages.sort((a, b) => b.percentage - a.percentage);

  // 상위 3개 추출
const top3AgeGroups = ageGroupPercentages.slice(0, 3);

  // 결과 객체 생성
const result = {};
top3AgeGroups.forEach((item, index) => {
  result[`${index + 1}위`] = `${item.group}대 (${item.percentage}%)`;
});

  return result;
});
결과
4. 출력용 멘트
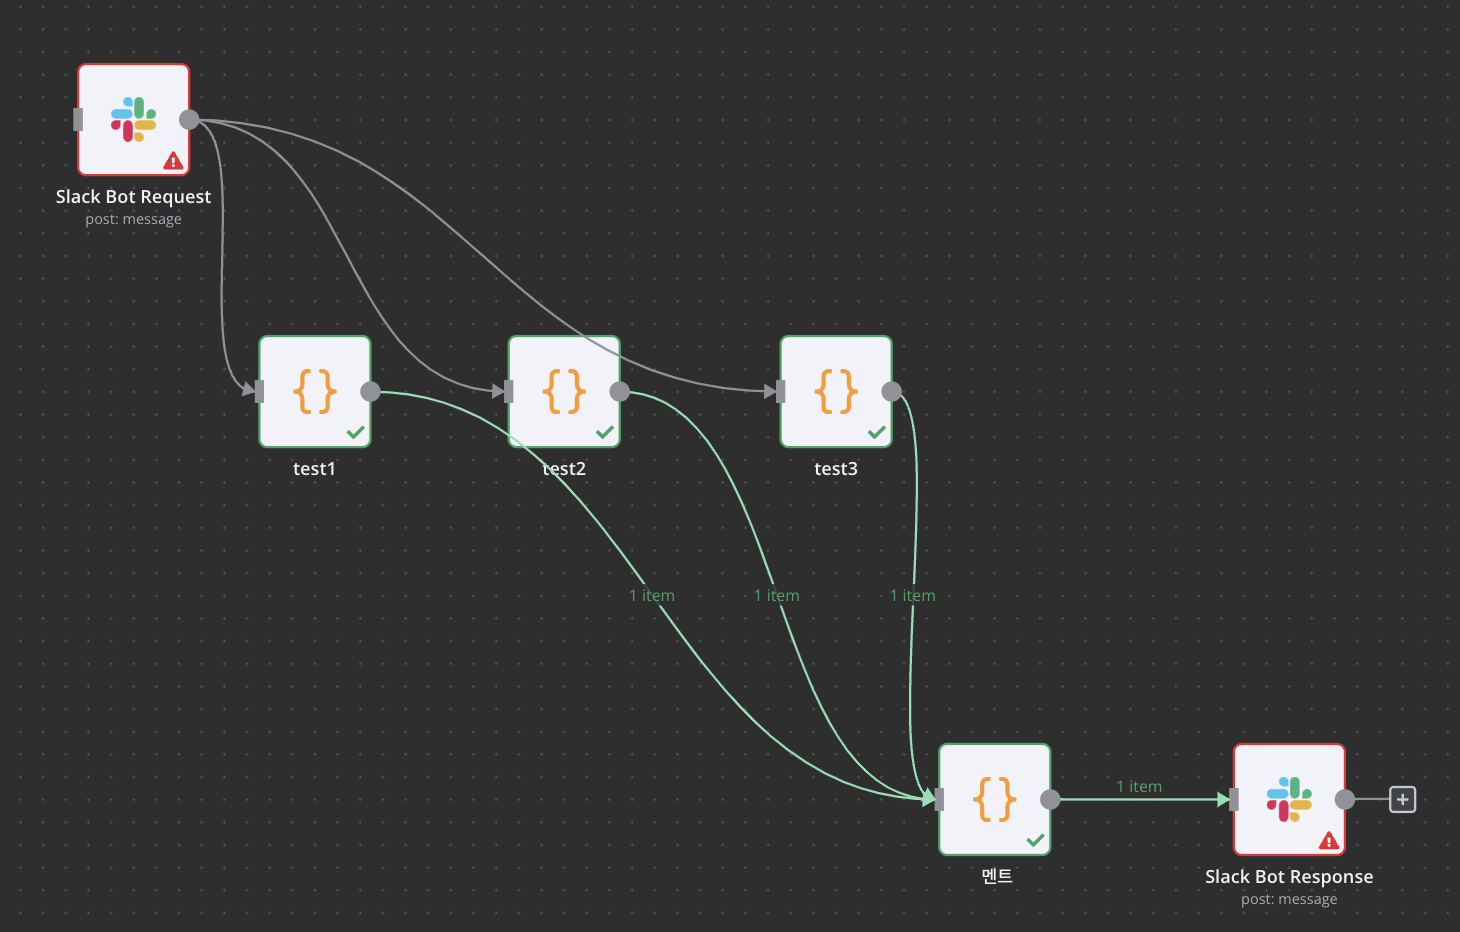
위의 만든 3개의 node를 하나의 node로 데이터를 보내주어 마지막 node에서 출력용 멘트를 작성하도록 하겠습니다.
const data1 = $("test1").all();
const data2 = $("test2").all();
const data3 = $("test3").all();

const dataObj = {
  "totalCnt" : data1[0].json,
  "sexCnt" : data2[0].json,
  "ageCnt" : data3[0].json
}

const totalSearches = dataObj.totalCnt.totalCnt;
const pcSearches = dataObj.totalCnt.pcCnt;
const mobileSearches = dataObj.totalCnt.mobileCnt;
const malePercentage = parseFloat(dataObj.sexCnt.malePercentage.replace('%', ''));
const femalePercentage = parseFloat(dataObj.sexCnt.femalePercentage.replace('%', ''));
const maleSearches = Math.round((malePercentage / 100) * totalSearches);
const femaleSearches = Math.round((femalePercentage / 100) * totalSearches);

const ageRankings = dataObj.ageCnt;
const ageRanking1 = ageRankings["1위"];
const ageRanking2 = ageRankings["2위"];
const ageRanking3 = ageRankings["3위"];

// Formating the output string
const output = `
[캠핑] 검색량 상세 데이터 결과\n
—————————————\n
+ 검색량 상세 데이터 조회 +\n
—————————————\n
*총 검색량: ${totalSearches.toLocaleString()}\n
*기기별 검색량\n
 - PC: ${pcSearches.toLocaleString()} (${((pcSearches / totalSearches) * 100).toFixed(1)}%)\n
 - 모바일: ${mobileSearches.toLocaleString()} (${((mobileSearches / totalSearches) * 100).toFixed(1)}%)\n
*성별 검색량\n
 - 남성: ${maleSearches.toLocaleString()} (${malePercentage.toFixed(0)}%)\n
 - 여성: ${femaleSearches.toLocaleString()} (${femalePercentage.toFixed(0)}%)\n
* 연령대별 검색 현황\n
 ✓ 1위 ${ageRanking1}\n
 ✓ 2위 ${ageRanking2}\n
 ✓ 3위 ${ageRanking3}\n
`;


// 모든 데이터를 하나의 객체로 반환
return { "data": output };
결과
[캠핑] 검색량 상세 데이터 결과
————————————— +
검색량 상세 데이터 조회 +
—————————————
*총 검색량: 80,600

*기기별 검색량
- PC: 15,300 (19.0%)
- 모바일: 65,300 (81.0%)

*성별 검색량
- 남성: 39,768 (49%)
- 여성: 40,832 (51%)

* 연령대별 검색 현황
✓ 1위 40대 (46.25%)
✓ 2위 30대 (30.03%)
✓ 3위 50대 (13.58%)
—————————————
*통계기간 : 2024-04-25 ~ 2024-05-25
마치며 슬랙 봇은 관리자의 token 승인이 필요한 관계로 완성 시 추가 포스팅 하도록 하겠습니다.