
들어가기 전에
이 책에서는 첫 실무 데이터를 MySQL Sample Database Diagram으로 설정하였다.
DB Diagram은 다음과 같다.
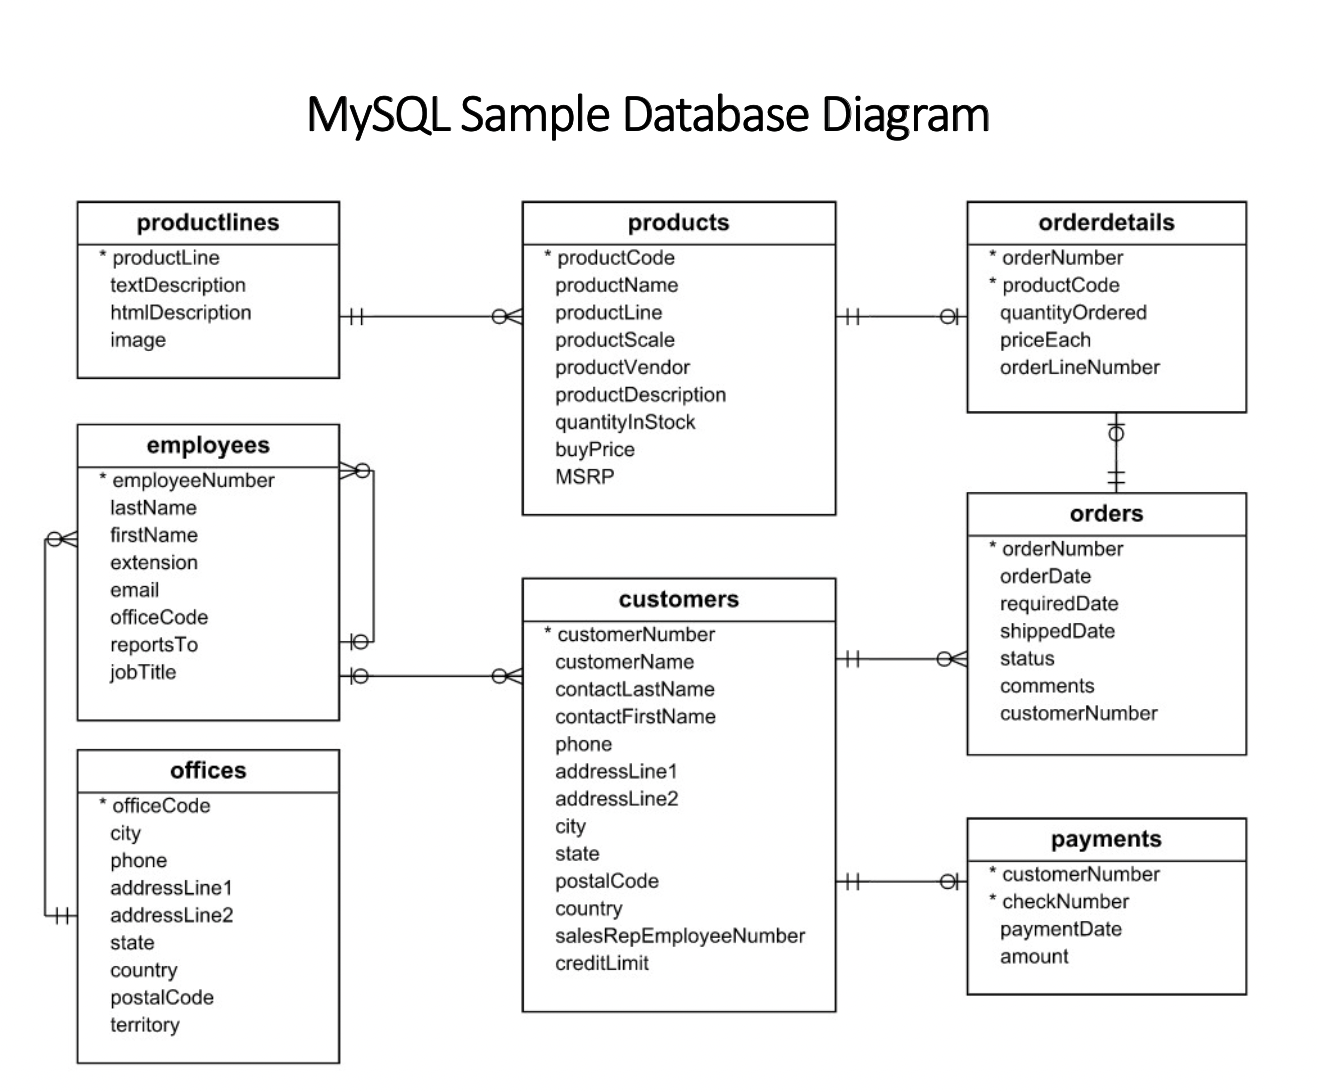
그동안 해커랭크와 프로그래머스 문제를 풀면서 테이블간의 관계가 이렇게 많아진 것은 보지 못해서 처음에는 낯설었지만, SQLD 시험을 준비하면서 어디선가 본 느낌이 들어 찾아보니 다음과 같은 내용이 있었다.
ERD(Entity Relationship Diagram)
데이터베이스 구조를 한 눈에 알아보기 위해 그리는 다이어그램으로 개체(Entity)와 관계(Relationship)를 중점적으로 표시한다.
실무
1. 기간별 매출액
일자별 매출액
일자별 매출액을 구하기 위해서는
- 판매일
- 매출액
위의 두 가지 데이터가 필요하다.
이때 실무 데이터의 ERD를 기준으로 orders 테이블에 orderdate 데이터가 있고, orderdetails 테이블에 개당 가격(priceeach) 데이터와 quantityordered(주문 수량)이 있으므로
매출액 = 개당 가격 * 주문 수량을 통하여 구할 수 있다.
또한 두 테이블을 합쳐야 하므로 공통으로 있는 키인 ordernumber(주문 번호)를 기준으로 다음과 같이 join하였다.
#일자별 매출액
select t1.orderdate, sum(t2.priceeach * t2.quantityordered) as sales
from orders as t1
left join orderdetails as t2
on t1.ordernumber = t2.ordernumber
group by t1.orderdate
order by t1.orderdate;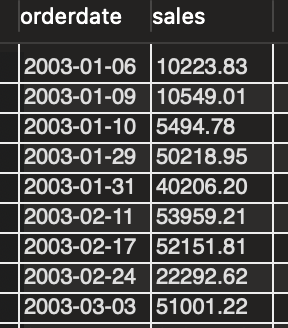
월별 매출액
일별 매출액에서 orderdate 데이터를 보니
- yyyy-mm-dd
의 형식으로 되어있어 substr 함수를 이용하여 다음과 같이 구할 수 있다.
#월별 매출액
select substr(t1.orderdate, 1, 7) as ordermonth,
	sum(t2.priceeach * t2.quantityordered) as sales
from orders as t1
left join orderdetails as t2
on t1.ordernumber = t2.ordernumber
group by ordermonth
order by ordermonth;
연도별 매출액
월별 매출액과 같은 방법으로 다음과 같이 구할 수 있다.
#연도별 매출액
select substr(t1.orderdate, 1, 4) as orderyear, sum(t2.priceeach * t2.quantityordered) as sales
from orders as t1
left join orderdetails as t2
on t1.ordernumber = t2.ordernumber
group by orderyear
order by orderyear;
연도별 인당 매출액
연도별로 고객 1명당 어느 정드의 매출을 기록하였는지를 파악하기 위해서는
- 판매연도
- 그 해에 제품을 구매한 고객 수
가 필요하고, ERD에서 customernumber 데이터가 있으므로 다음과 같이 구할 수 있다.
#연도별 인당 매출액
select
	substr(t1.orderdate, 1, 4) as orderyear,
    count(distinct customernumber),
    sum(t2.priceeach * t2.quantityordered) as sales,
    sum(t2.priceeach * t2.quantityordered) / count(distinct customernumber) as AMV
from orders as t1
join orderdetails as t2
on t1.ordernumber = t2.ordernumber
group by orderyear
order by orderyear;
연도별 건당 구매 금액
연도별로 구매 1건당 어느 정도의 매출을 기록하였는지 파악하기 위해서는
- 판매연도
- 그 해에 해당하는 주문 수
가 필요하고, ERD에서 ordernumber 데이터가 있으므로 다음과 같이 구할 수 있다.
- 그 해에 해당하는 주문 수
#연도별 건당 매출액
select
	substr(t1.orderdate, 1, 4) as orderyear,
    count(distinct t1.ordernumber) as totalorders,
    sum(t2.priceeach * t2.quantityordered) as sales,
    sum(t2.priceeach * t2.quantityordered) / count(distinct t1.ordernumber) as ATV
from orders as t1
left join orderdetails as t2
on t1.ordernumber = t2.ordernumber
group by orderyear
order by orderyear
2. 그룹별 매출액
국가별, 도시별 매출액
ERD를 보면 customer 테이블에 country 데이터가 있으므로 다음과 같이 구할 수 있다.
#국가별, 도시별 매출액
select
	t3.country,
    t3.city,
    sum(t2.priceeach * t2.quantityordered) as sales from orders as t1
left join orderdetails as t2
on t1.ordernumber = t2.ordernumber
left join customers as t3
on t1.customernumber = t3.customernumber
group by t3.country, t3.city
order by t3.country, sales desc;
북미 vs 비북미 매출액
본문에서는 case when 구문을 사용하였지만, if 문을 사용하여 구할 수도 있다.
#if 문을 사용한 북미 vs 비북미 매출액
select
	if(t3.country in ('USA', 'Canada'), 'North America', 'Others') as country_grp,
    sum(t2.priceeach * t2.quantityordered) as sales
from orders as t1
left join orderdetails as t2
on t1.ordernumber = t2.ordernumber
left join customers as t3
on t1.customernumber = t3.customernumber
group by country_grp;
#case when 문을 사용한 북미 vs 비북미 매출액
select
case when t3.country in ('USA', 'Canada') then 'North America' else 'Others' end as country_grp,
sum(t2.priceeach * t2.quantityordered) as sales
from orders as t1
left join orderdetails as t2
on t1.ordernumber = t2.ordernumber
left join customers as t3
on t1.customernumber = t3.customernumber
group by country_grp;매출 Top 5 국가 및 매출
서브쿼리를 사용하여 국가별 매출액을 알 수 있는 테이블을 만들고, rank 함수를 사용하였다.
사실 서브쿼리에서
order by sales desc limit 5의 작업을 거쳤기 때문에 from에서 참조하는 테이블에는 매출 상위 5개의 나라만 존재한다.
즉 5개의 나라의 매출만 봐도 순위가 바로 나오겠지만 친절도를 위해 rank 함수를 사용하면 다음과 같이 구할 수 있다.
여기서 참고할 점은 rank 함수는 group by를 사용하지 않는다는 것이다.
#매출 Top 5 국가 및 매출
select
	t4.country,
    t4.sales,
    rank() over(order by t4.sales desc) as ranking
from (select t3.country, sum(t2.priceeach * t2.quantityordered) as sales
	  from orders as t1
      left join orderdetails as t2
      on t1.ordernumber = t2.ordernumber
      left join customers as t3
      on t1.customernumber = t3.customernumber
      group by t3.country
      order by sales desc
      limit 5) as t4
order by ranking;
3. 재구매율
연도별 재구매율
연도별 재구매율을 구하기 위해서는
- 어느 해에 구매한 사용자와 그 다음에 구매한 사용자의 customernumber 데이터가 있는 경우
를 따지면 된다.
따라서 서브쿼리를 사용하여 이전 연도 기준 당해 연도에 구매 이력이 있는 고객을 찾을 수 있게 하였고, 중복된 고객을 제외하기 위해 distinct를 넣어주었다.
#연도별 재구매율
select
	substr(t3.o1, 1, 4) as year,
    count(distinct t3.c2) / count(distinct t3.c1) as retention
from (select
		t1.customernumber as c1,
        t1.orderdate as o1,
        t2.customernumber as c2,
        t2.orderdate as o2
	  from orders as t1
      left join orders as t2
      on substr(t1.orderdate, 1, 4) = substr(t2.orderdate, 1, 4) -1
      	and t1.customernumber = t2.customernumber
      order by t1.customernumber) as t3
group by year
order by year;
국가별 연도별 재구매율
연도별 재구매율에서 customers 테이블을 조인하여 country 데이터를 뽑고 group by를 해주면 되므로 다음과 같이 구할 수 있다.
#연도별, 국가별 재구매율
select
	t4.country,
	substr(t3.o1, 1, 4) as year,
    count(distinct t3.c2) / count(distinct t3.c1) as retention
from (select
		t1.customernumber as c1,
        t1.orderdate as o1,
        t2.customernumber as c2,
        t2.orderdate as o2,
        t1.customernumber as cn1
	  from orders as t1
      left join orders as t2
      on substr(t1.orderdate, 1, 4) = substr(t2.orderdate, 1, 4) -1
      	and t1.customernumber = t2.customernumber
      order by t1.customernumber) as t3
left join customers as t4
on t4.customernumber = t3.cn1
group by t4.country, year
order by t4.country, year;
4. Best Seller In USA
원문에서는 테이블을 하나 생성하고 순위를 지정하라고 하는데 그렇지 않고 하는 것과 큰 차이가 있는지는 잘 모르겠다.
처리 속도의 차이가 있는 것이라면 테이블을 만들어 조회하는 것도 고려해볼만 하다고 생각하지만, 지금은 4번의 조인으로 조회한 것을 올리겠다.
#Best Seller In USA
select
	t1.productname,
    sum(t2.priceeach * t2.quantityordered) as sales,
    rank() over(order by sum(t2.priceeach * t2.quantityordered) desc) as ranking
from products as t1
left join orderdetails as t2
on t1.productcode = t2.productcode
left join orders as t3
on t2.ordernumber = t3.ordernumber
left join customers as t4
on t3.customernumber = t4.customernumber
where t4.country = 'USA'
group by t1.productname
limit 5;
5. Churn Rate(%)
Churn Rate
활동 고객 중 얼마나 많은 고객이 비활동 고객으로 전환되었는지를 의미하는 지표로, 일반적으로 Churn은 다음과 같이 정의한다.
Churn : max(구매일, 접속일) 이후 일정 기간(ex. 3개월) 구매 or 접속하지 않은 상태
즉, 전채 고객 중 Churn에 해당하는 고객의 비중을 Churn Rate라고 한다.
따라서 churn에 해당하는 고객의 수와 non-churn인 고객의 수를 구하면 되므로 다음과 같이 구할 수 있다.
- datediff(date1, date2) : 두 date 간의 차이를 일수로 알려준다.
#Churn Rate
select
	if(diff>=90, 'churn', 'non-churn') as churn_type,
    count(distinct customernumber) as n_cus
from (select
		customernumber,
		max(orderdate) as mx_order,
		'2005-06-01',
		datediff('2005-06-01', max(orderdate)) as diff
	  from orders
	  group by customernumber
	  order by customernumber) as t1
group by churn_type
order by n_cus;
위의 쿼리로 다음과 같은 결과를 얻을 수 있다.
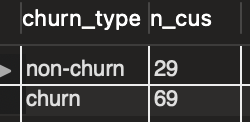
따라서 구하는 Churn Rate는 로 약 70%인 것을 알 수 있다.
Churn 고객이 가장 많이 구매한 Productline
이번에도 원문에서는 테이블을 하나 생성해서 작업하는데, 굳이 그럴 필요가 없어 하나의 쿼리로 끝냈다.
#Churn 고객이 가장 많이 구매한 Productline
select
	t1.churn_type,
	t4.productline,
    count(distinct t2.customernumber) as n_cus
from (select
		customernumber,
		max(orderdate) as mx_order,
		'2005-06-01',
		datediff('2005-06-01', max(orderdate)) as diff,
        if(datediff('2005-06-01', max(orderdate))>=90, 'churn', 'non-churn') as churn_type
	  from orders
	  group by customernumber
	  order by customernumber) as t1
left join orders as t2
on t1.customernumber = t2.customernumber
left join orderdetails as t3
on t2.ordernumber = t3.ordernumber
left join products as t4
on t3.productcode = t4.productcode
group by t1.churn_type, t4.productline
order by t1.churn_type, n_cus desc;
마치며
어느 회사에서 어떤 DB 구조를 보아도 여러 테이블에 데이터가 쌓이는 것이 효율적이라 조회 시 join을 많이 사용할 것이라고 생각은 했지만 기본적으로 3, 4번은 쓰는구나 싶었다.
SQL로 쿼리를 작성하면서 항상 느끼는 것인데, 어떤 데이터를 분석하기 위해서는 데이터를 깎는 일(전처리)가 가장 중요하다고 생각한다. 이후의 결과를 산출하는 작업은 솔직히 어떤 실무자가 와도 할 수 있는 것이다. (산출된 결과를 해석하거나 시각화 하는 일을 제외하면)
따라서 데이터 분석가가 되었을 때, 전처리를 하는 과정이 귀찮고 지겹게 느껴질 수 있을 것 같은데 우선 지금까지는 재미있다고 느낀다.
또한, 앞으로도 재밌게 할 것 같다.
생각을 하는 사람과 그 생각을 오감으로 느낄 수 있도록 실현하는 사람과는 엄청난 차이가 있다고 생각하기 때문이다.