개요
- Prometheus AlertManager를 설정하여 metric 상태에 따른 알림을 생성한다.
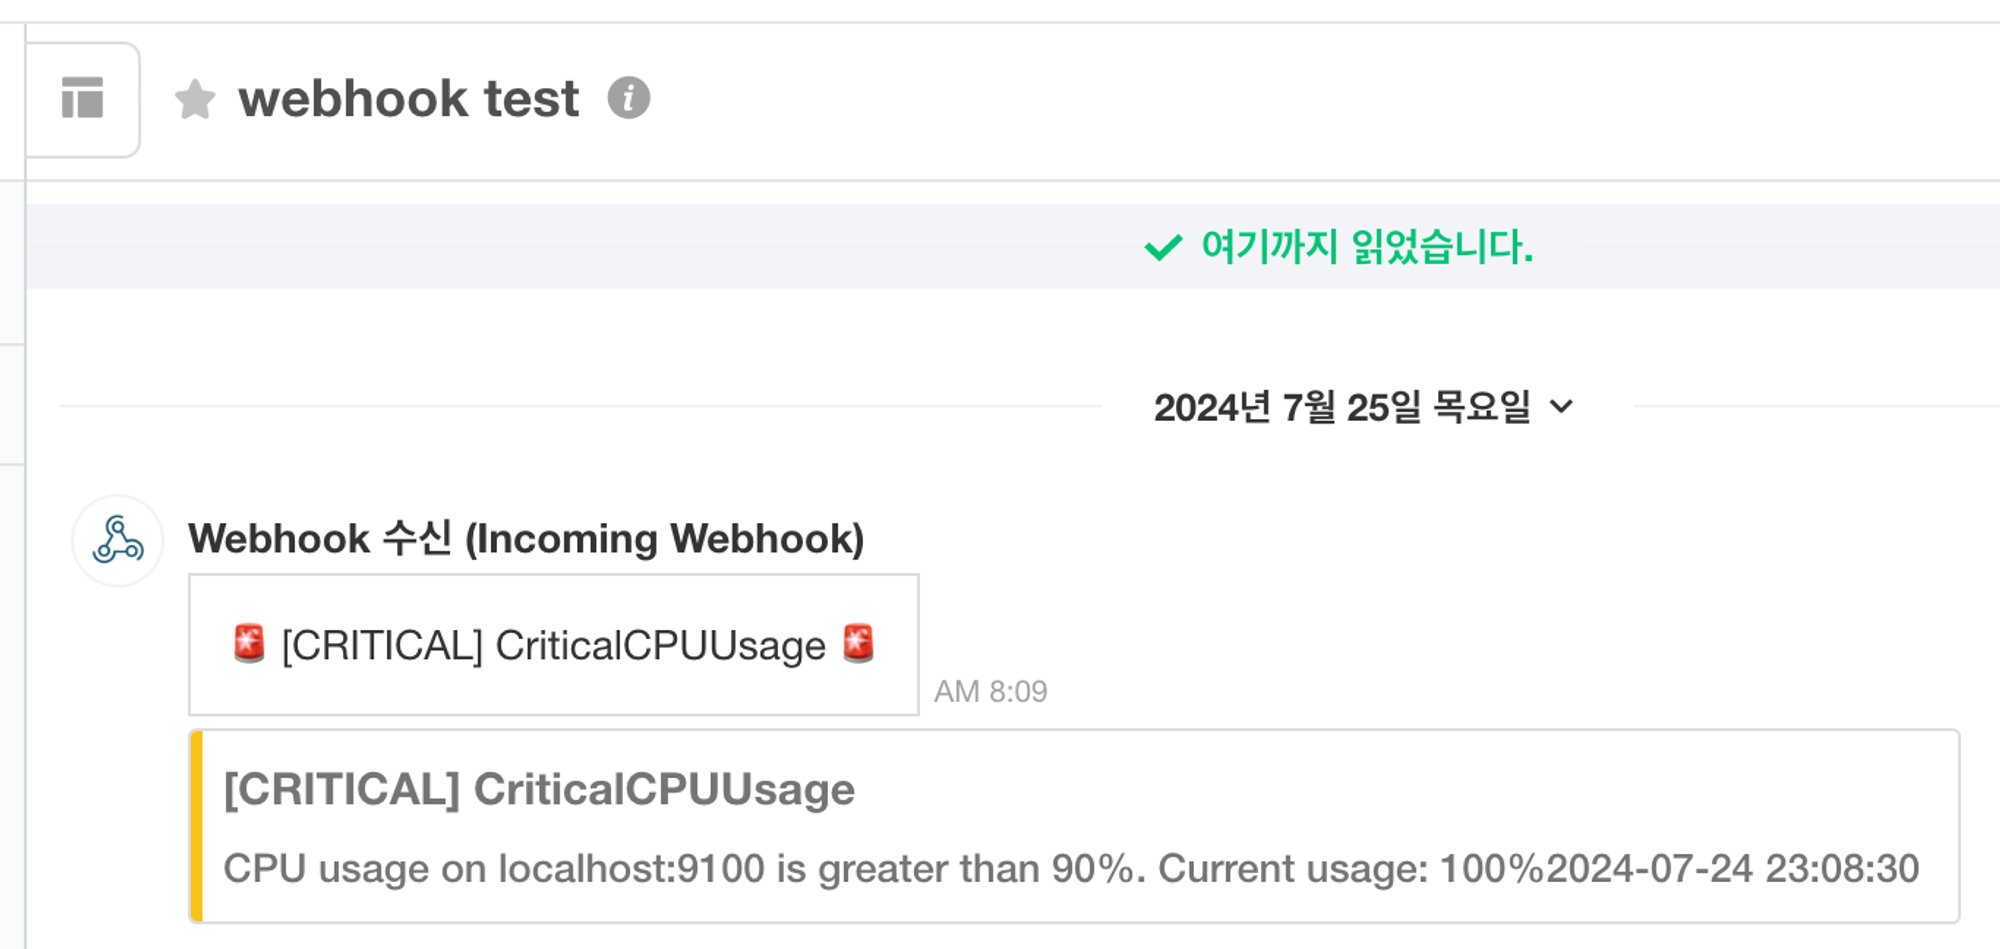
- Webhook 알림을 설정하여 특정 이벤트 발생 시 알림 메시지를 전송한다.
- Webhook 구성을 위한 Prometheus & Alertmanager 아키텍처
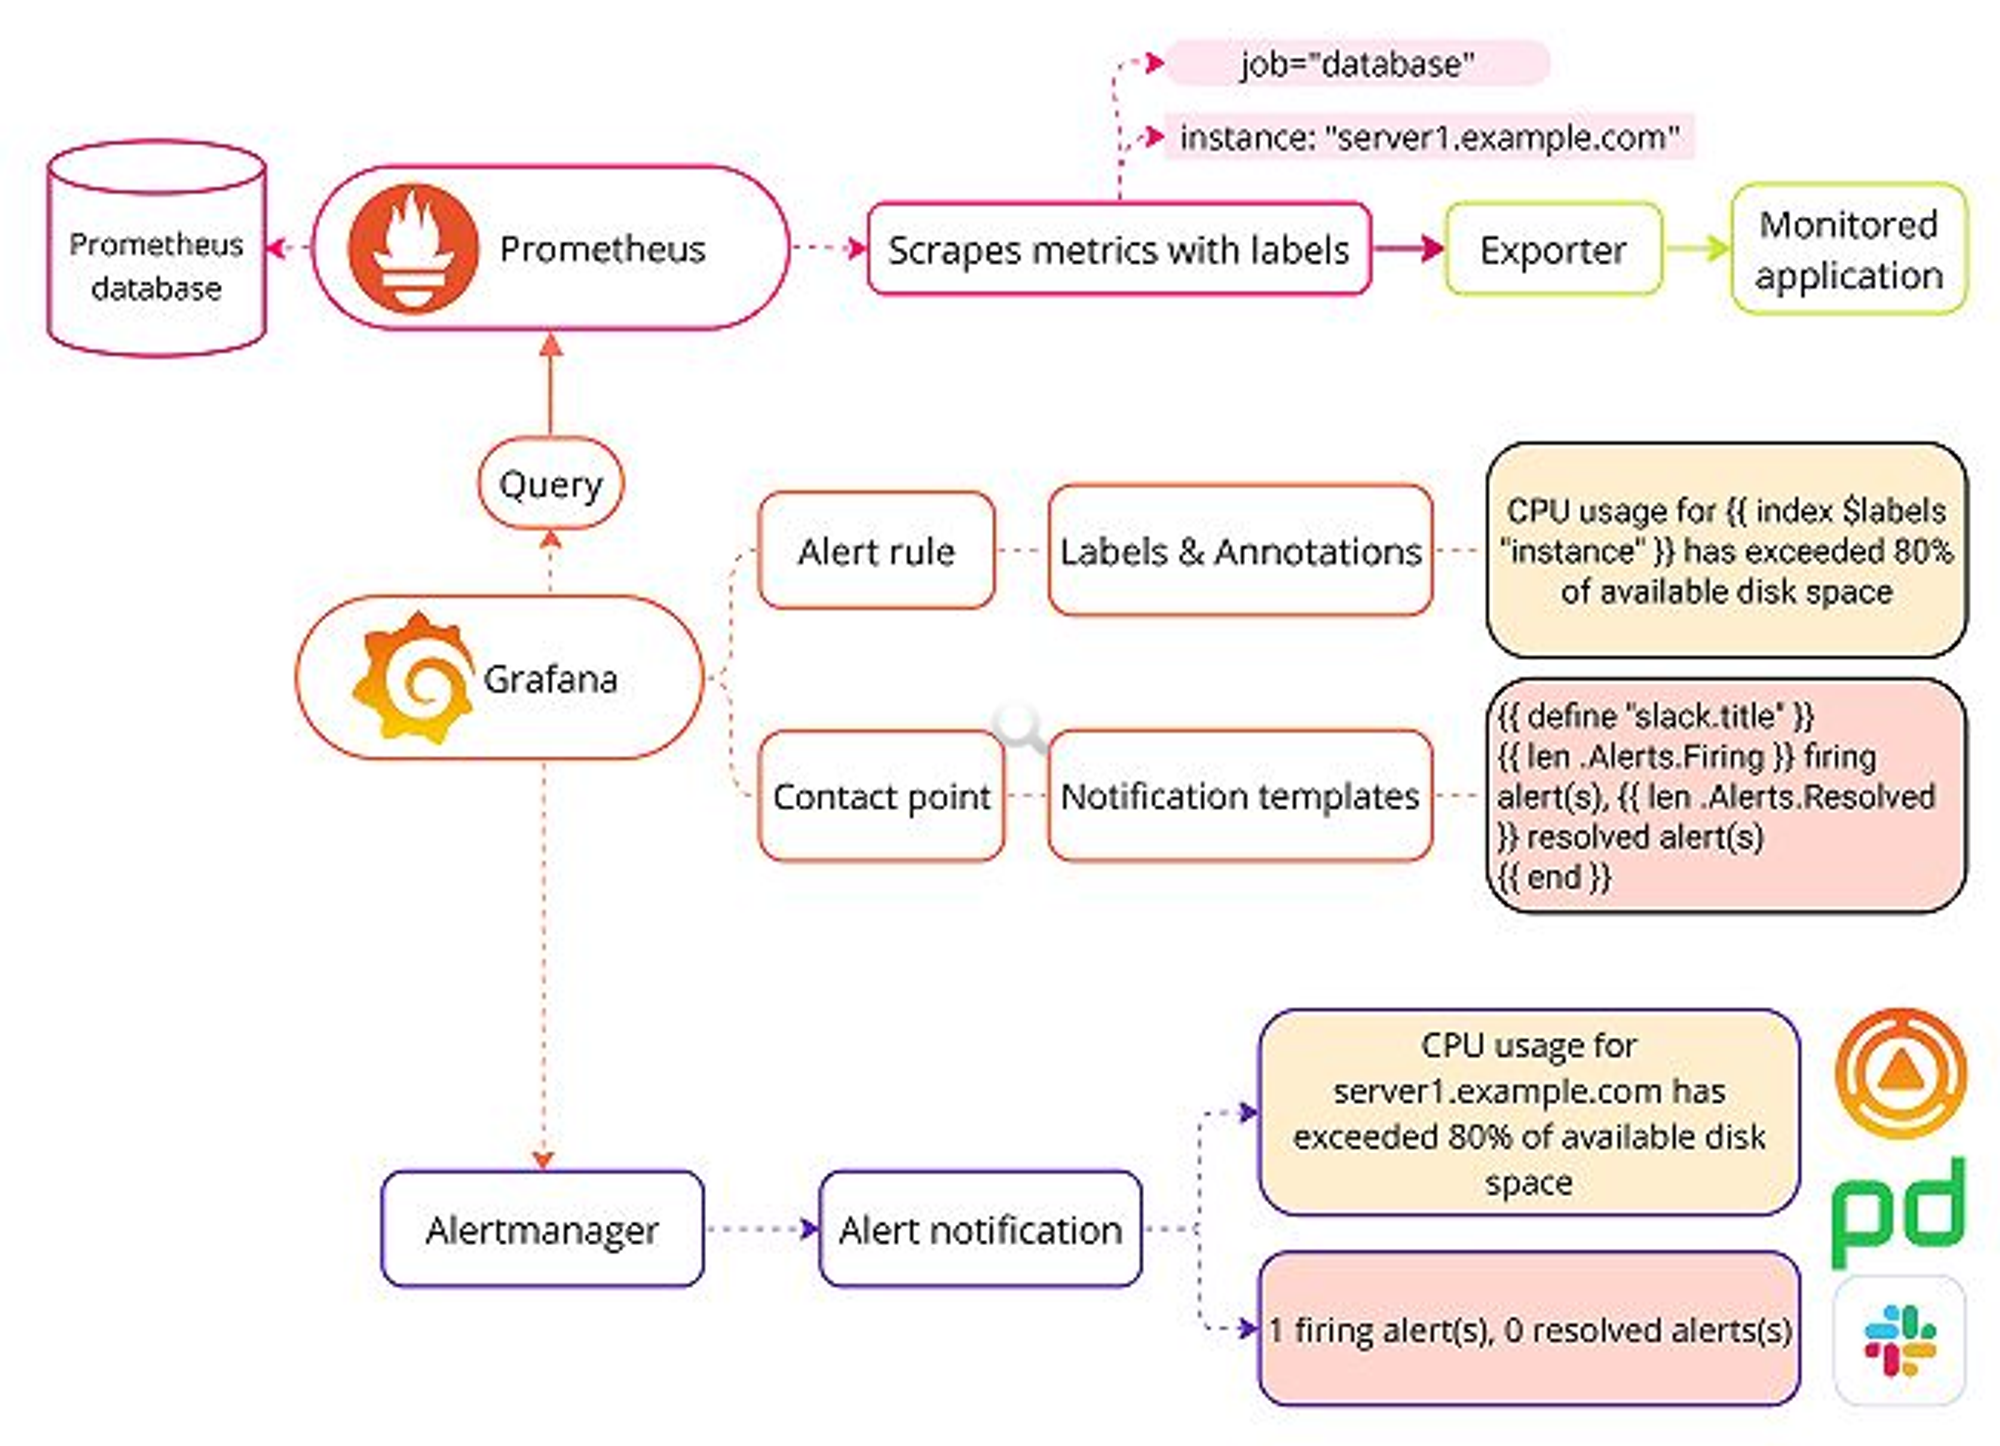
https://grafana.com/docs/grafana/latest/alerting/fundamentals/notifications/templates/
Prometheus AlertManager
설치
- Docker compose 파일 설정
services:
  alertmanager:
    image: prom/alertmanager:v0.27.0
    container_name: do-alertmanager
    restart: unless-stopped
    ports:
    - 9300:9093
    volumes:
    - ./conf/alertmanager/alertmanager.yml:/etc/alertmanager/alertmanager.yml
    - ./data/alertmanager:/data
    command:
      - '--config.file=/etc/alertmanager/alertmanager.yml'
- '--storage.path=/data'- Prometheus 설정 수정 및 rules 파일 추가
- prometheus.yml
global:
  scrape_interval: 15s
  evaluation_interval: 10s
rule_files:
  - rules.yml
  - cpu_rules.yml
  - mem_rules.yml
  - cpu_recording_rules.yml
  - mem_recording_rules.yml
alerting:
  alertmanagers:
  - static_configs:
    - targets: ['localhost:9300']
    scheme: http
    timeout: 10s
    api_version: v2
scrape_configs:
  - job_name: 'prometheus'
    scrape_interval: 5s
    static_configs:
      - targets: ['localhost:9090']
  - job_name: 'node_exporter'
    static_configs:
      - targets: ['localhost:9100']
  - job_name: 'cadvisor'
    static_configs:
- targets: ['localhost:9200']- rules.yml
- Instance 비정상 종료시에 대한 rule로써, instance down을 모니터링할 대상 서버에 대한 rule
groups: - name: AllInstances rules: - alert: InstanceDown expr: up == 0 for: 1m annotations: title: 'Instance {{ $labels.instance }} down' description: '{{ $labels.instance }} of job {{ $labels.job }} has been down for more than 1 minute.' labels: severity: 'critical' - cpu_rules.yml
groups:
  - name: CPUThreshold
    rules:
      - alert: HighCPUUsage
        expr: job:cpu_usage:avg1m > 50
        for: 3m
        labels:
          severity: warning
        annotations:
          summary: "High CPU usage on {{ $labels.instance }}"
          description: "CPU usage on {{ $labels.instance }} is greater than 50%. Current usage: {{ $value }}%"

      - alert: CriticalCPUUsage
        expr: job:cpu_usage:avg1m > 90
        for: 1m
        labels:
          severity: critical
        annotations:
          summary: "Critical CPU usage on {{ $labels.instance }}"
description: "CPU usage on {{ $labels.instance }} is greater than 90%. Current usage: {{ $value }}%"- mem_rules.yml
groups:
  - name: MemoryThreshold
    rules:
      - alert: HighMemoryUsage
        expr: job:memory_usage > 60
        for: 3m
        labels:
          severity: warning
        annotations:
          summary: "High Memory usage on {{ $labels.instance }}"
          description: "Memory usage on {{ $labels.instance }} is greater than 60%. Current usage: {{ $value }}%"

      - alert: CriticalMemoryUsage
        expr: job:memory_usage > 90
        for: 1m
        labels:
          severity: critical
        annotations:
          summary: "Critical Memory usage on {{ $labels.instance }}"
description: "Memory usage on {{ $labels.instance }} is greater than 90%. Current usage: {{ $value }}%"- cpu_recording_rules.yml
- cpu_rules 규칙에 현재 값을 변수로써 사용하기 위한 rule
groups:
  - name: recording-rules
    rules:
      - record: job:cpu_usage:avg1m
        expr: 100 * (1 - avg by (instance) (irate(node_cpu_seconds_total{mode="idle"}[1m])))
- mem_recording_rules.yml
- mem_rules 규칙에 현재 값을 변수로써 사용하기 위한 rule
groups:
  - name: recording-rules
    rules:
      - record: job:memory_usage
        expr: 100 * (1 - (node_memory_MemAvailable_bytes / node_memory_MemTotal_bytes))
작성한 파일을 ./conf/prometheus/ 경로에 저장
- AlertManager 설정 파일
route:
  group_by: ['alertname']
  #group_wait: 30s
  #group_interval: 5m
  # repeat_interval: 5m
  receiver: 'default'
  routes:
    - match:
        alertname: 'HighCPUUsage'
      receiver: 'cpu-warning'
      repeat_interval: 10m
    - match:
        alertname: 'CriticalCPUUsage'
      receiver: 'cpu-critical'
      repeat_interval: 1m
    - match:
        alertname: 'HighMemoryUsage'
      receiver: 'memory-warning'
      repeat_interval: 10m
    - match:
        alertname: 'CriticalMemoryUsage'
      receiver: 'memory-critical'
      repeat_interval: 1m
    - match:
        alertname: 'InstanceDown'
      receiver: 'instance-down'
      repeat_interval: 1m

receivers:
  - name: 'default'
  - name: 'cpu-warning'
    webhook_configs:
      - url: 'http://172.17.0.1:9800/prom-alert'
  - name: 'cpu-critical'
    webhook_configs:
      - url: 'http://172.17.0.1:9800/prom-alert'
  - name: 'memory-warning'
    webhook_configs:
      - url: 'http://172.17.0.1:9800/prom-alert'
  - name: 'memory-critical'
    webhook_configs:
      - url: 'http://172.17.0.1:9800/prom-alert'
  - name: 'instance-down'
    webhook_configs:
      - url: 'http://172.17.0.1:9800/prom-alert'

inhibit_rules:
  - source_match:
      severity: 'critical'
    target_match:
      severity: 'warning'
    equal: ['alertname', 'dev', 'instance']
이 파일을 ./conf/alertmanager/ 경로에 저장
- 위와 같이 작성 후, docker compose 초기화 및 재시작
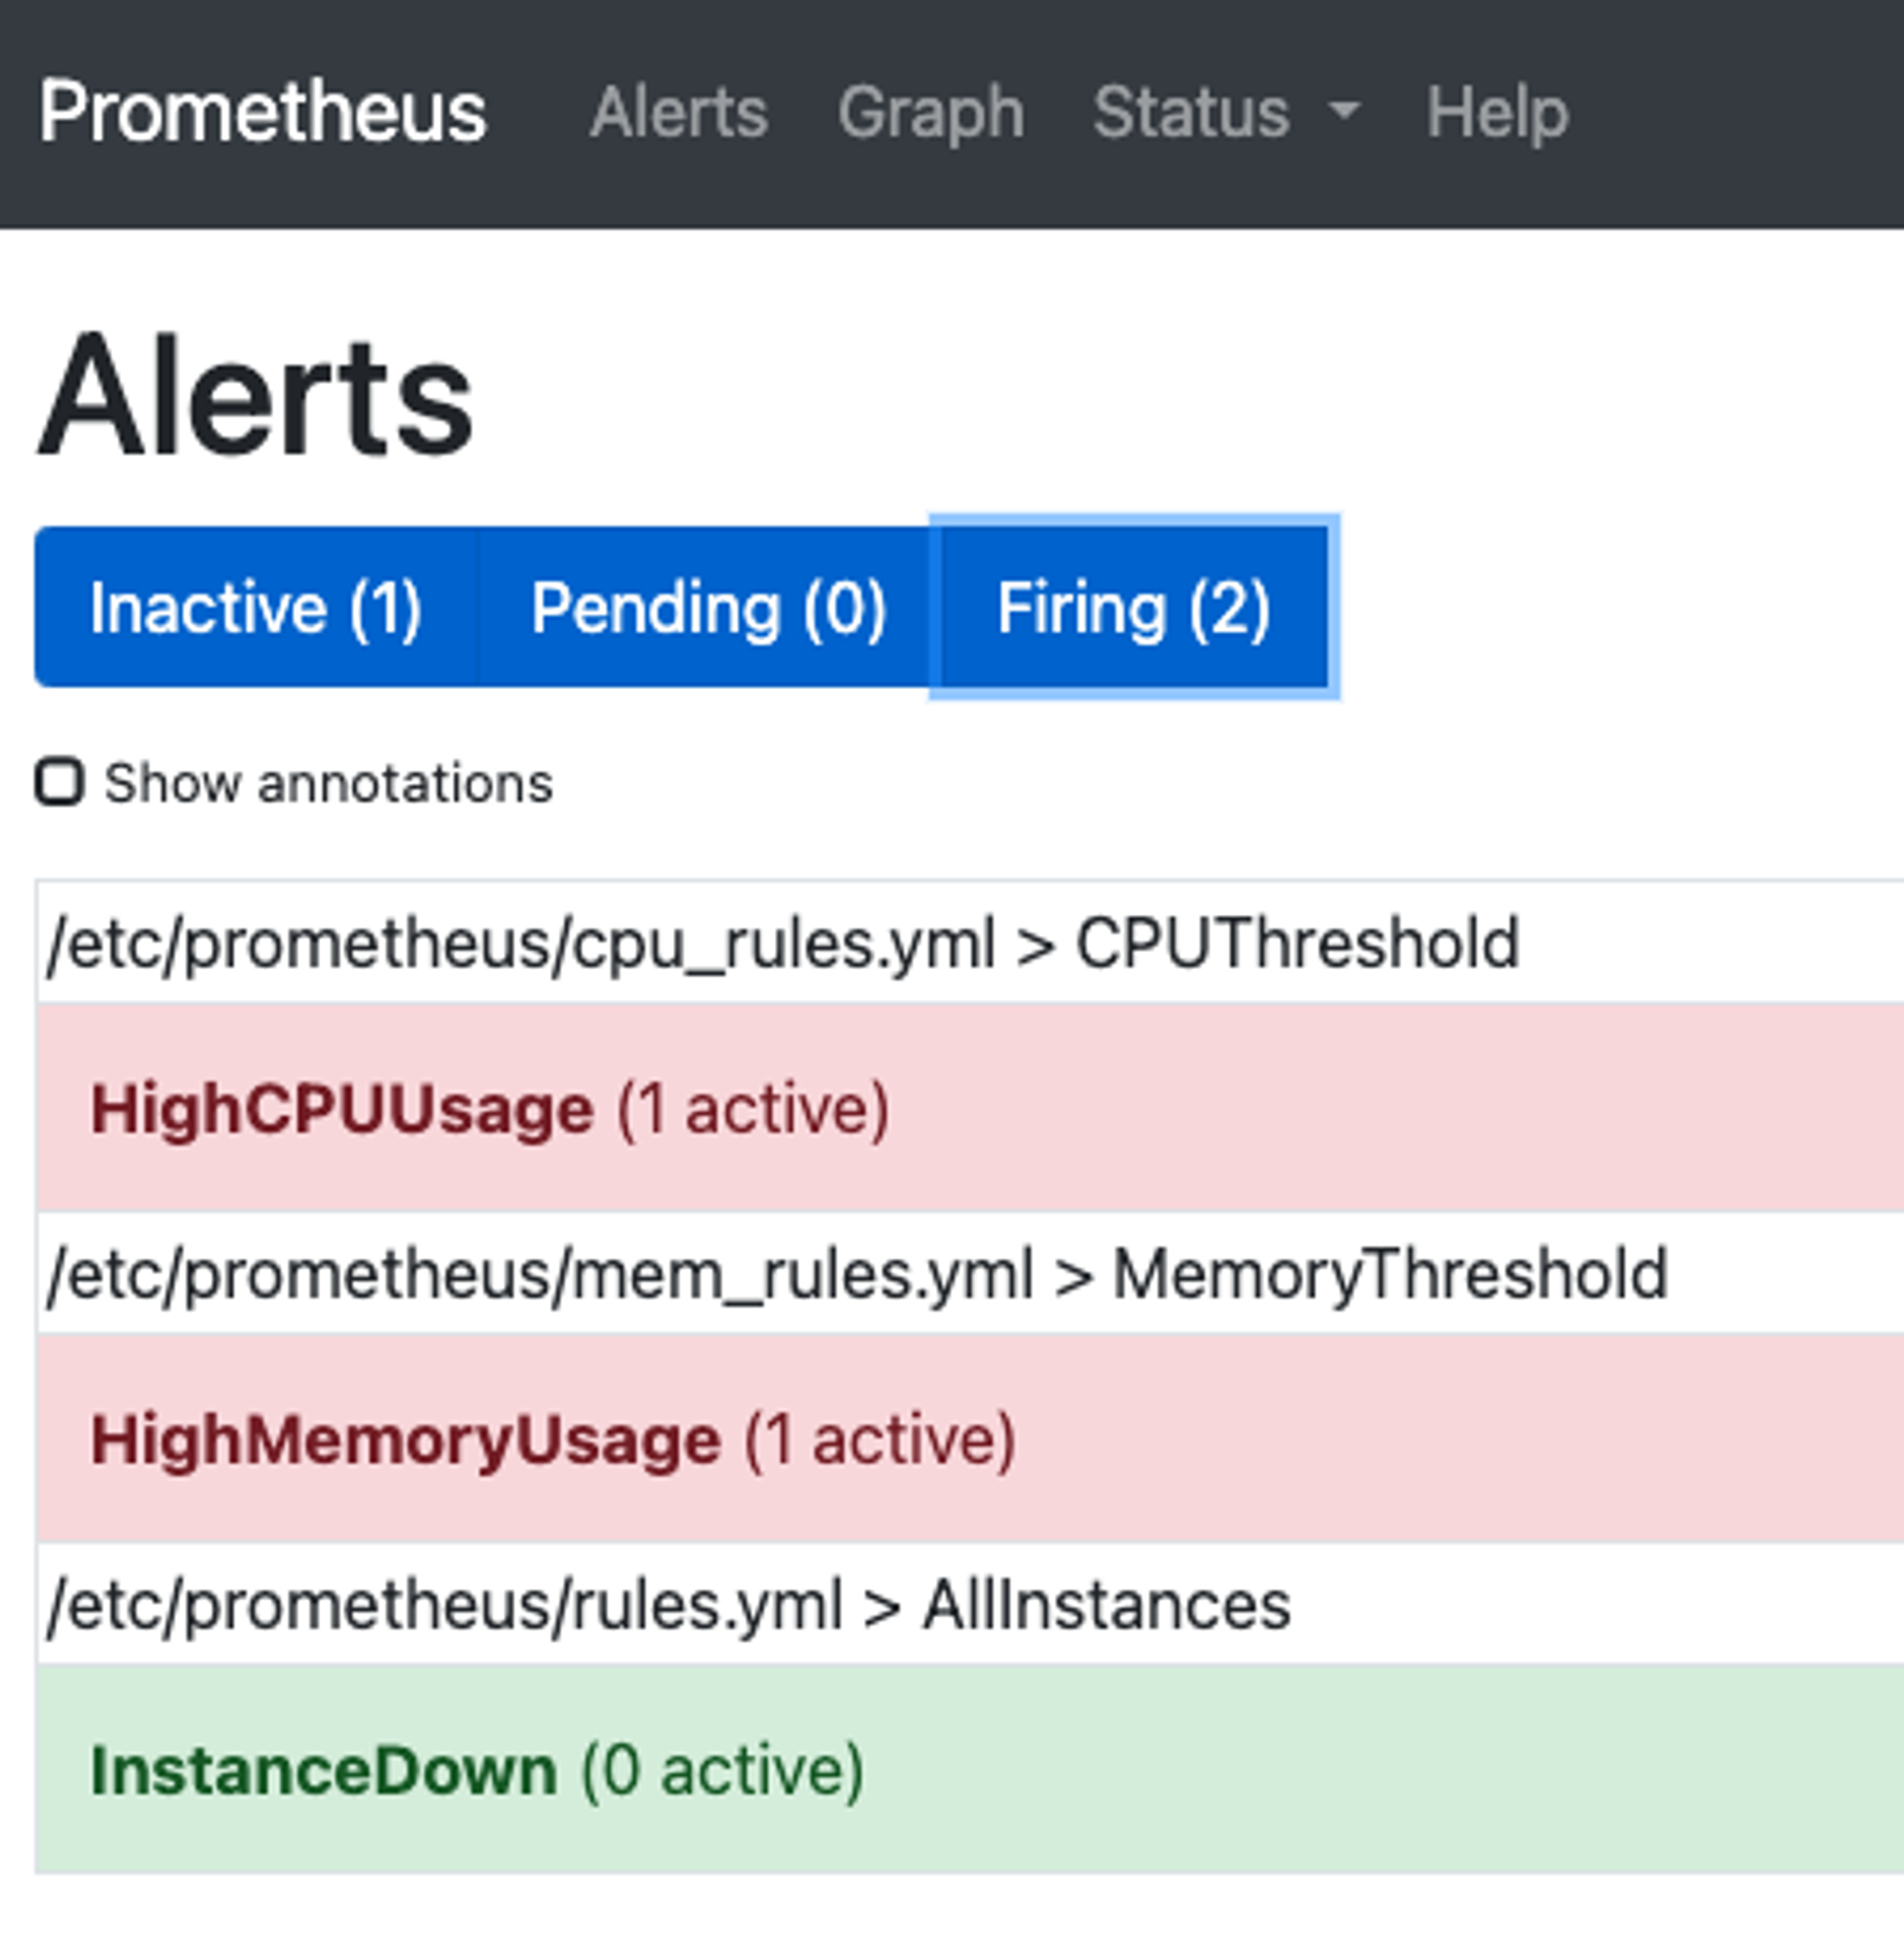
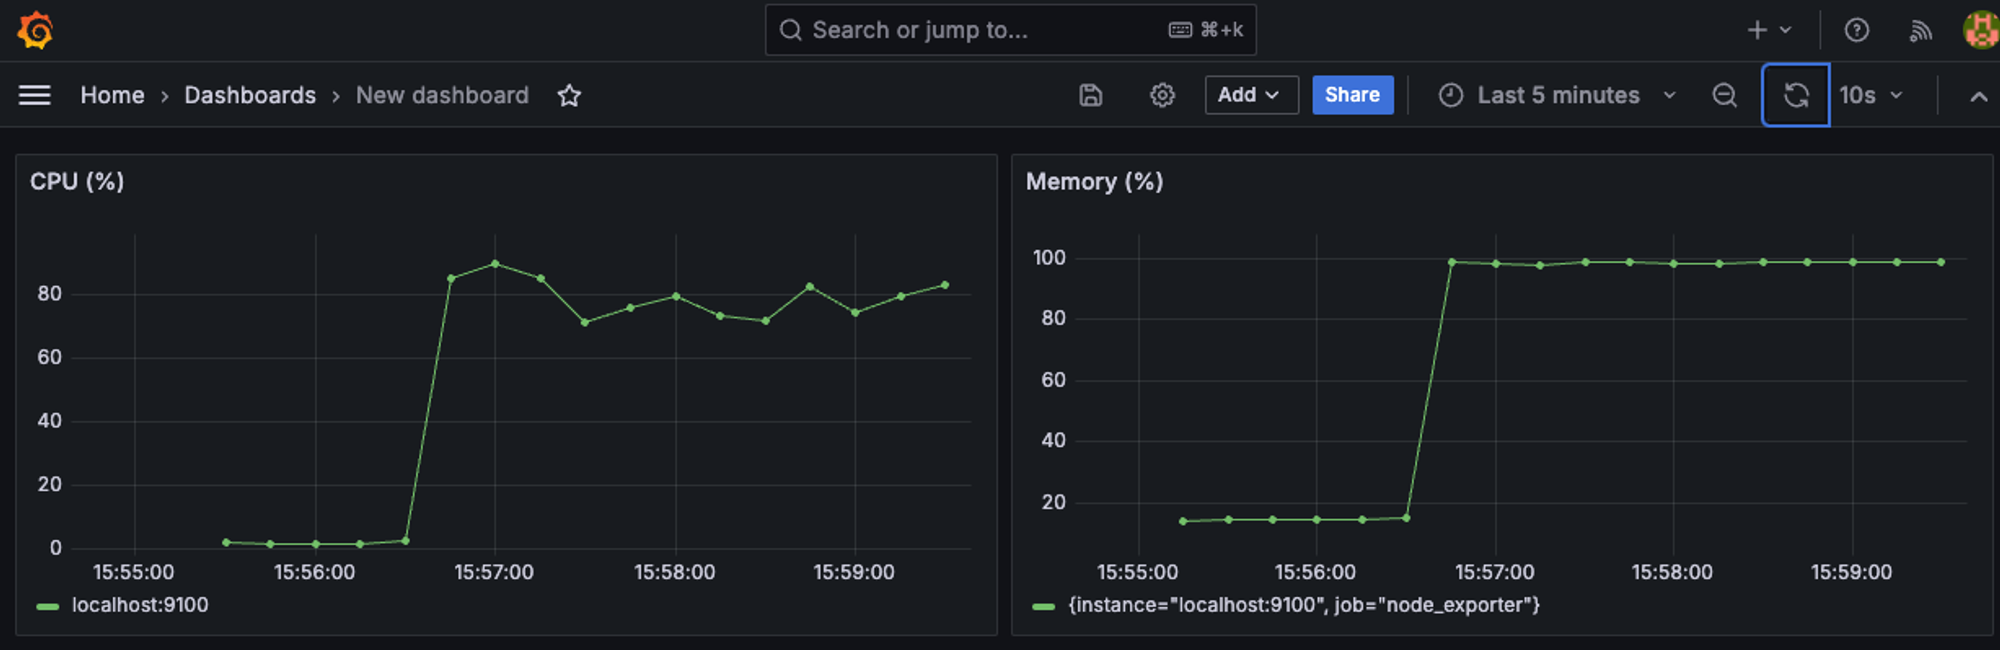
결과
- 실제로 서버에 부하를 주게되면 아래와 같이 Firing상태로 변경되어 alertmanager.yml에 지정한 receivers에 alert가 전달된다
Ubuntu Stress 패키지
- Ubuntu 환경에서 서버에 부하를 주기 위한 stress 패키지를 설치
sudo apt install stress- 사용 명령어
명령어 도움말
stress --help

Stress -c <코어수>
지정한 코어 갯수만큼 사용량을 100%로 설정
stress -c 4

코어 수 확인
lscpu

stress --vm <프로세스 개수> --vm-bytes <사용 크기>
메모리 부하를 위한 프로세스 수, 사용할 메모리 사이즈 설정
stress --vm 2 --vm-bytes 4096m
Webhook 알림 설정
Webhook Agent 설치 및 설정
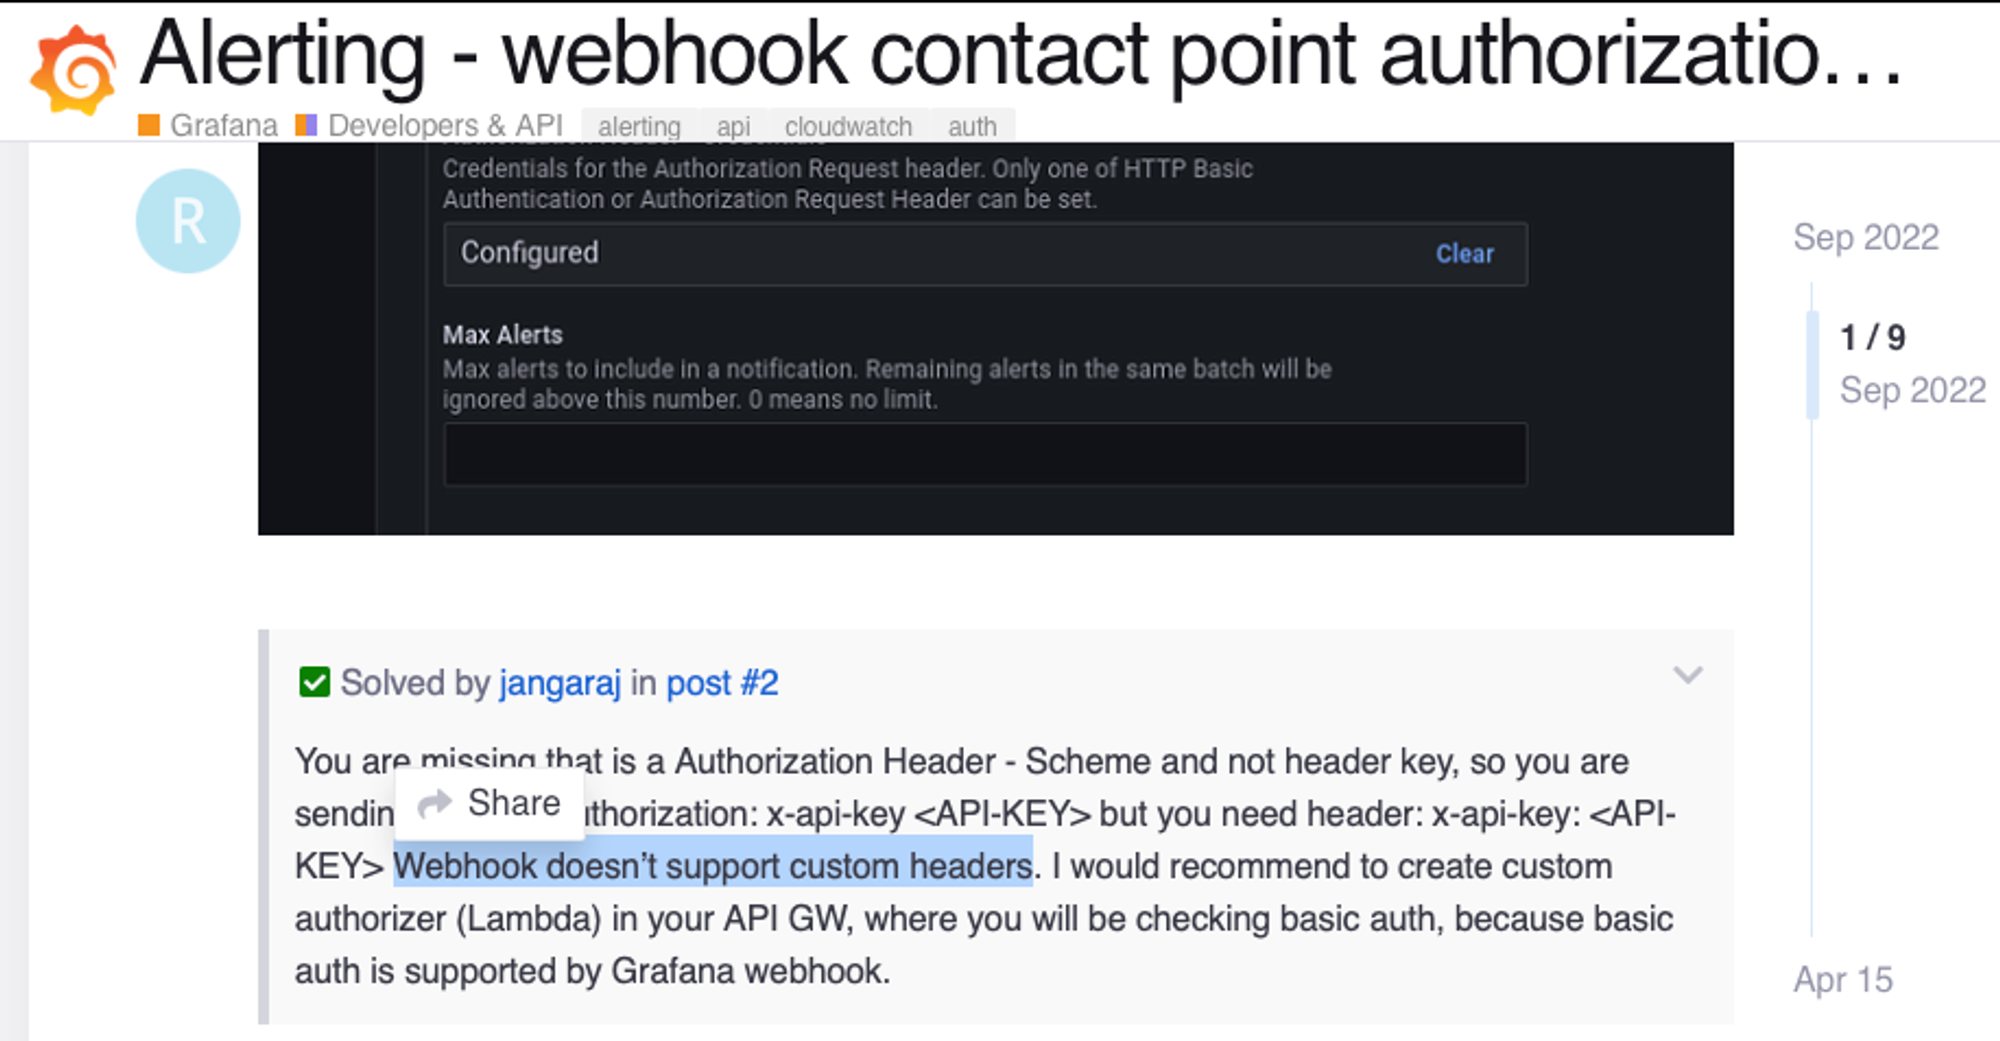
- Prometheus나 Grafana에서 지원하는 alerting은 커스텀헤더와 요청파라미터를 정의할 수 없기 때문에 필요한 경우 중개 서버가 필요
- Webhook 중개 서버를 위한 Node 서버는 아래 코드 참고
https://github.com/dobecom/DevOps/tree/main/docker/monitoring/webhook-agent - 위와 같은 Webhook Agent 서버를 docker compose에서 통합하여 운영하기 위해 개인의 Docker Hub에 image를 push하여 사용 가능
Docker Hub 업로드하기
- Mac 환경(예: M1)에서 Image 빌드할 경우 플랫폼 호환성 문제가 있기 때문에 아래처럼 Dockerfile에 플랫폼을 지정해줘야 함
FROM --platform=linux/amd64 node:20-alpine
WORKDIR /app
COPY package*.json ./
RUN npm install
COPY . .
RUN npm run build
ENV PORT=3000
EXPOSE $PORT
CMD [ "npm", "run", "start:prod" ]
- .env 예시
# WEBHOOK WEBHOOK_TYPE=TELEGRAM # Telegram or Jandi TELEGRAM_API_TOKEN=token TELEGRAM_CHANNEL_NAME=@channel JANDI_TOPIC_PATH=path - 이미지 만들기
- docker build -t user-id/webhook-agent .
- docker login
- docker tag user-id/webhook-agent user-id/webhook-agent:1.0
- docker push user-id/webhook-agent:1.0
- docker-compose.yml에 .env파일을 활용하여 설정 값은 파라미터에 따라 docker run되도록 처리
-
Host서버에 docker-compose.yml파일과 동일한 경로에 .env파일을 수동으로 추가해줘야함
  webhook-agent:
    image: sylvius/webhook-agent:1.0
    container_name: do-webhook-agent
    restart: unless-stopped
    environment:
      - WEBHOOK_TYPE=${WEBHOOK_TYPE}
      - TELEGRAM_API_TOKEN=${TELEGRAM_API_TOKEN}
      - TELEGRAM_CHANNEL_NAME=${TELEGRAM_CHANNEL_NAME}
      - JANDI_TOPIC_PATH=${JANDI_TOPIC_PATH}
    ports:
      - 9800:9800
-
Docker compose 파일 설정
services:
webhook-agent:
image: sylvius/webhook-agent:1.0
container_name: do-webhook-agent
restart: unless-stopped
environment:
- WEBHOOK_TYPE=${WEBHOOK_TYPE}
- TELEGRAM_API_TOKEN=${TELEGRAM_API_TOKEN}
- TELEGRAM_CHANNEL_NAME=${TELEGRAM_CHANNEL_NAME}
- JANDI_TOPIC_PATH=${JANDI_TOPIC_PATH}
ports:
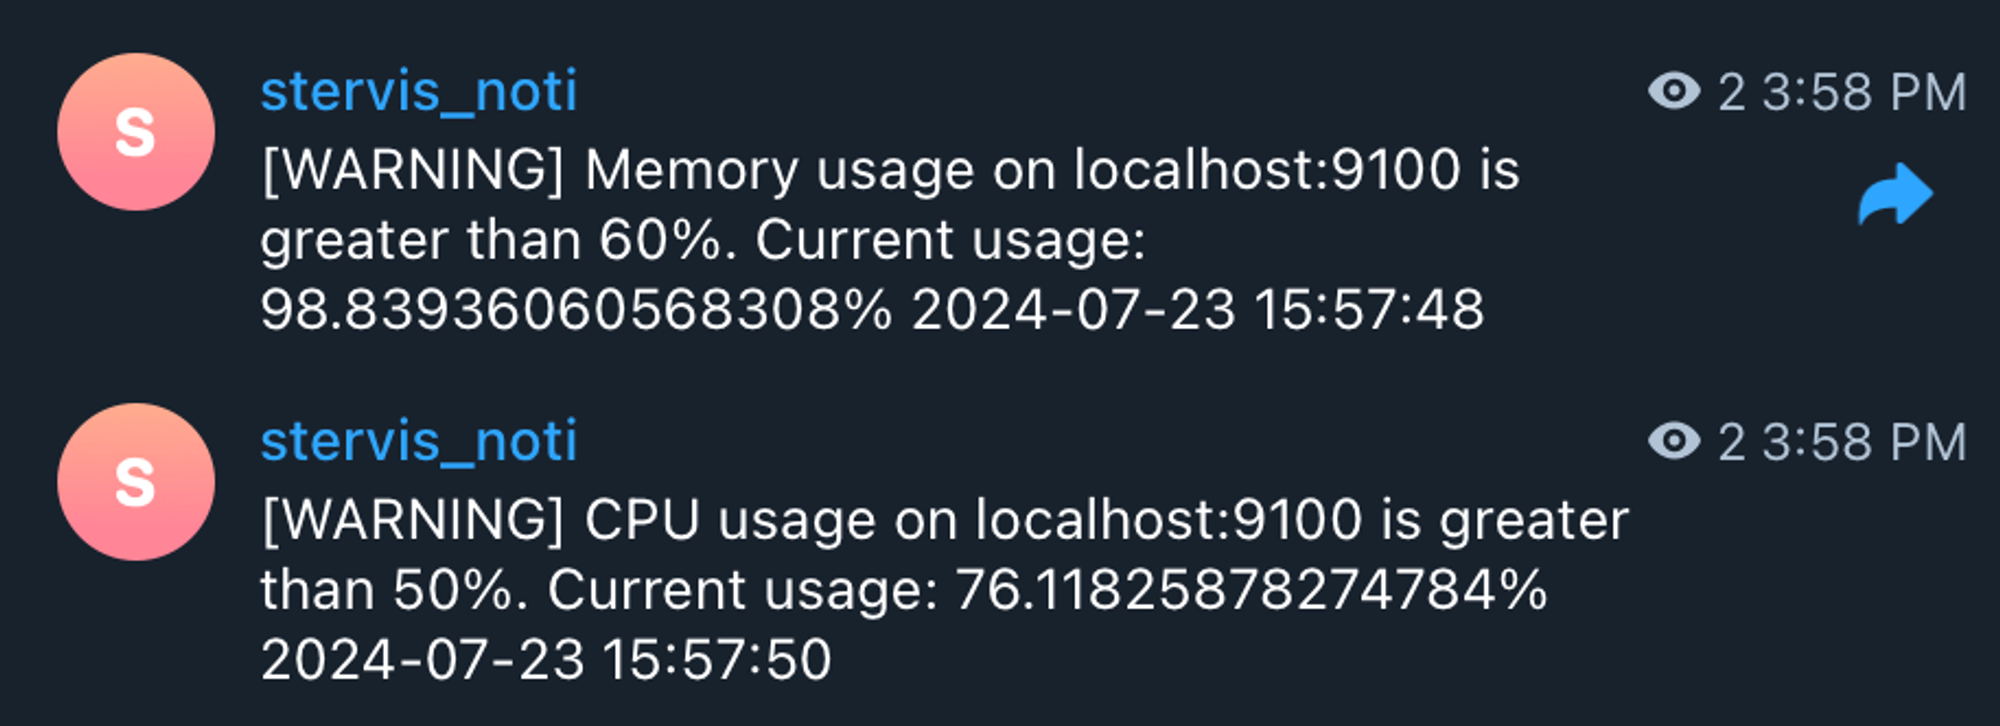
- 9800:9800결과
- Telegram 봇 연동
https://core.telegram.org/bots/api
- Jandi Webhook