1. svg 요소 선택 및 selection 객체 생성
-
svg를 추가해서 차트를 그리게 되는데 이를 위해 useRef로 svg 요소를 넣을 DOM을 선택해주고 select() 메서드를 통해 svgRef를 가리키는 selection 객체를 생성한다.
-
컴포넌트가 렌더링 된 이후에 ref에 접근하기 위해 이후에 작성할 d3의 모든 코드는 useEffect 안에 작성한다.
import { useEffect, useRef } from 'react';
import * as d3 from 'd3';

function BarChart() {
  const svgRef = useRef<SVGSVGElement | null>(null);
  const width = 1000;
  const height = 400;
  const margin = { top: 20, right: 30, bottom: 30, left: 40 };

  useEffect(() => {
    // selection 객체
    const svg = d3.select(svgRef.current).attr('viewBox', `0,0,${width},${height}`);
  }, []);

  return (
    <>
      <h1> Bar Chart </h1>
      <svg ref={svgRef} />
    </>
  );
}

export default LineChart;
select(selector)
- selector와 일치하는 첫번째 요소를 선택한다.
- selector와 일치하는 요소가 없으면 빈 selection을 반환한다. 여러 요소가 selector와 일치하는 경우 일치하는 첫 번째 요소(in document order)만 선택된다.
const svg = d3.select("p");
selection.attr(name, value)
- value가 지정된 경우 지정된 name을 가진 속성(attribute)을 선택한 요소의 value로 설정하고 이 selection을 반환한다.
selection.attr("color", "red")
- value가 지정되지 않을 경우 selection의 첫 번째 요소에 대해 지정된 속성(attribute)의 값을 반환한다. (selection에 요소가 하나만 있을 때 유용)
selection.attr("color") // "red"
2. scale 설정
-
x축과 y축 각각의 scale(척도)을 설정한다.
-
d3의 scale(척도)은 어떤 범위의 숫자를 다른 범위의 숫자로 변경해주는 메서드이다. 이를 더 확장해 숫자 이외의 값에도 적용할 수 있다.
1) x축 scale 설정
- 막대 차트의 x축 값들은 순서형 또는 범주형 차원에 대한 함수를 구성하는 scaleBand() 메서드를 사용해 척도를 만든다.
const xScale = d3
  .scaleBand()
  .domain(precipitationData.map((data) => data.date) as Iterable<string>)
  .range([margin.left, width - margin.right])
  .padding(0.3);  // 막대 사이의 간격 설정
scaleBand(domain, range)
- 지정된 domain 및 range를 사용하여 패딩, 반올림 및 중앙 정렬 없이 새로운 band scale을 구성한다.
const x = d3.scaleBand(["a", "b", "c"], [0, 960]);
linear.domain(domain)
- 도메인이 지정된 경우 scale(척도)의 도메인을 지정된 숫자 배열로 설정하고 이 척도를 반환한다.
- 배열은 두 개 이상의 요소를 포함해야 하며, 주어진 배열의 요소가 숫자가 아닐 경우 숫자로 강제 변환된다.
- 도메인을 지정하지 않은 경우 scale의 현재 도메인을 반환한다.
const xScale = d3.scaleLinear().domain([10, 130]);
linear.range(range)
- 범위가 지정된 경우 scale(척도)의 범위를 지정된 값 배열로 설정하고 이 scale(척도)를 반환한다.
- 배열은 두 개 이상의 요소를 포함해야 하며 domain과 달리 주어진 배열의 요소가 숫자일 필요는 없다.
- 범위를 지정하지 않은 경우 scale의 현재 범위를 반환한다.
const xScale = d3.scaleLinear().range([0, 960]);
2) y축 scale 설정
- 연속적인 숫자를 값으로 가지는 y축은 scaleLinear() 메서드를 선형 척도(linear scale)을 생성한다.
const yScale = d3
  .scaleLinear()
  .domain([0, d3.max(precipitationData, (data) => data.precipitation)] as [number, number])
  .range([height - margin.bottom, margin.top])
  .nice();
scaleLinear(domain, range)
- 지정된 domain 및 range를 통해 새로운 선형 척도(linear scale)을 생성한다.
d3.scaleLinear([0, 100], ["red", "blue"])
- 단일 인수가 지정되면 범위로 해석된다. 도메인 또는 범위를 지정하지 않으면 기본값은 [0, 1]로 설정된다.
d3.scaleLinear(["red", "blue"]) // default domain of [0, 1]
min(iterable, accessor)
- 주어진 iterable에서 최소값을 반환한다.
d3.min([3, 2, 1, 1, 6, 2, 4]) // 1
- 최소값을 계산하기 전에 Array.from을 호출하는 것과 유사한 접근자 함수를 지정할 수 있다.
d3.min(alphabet, (d) => d.frequency) // 0.00074
- Math.min과 달리 d3.min은 입력을 숫자로 강제하지 않는다.
d3.min(["bob", "alice", "carol"])  // "alice"
d3.min([new Date("2018-01-01"), new Date("2011-03-09")])  // 2011-03-09
max(iterable, accessor)
- 주어진 iterable에서 최대값을 반환한다.
d3.max([3, 2, 1, 1, 6, 2, 4]) // 6
- 최대값을 계산하기 전에 Array.from을 호출하는 것과 유사한 접근자 함수를 지정할 수 있다.
d3.max(alphabet, (d) => d.frequency) // 0.12702
- Math.max와 달리 d3.min은 입력을 숫자로 강제하지 않는다.
d3.max(["bob", "alice", "carol"])  // "carol"
d3.max([new Date("2018-01-01"), new Date("2011-03-09")])  // 2018-01-01
linear.nice(count)
- 도메인의 최소값과 최대값을 가장 가까운 반올림 값으로 확장시킨다. (데이터의 최소, 최대값 보다 약간 더 크게 그래프 범위를 늘려줌)
- 도메인에 3개 이상의 값이 있는 경우 첫 번째 값과 마지막 값만 확장시킨다.
const x = d3.scaleLinear([0.241079, 0.969679], [0, 960]).nice();
x.domain();  // [0.2, 1]
- 인수로 count를 전달하면 반올림 값으로 확장시키는 크기를 제어할 수 있다.
const x = d3.scaleLinear([0.241079, 0.969679], [0, 960]).nice(40);
x.domain();  // [0.24, 0.98]
3. x, y 축 그리기
-
x축과 y축을 생성하여 렌더링한다.
-
축(axis)을 생성할 때 scale을 넘겨주면 range의 범위를 적절히 판단하여 축을 생성하게 된다.
1) x축 생성
- axisBottom() 메서드를 이용해 x축이 아래에 위치하도록 한다. 여기서 axisBottom()은 axis generator를 만드는 것이기 때문에 실제로 axis를 렌더링하기 위해서는 axis를 추가하고자 하는 곳에 call() 메서드로 호출해야 한다.
const xAxis = (g: d3.Selection<SVGGElement, unknown, null, undefined>) =>
  g.attr('transform', `translate(0,${height - margin.bottom})`).call(d3.axisBottom(xScale));

// x 축 그리기
svg.append<SVGGElement>('g').call(xAxis);
call()
- 지정한 함수를 정확히 한 번 호출하여 인수와 함께 selection을 반환한다. 이것은 손으로 함수를 호출하는 것과 같으나 메소드 체인을 용이하게 한다.
function name(selection, first, last) {
  selection
      .attr("first-name", first)
      .attr("last-name", last);
}

// name 함수 호출 시 call 미사용
name(d3.selectAll("div"), "John", "Snow");
// name 함수 호출 시 call 사용
d3.selectAll("div").call(name, "John", "Snow");
axisBottom(scale)
- scale을 인수로 받아 아래쪽 방향으로 axis generator(축 생성기)를 만든다. 이 방향에서 눈금(ticks)은 수평 방향의 도메인 아래에 그려진다.

2) y축 생성
- axisLeft() 메서드를 이용해 y축이 왼쪽에 위치하도록 한다.
const yAxis = (g: d3.Selection<SVGGElement, unknown, null, undefined>) =>
  g.attr('transform', `translate(${margin.left},0)`).call(d3.axisLeft(yScale));

// y축 그리기
svg.append<SVGGElement>('g').call(yAxis);
axisLeft(scale)
- scale을 인수로 받아 왼쪽 방향으로 axis generator(축 생성기)를 만든다. 이 방향에서 눈금(ticks)은 수직 방향의 도메인 왼쪽에 그려진다.
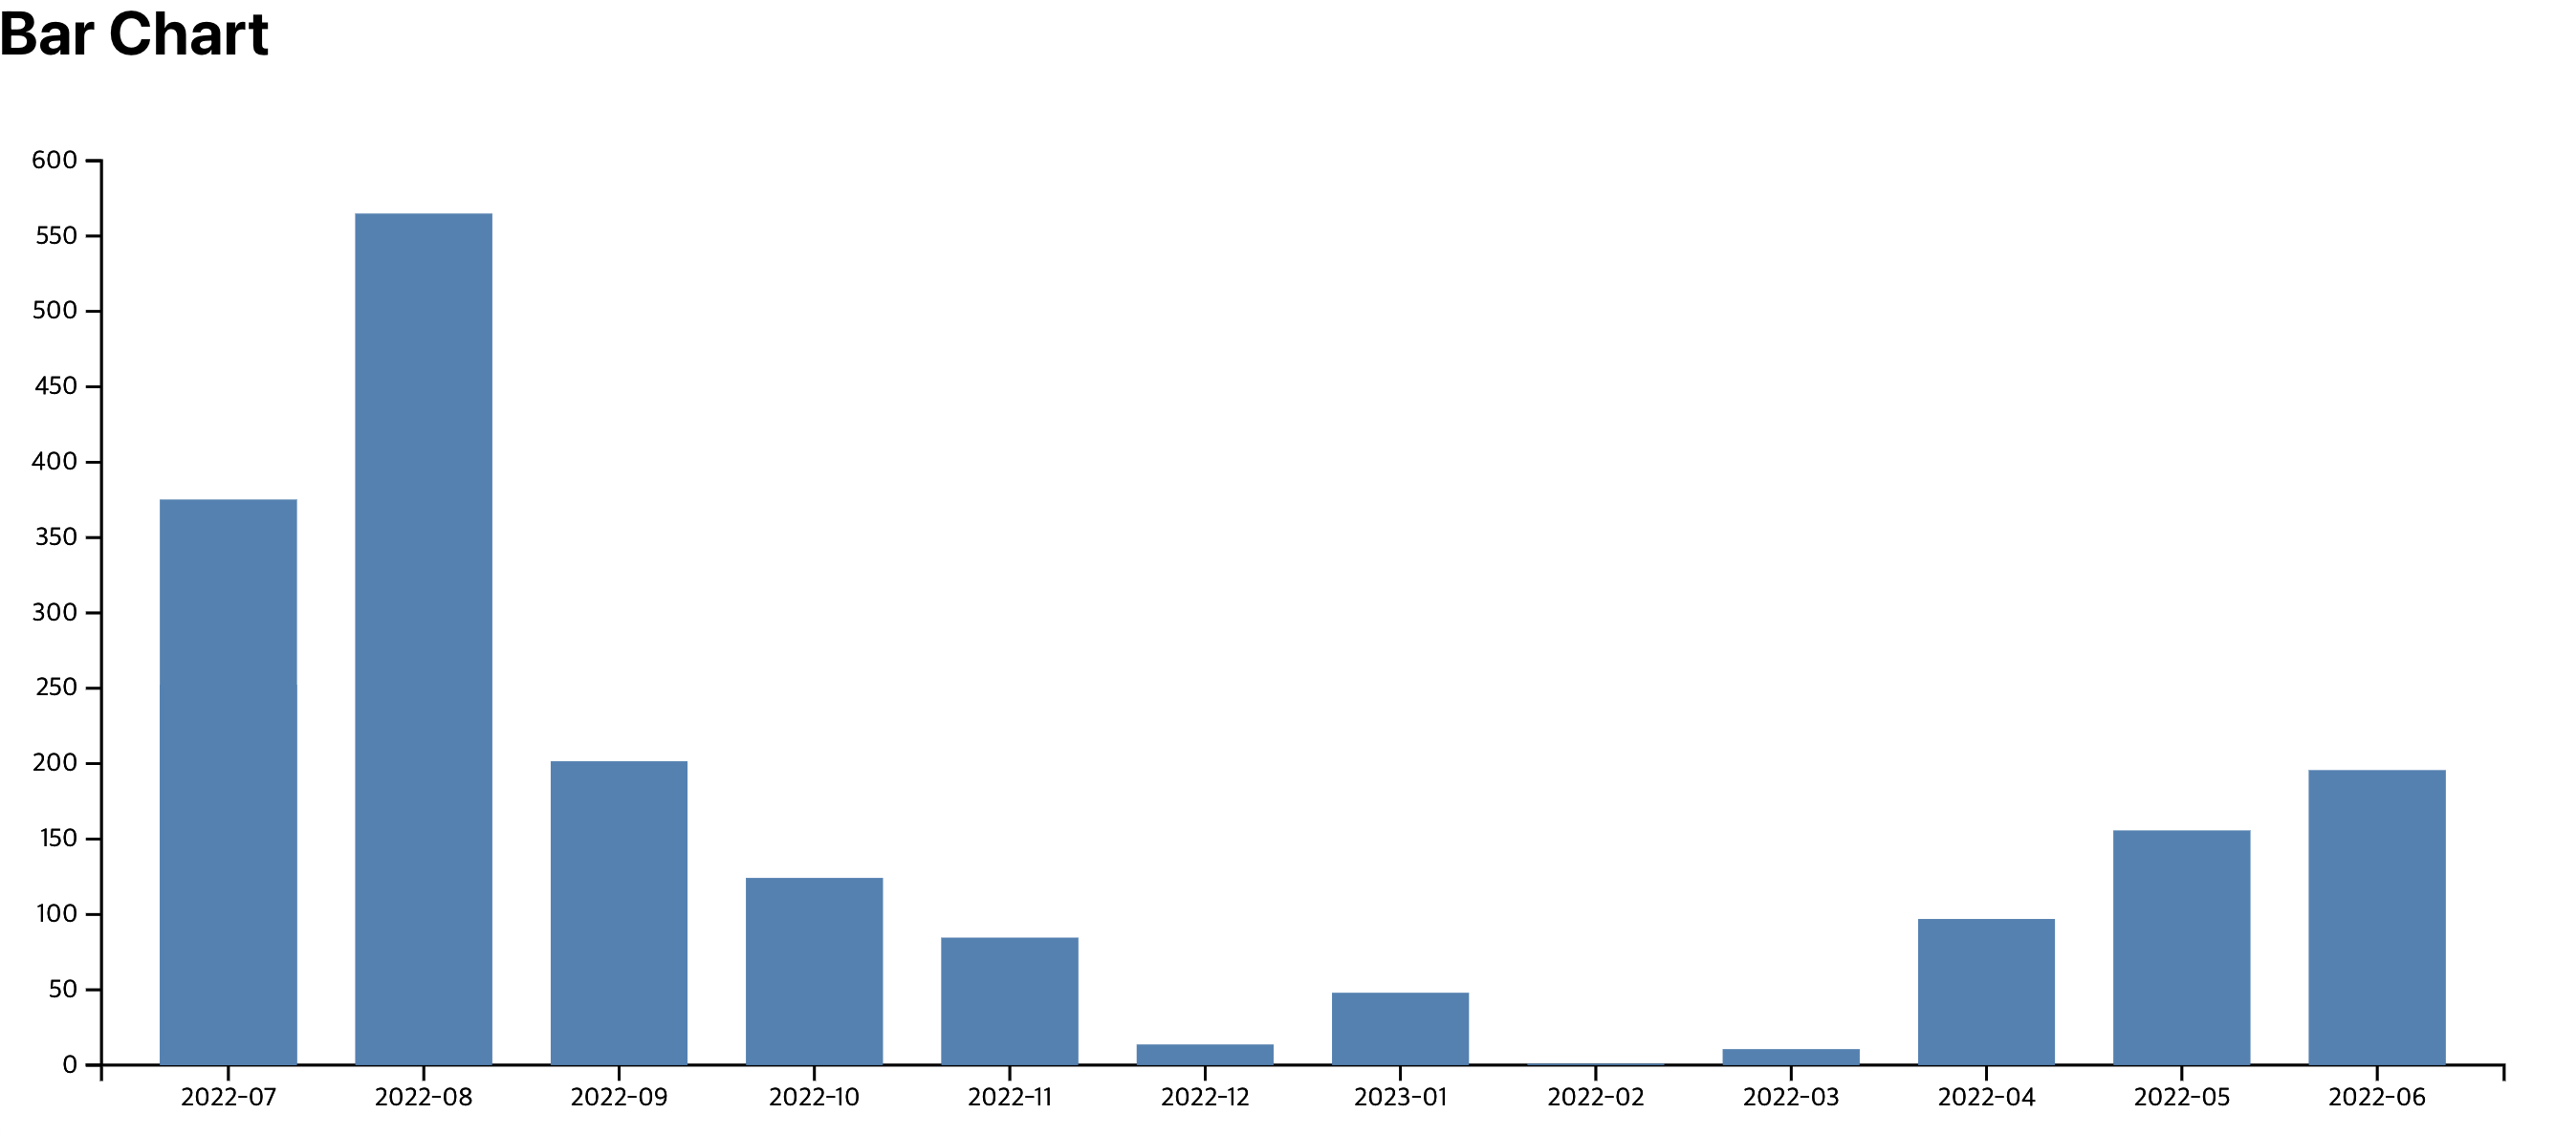
4. Bar 그리기
- Line Chart를 그릴 때는 데이터 조인 메서드로 datum()을 사용했는데 Line Chart는 하나의 연결된 데이터를 가지고 있기 때문에 대상 요소에 단일 데이터/그룹을 연결해 주는 datum()을 사용했었다. 하지만 Bar Chart에서는 데이터 세트를 연결해 주는 data() 메서드를 사용한다.
svg
  .append('g')
  .selectAll('rect')
  .data(precipitationData)
  .enter()
  .append('rect')
  .attr('x', (data) => xScale(data.date) as number)
  .attr('y', (data) => yScale(data.precipitation))
  .attr('width', xScale.bandwidth())
  .attr('height', (data) => yScale(0) - yScale(data.precipitation))
  .attr('class', 'bar-chart')
  .attr('fill', 'steelblue');
selection.append(type)
- type이 string인 경우 해당하는 태그의 새로운 요소를 selection의 가장 마지막 자식으로 추가한다.
d3.selectAll("div").append(() => document.createElement("p"));
// 아래는 위와 동일하게 div요소에 p태그를 추가한다.
d3.selectAll("div").append("p");
selectAll(selector)
- selector와 일치하는 모든 요소를 선택한다.
- 요소는 documents의 위에서 부터 아래(top-to-bottom)로 선택된다. documents의 요소가 selector와 일치하지 않거나 selector가 null 또는 undefined인 경우 빈 selection을 반환한다.
const p = d3.selectAll("p");
selection.data(data, key)
- 지정한 데이터 배열을 선택한 요소와 바인딩하여 업데이트 selection을 나타내는 새로운 selection(데이터에 성공적으로 바인딩된 요소)을 반환한다.
- 새 데이터에 해당하는 요소를 추가하거나 제거하는데 사용할 수 있는 반환된 selection에 대한 enter, exit selction을 정의한다.
selection.enter()
- selection에 바인드된 데이터들 중에 아직 실제 문서 요소를 가지지 못하는 것들을 찾아내서 가상의 객체로 만들어준다.
6. 최종 결과
참고

FE Developer