개요
- Streamlit을 이용한 실습
Streamlit란?
- 데이터를 보여주는 것에 초점을 맞춘 프레임워크
- python으로 HTML없이 웹 프론트를 구축할 수 있음
- HTML을 직접 만질 수 없는 단점이 있음
- 모델 결과를 보여주거나 결과물을 보여줄 때 사용하기 좋음
실습 1
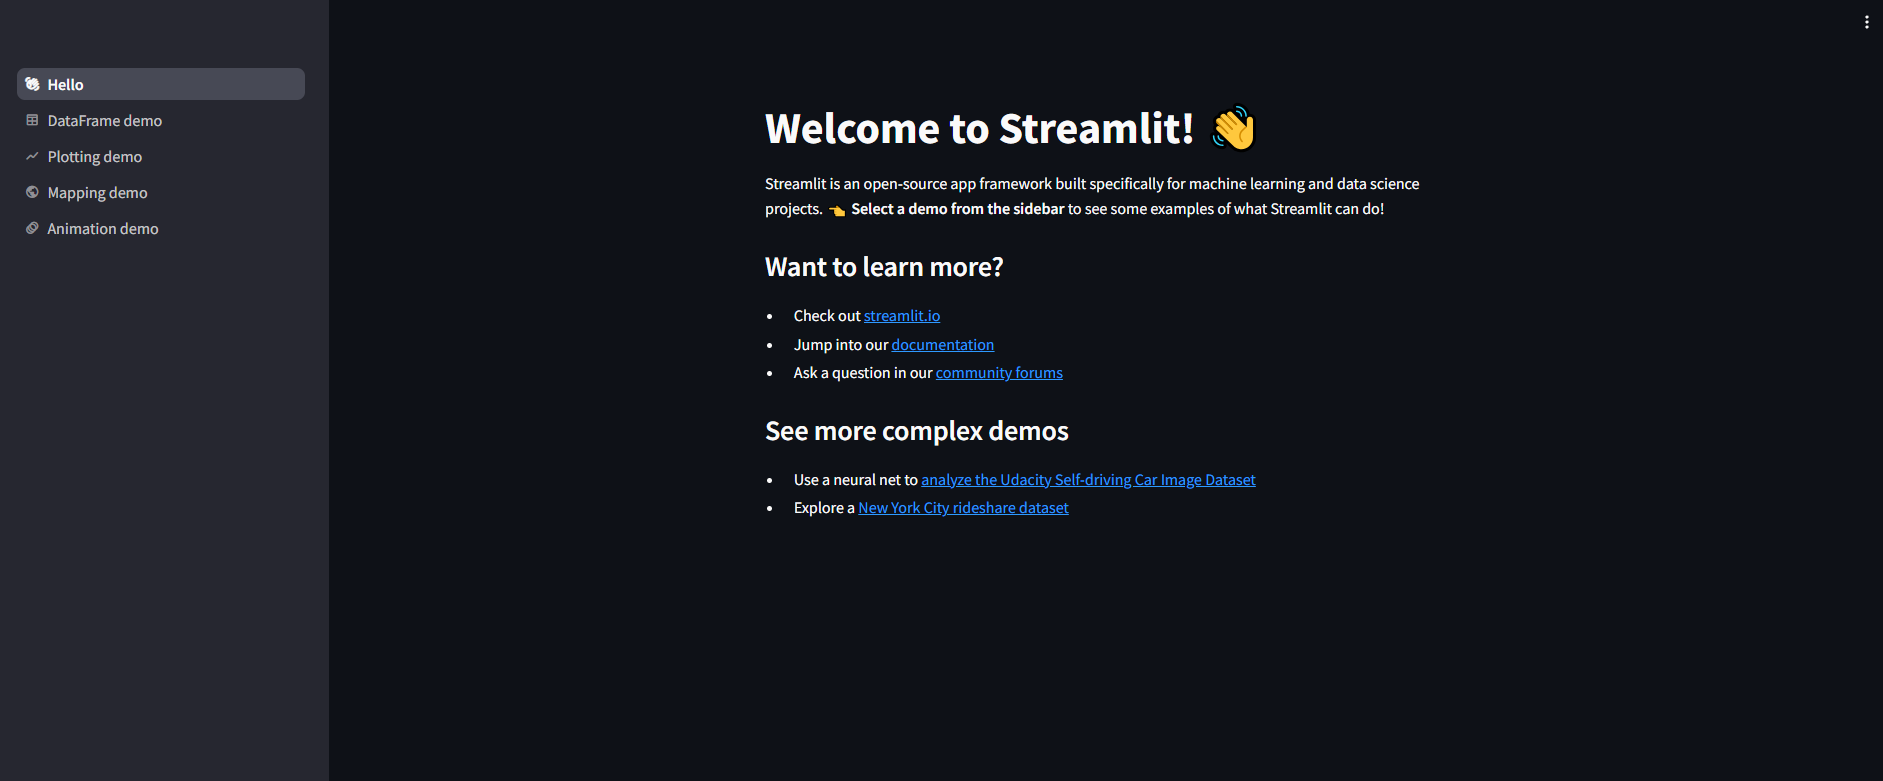
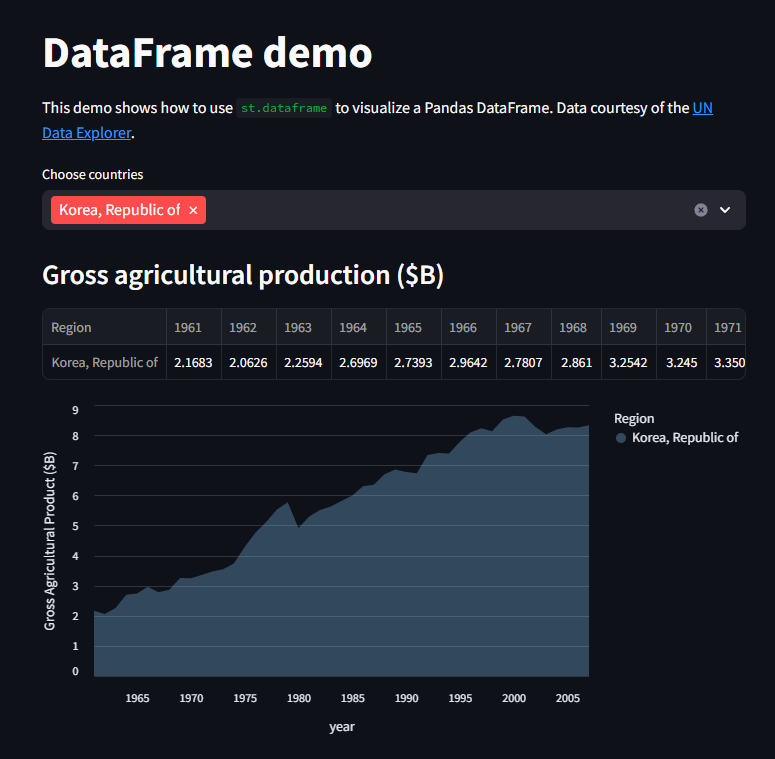
- 기본 제공해주는 웹페이지 열어보기
- Streamlit 설치 후 터미널에
streamlit hello를 치면 streamlit의 기본 화면으로 접속 가능함 - 예시 코드를 볼 수 있음
실습 2
- 웹 페이지 만들어보기
import streamlit as st
st.title(':blue[파이썬 프로젝트 test title]')
st.header('test header')
st.subheader('test sub header')
st.divider()
st.image('./images/main_4.jpg')
st.divider()
st.markdown('# test markdown')
st.markdown('## test markdown')
st.markdown('### test markdown')
st.write('# 오늘은 화요일 :notebook:')
st.caption('부연설명 역할')
st.write('# 내일은 수요일:pizza:')
st.divider()
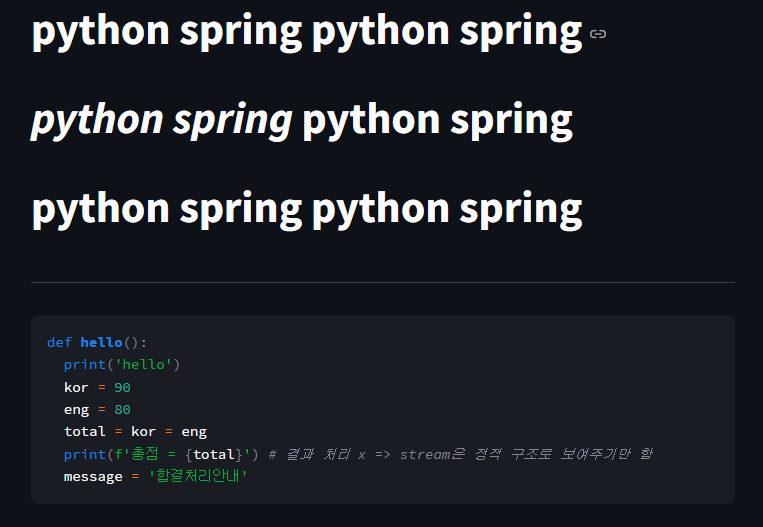
st.markdown('# **python spring** python spring') #blod 진하게
st.write('# *python spring* python spring') # 이태릭
st.markdown('# python spring python spring') #보통
st.divider()
st.code("""
def hello():
print('hello')
kor = 90
eng = 80
total = kor = eng
print(f'총점 = {total}') # 결과 처리 x => stream은 정적 구조로 보여주기만 함
message = '합결처리안내'
""")
st.title(':blue[test Streamlit]')
st.header('testsetse')
st.subheader('testsetst')
print('초간단 웹화면 test') # 콘솔에 출력 
실습3
- cvs파일을 이용하여 데이터프레임화 및 그래프 그리기
- iris 데이터 이용
# data/iris.csv파일 열기해서 웹화면에 출력
st.markdown('## iris.csv')
df = pd.read_csv('./data/iris.csv')
st.dataframe(df)

df = pd.DataFrame(np.random.randn(10,2), columns = ['x','y'])
st.bar_chart(df)
st.divider()
df = pd.DataFrame(np.random.randn(10,2), columns = ['x','y'])
st.line_chart(df)
st.divider()
df = pd.DataFrame(np.random.randn(500, 3), columns=['x', 'y', 'z'])
chart = alt.Chart(df).mark_circle().encode(
   x='x', y='y', size='z', color='z', tooltip=['x', 'y', 'z']
)
st.altair_chart(chart, use_container_width=True)

df = pd.DataFrame(
   np.random.randn(500, 2) / [50, 50] + [37.76, -122.4 ],  # 샌프란시스코 주변 랜덤 좌표 생성 126.54 36.91
   columns=['lat', 'lon']
)
st.map(df)
st.write(' ')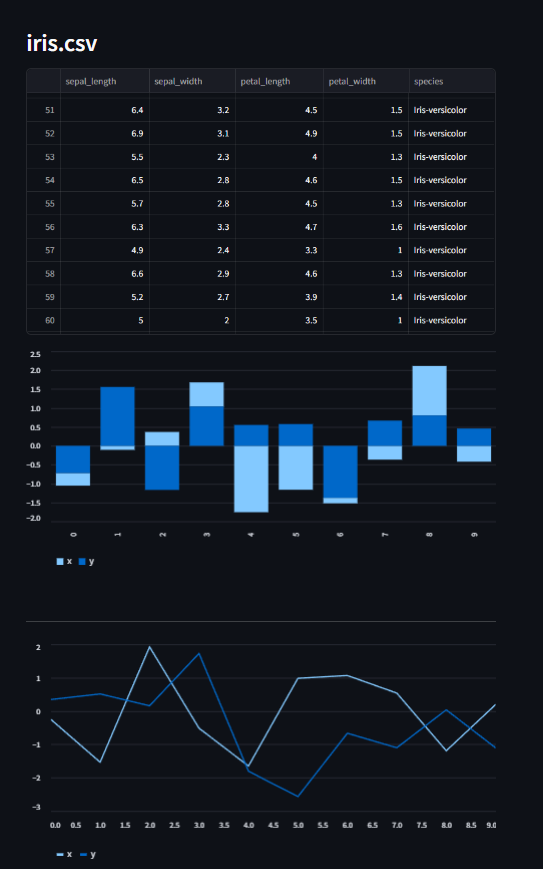

안녕하세요. 도야입니다