개발환경에 그라파나 프로메테우스를 적용해보겠습니다.
일단 도커 컴포즈로 팀원들이 편하게 환경을 구성할 수 있도록 세팅하였습니다.
docker-compose.yaml
services:
 prometheus:
    image: prom/prometheus:latest
    command:
      - '--config.file=/etc/prometheus/prometheus.yaml'
    ports:
      - "127.0.0.1:9090:9090"
    volumes:
      - ./monitoring/prometheus.yaml:/etc/prometheus/prometheus.yaml

  grafana:
    image: grafana/grafana:latest
    ports:
      - "127.0.0.1:3000:3000"
    environment:
      GF_SECURITY_ADMIN_USER: admin
      GF_SECURITY_ADMIN_PASSWORD: admin
monitoring/prometheus.yaml
global:
  scrape_interval: 15s

scrape_configs:
  - job_name: 'deokhugam'
    metrics_path: '/actuator/prometheus'
    static_configs:
      - targets: ['host.docker.internal:8080']
gradle
    implementation 'org.springframework.boot:spring-boot-starter-actuator'
    runtimeOnly 'io.micrometer:micrometer-registry-prometheus'
application.yaml
management:
  endpoints:
    web:
      exposure:
        include: health, info, metrics, prometheus
  metrics:
    distribution:
      percentiles-histogram:
        http.server.requests: true
        hikaricp: true
Grafana 설정
Grafana 데이터소스 설정:
1. http://localhost:3000 접속 → admin / admin 로그인
2. Configuration → Data Sources → Add data source
3. Prometheus 선택 → URL에 http://prometheus:9090 입력 → Save & Test
Spring Boot 메트릭 엔드포인트: http://localhost:8080/actuator/prometheus
id: admin, password: admin 으로 로그인
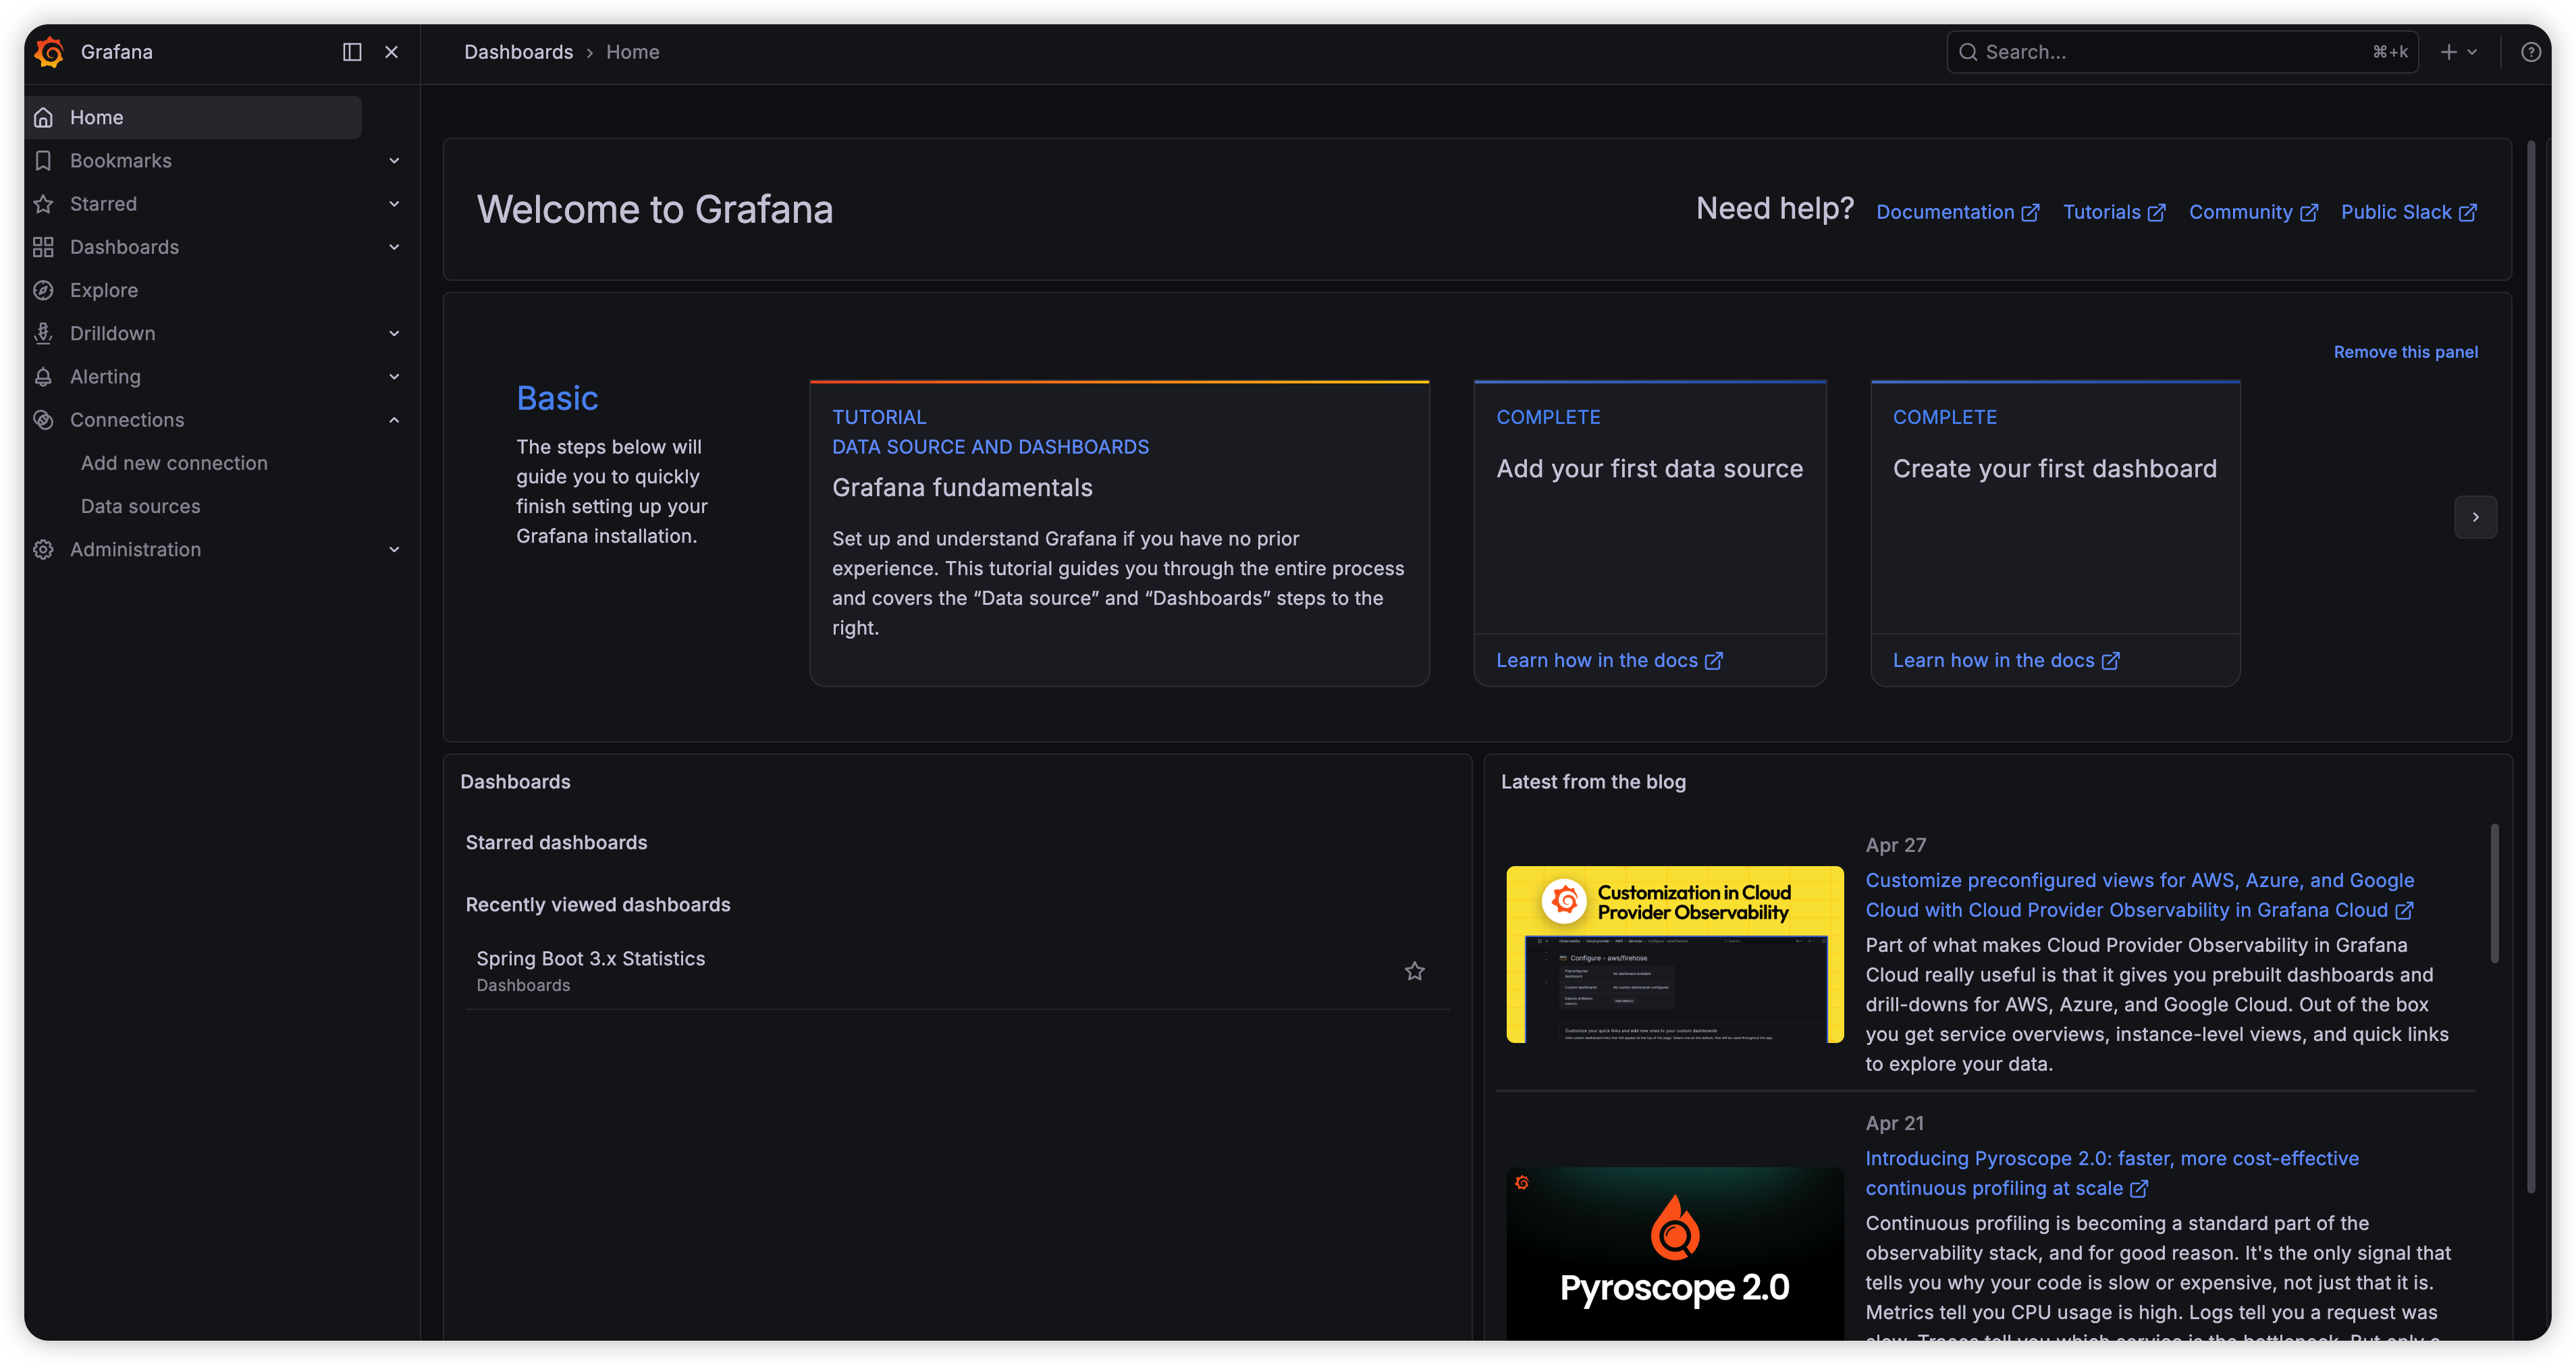
화면에서 왼쪽 메뉴 선택
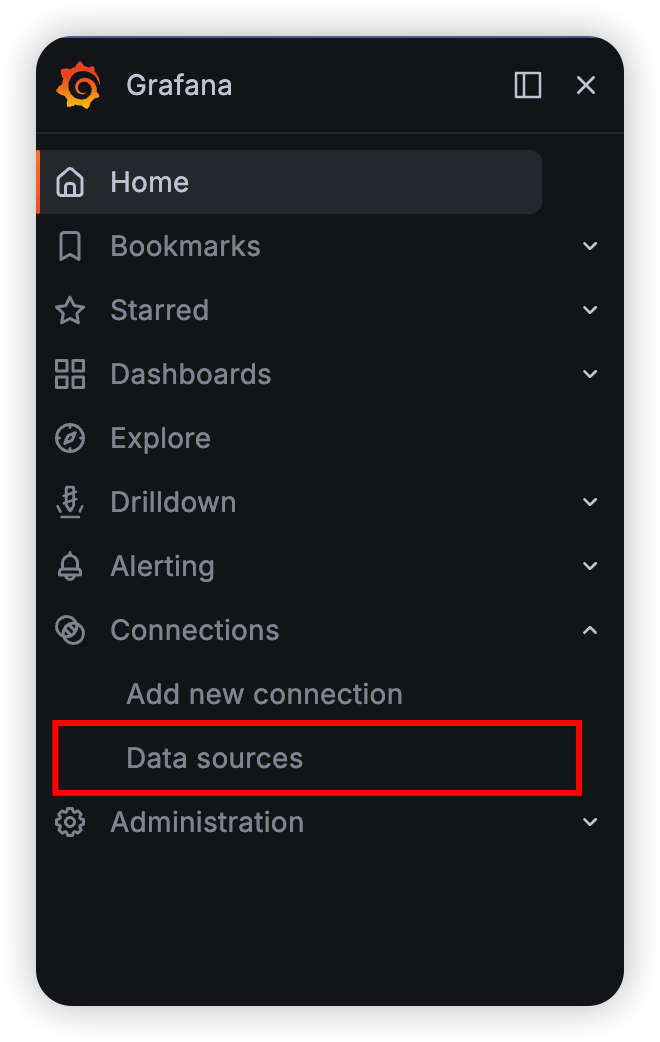
Data sources 여기서 프로메테우스를 연결할 수 있습니다
add new data source 를 누르면
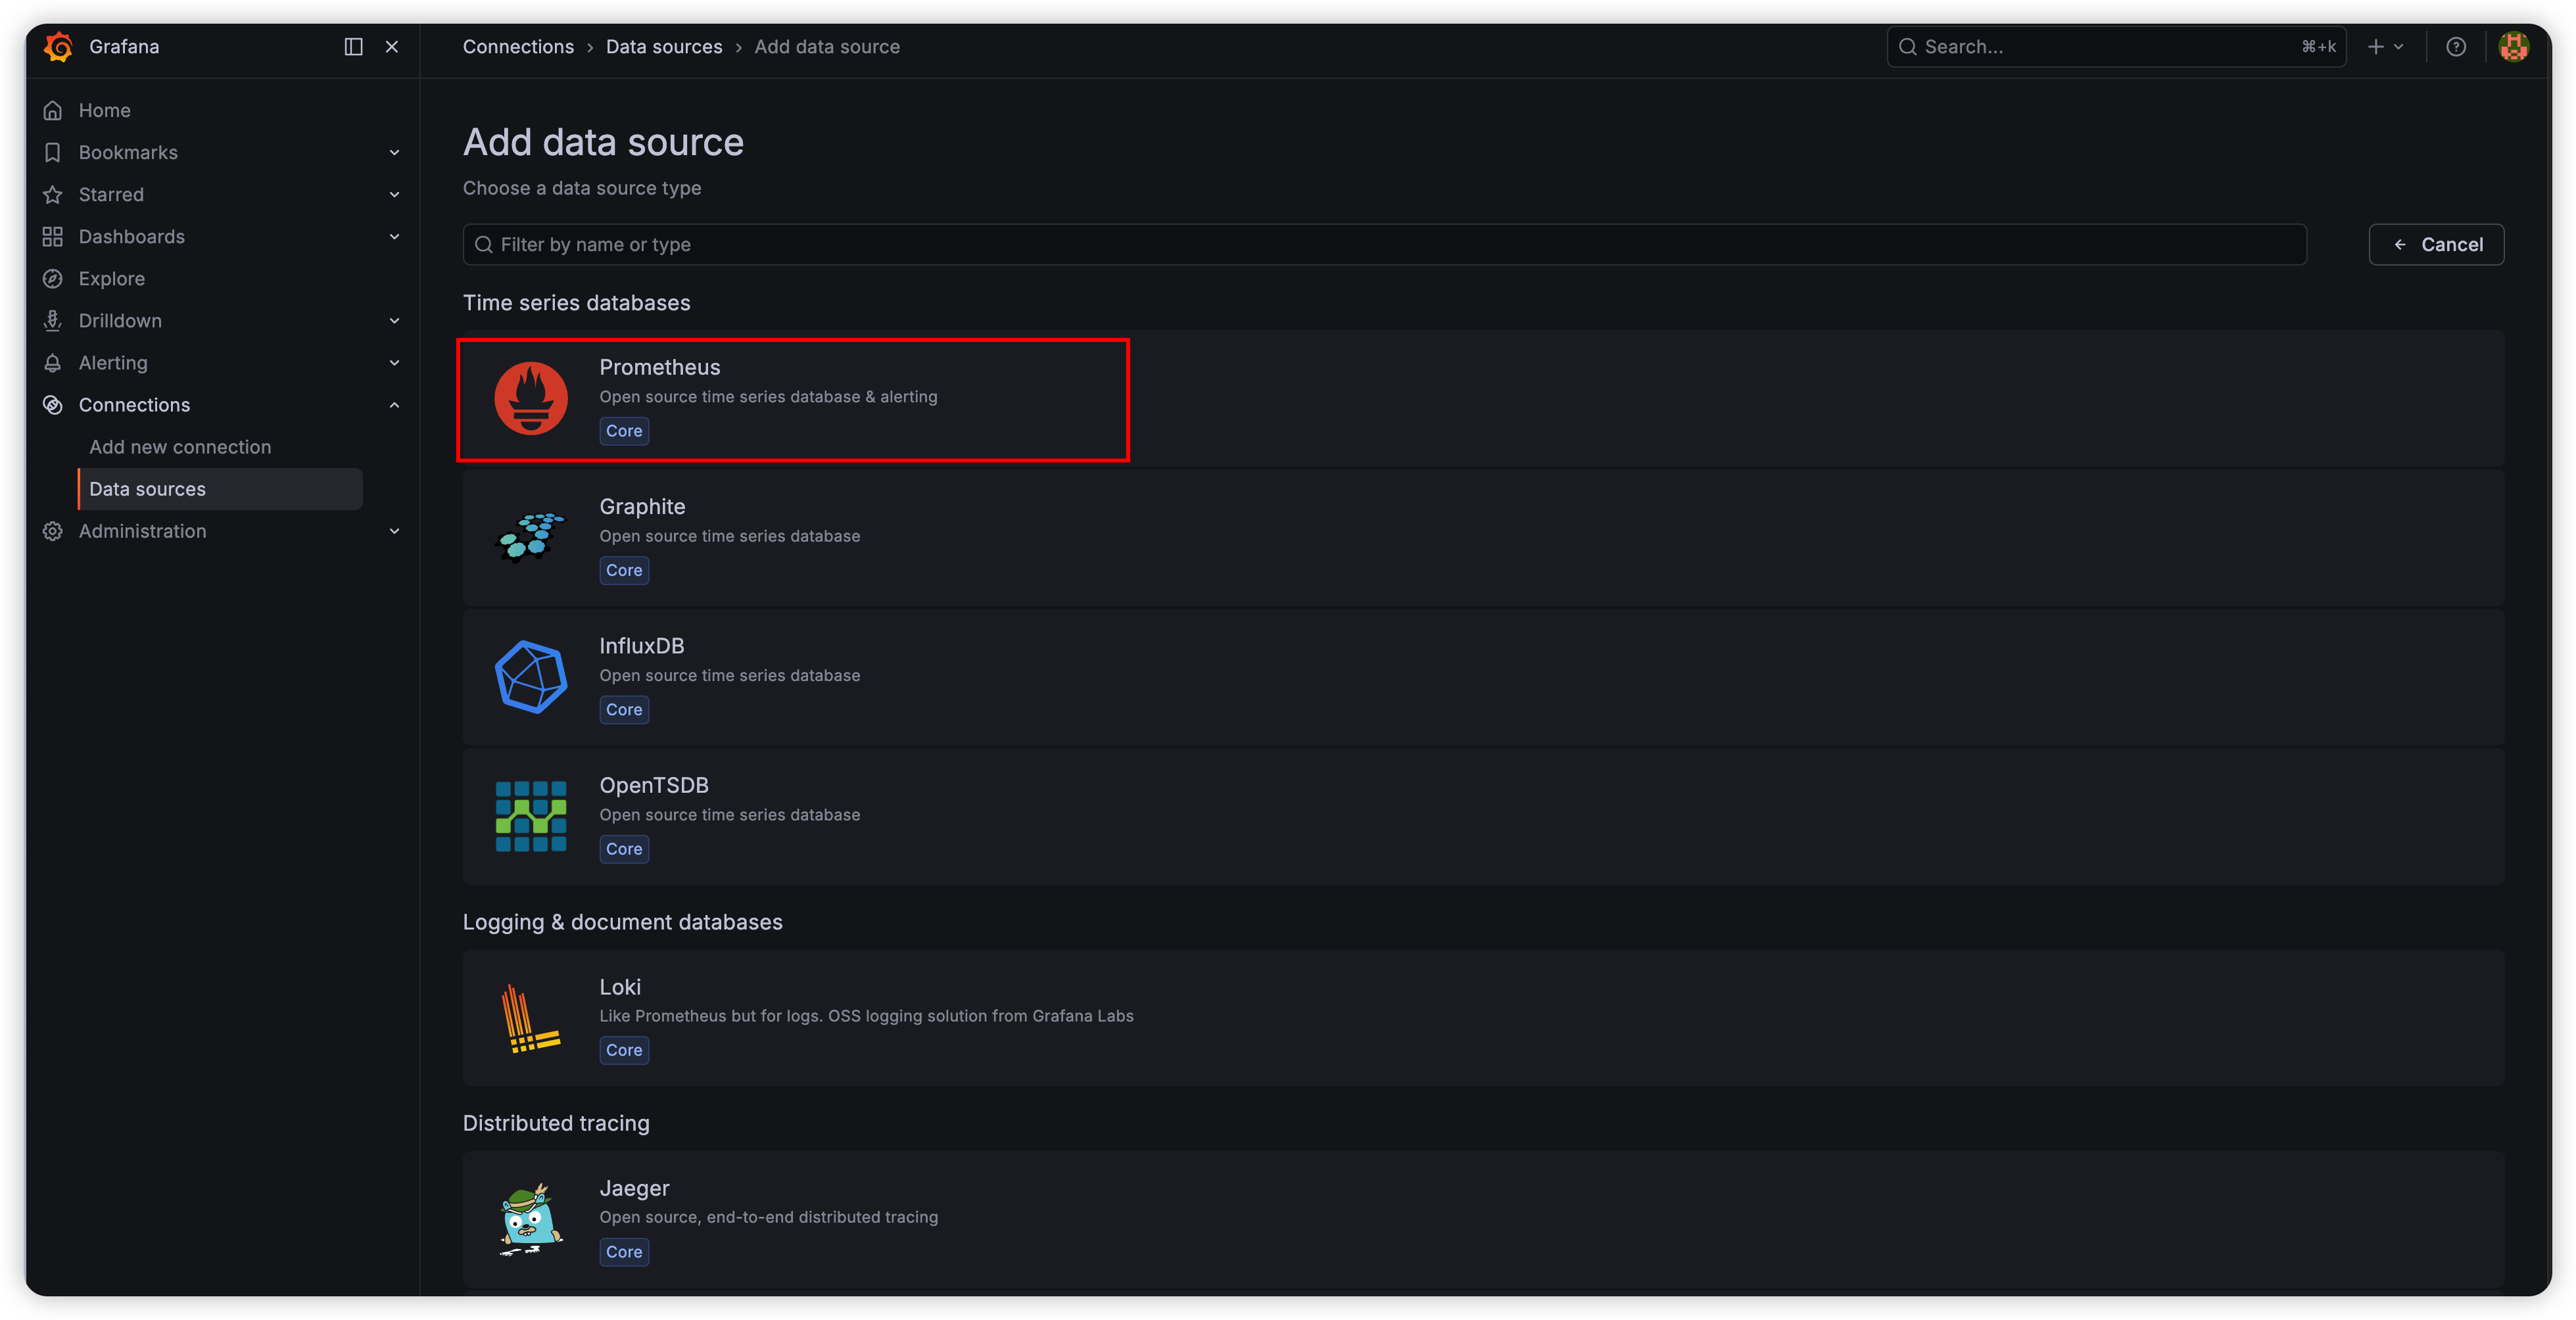
프로메테우스를 선택합니다.
그리고 도커 컴포즈로 환경을 설정해놓아서 도커 안에서 서로 통신을 시켜야하기때문에
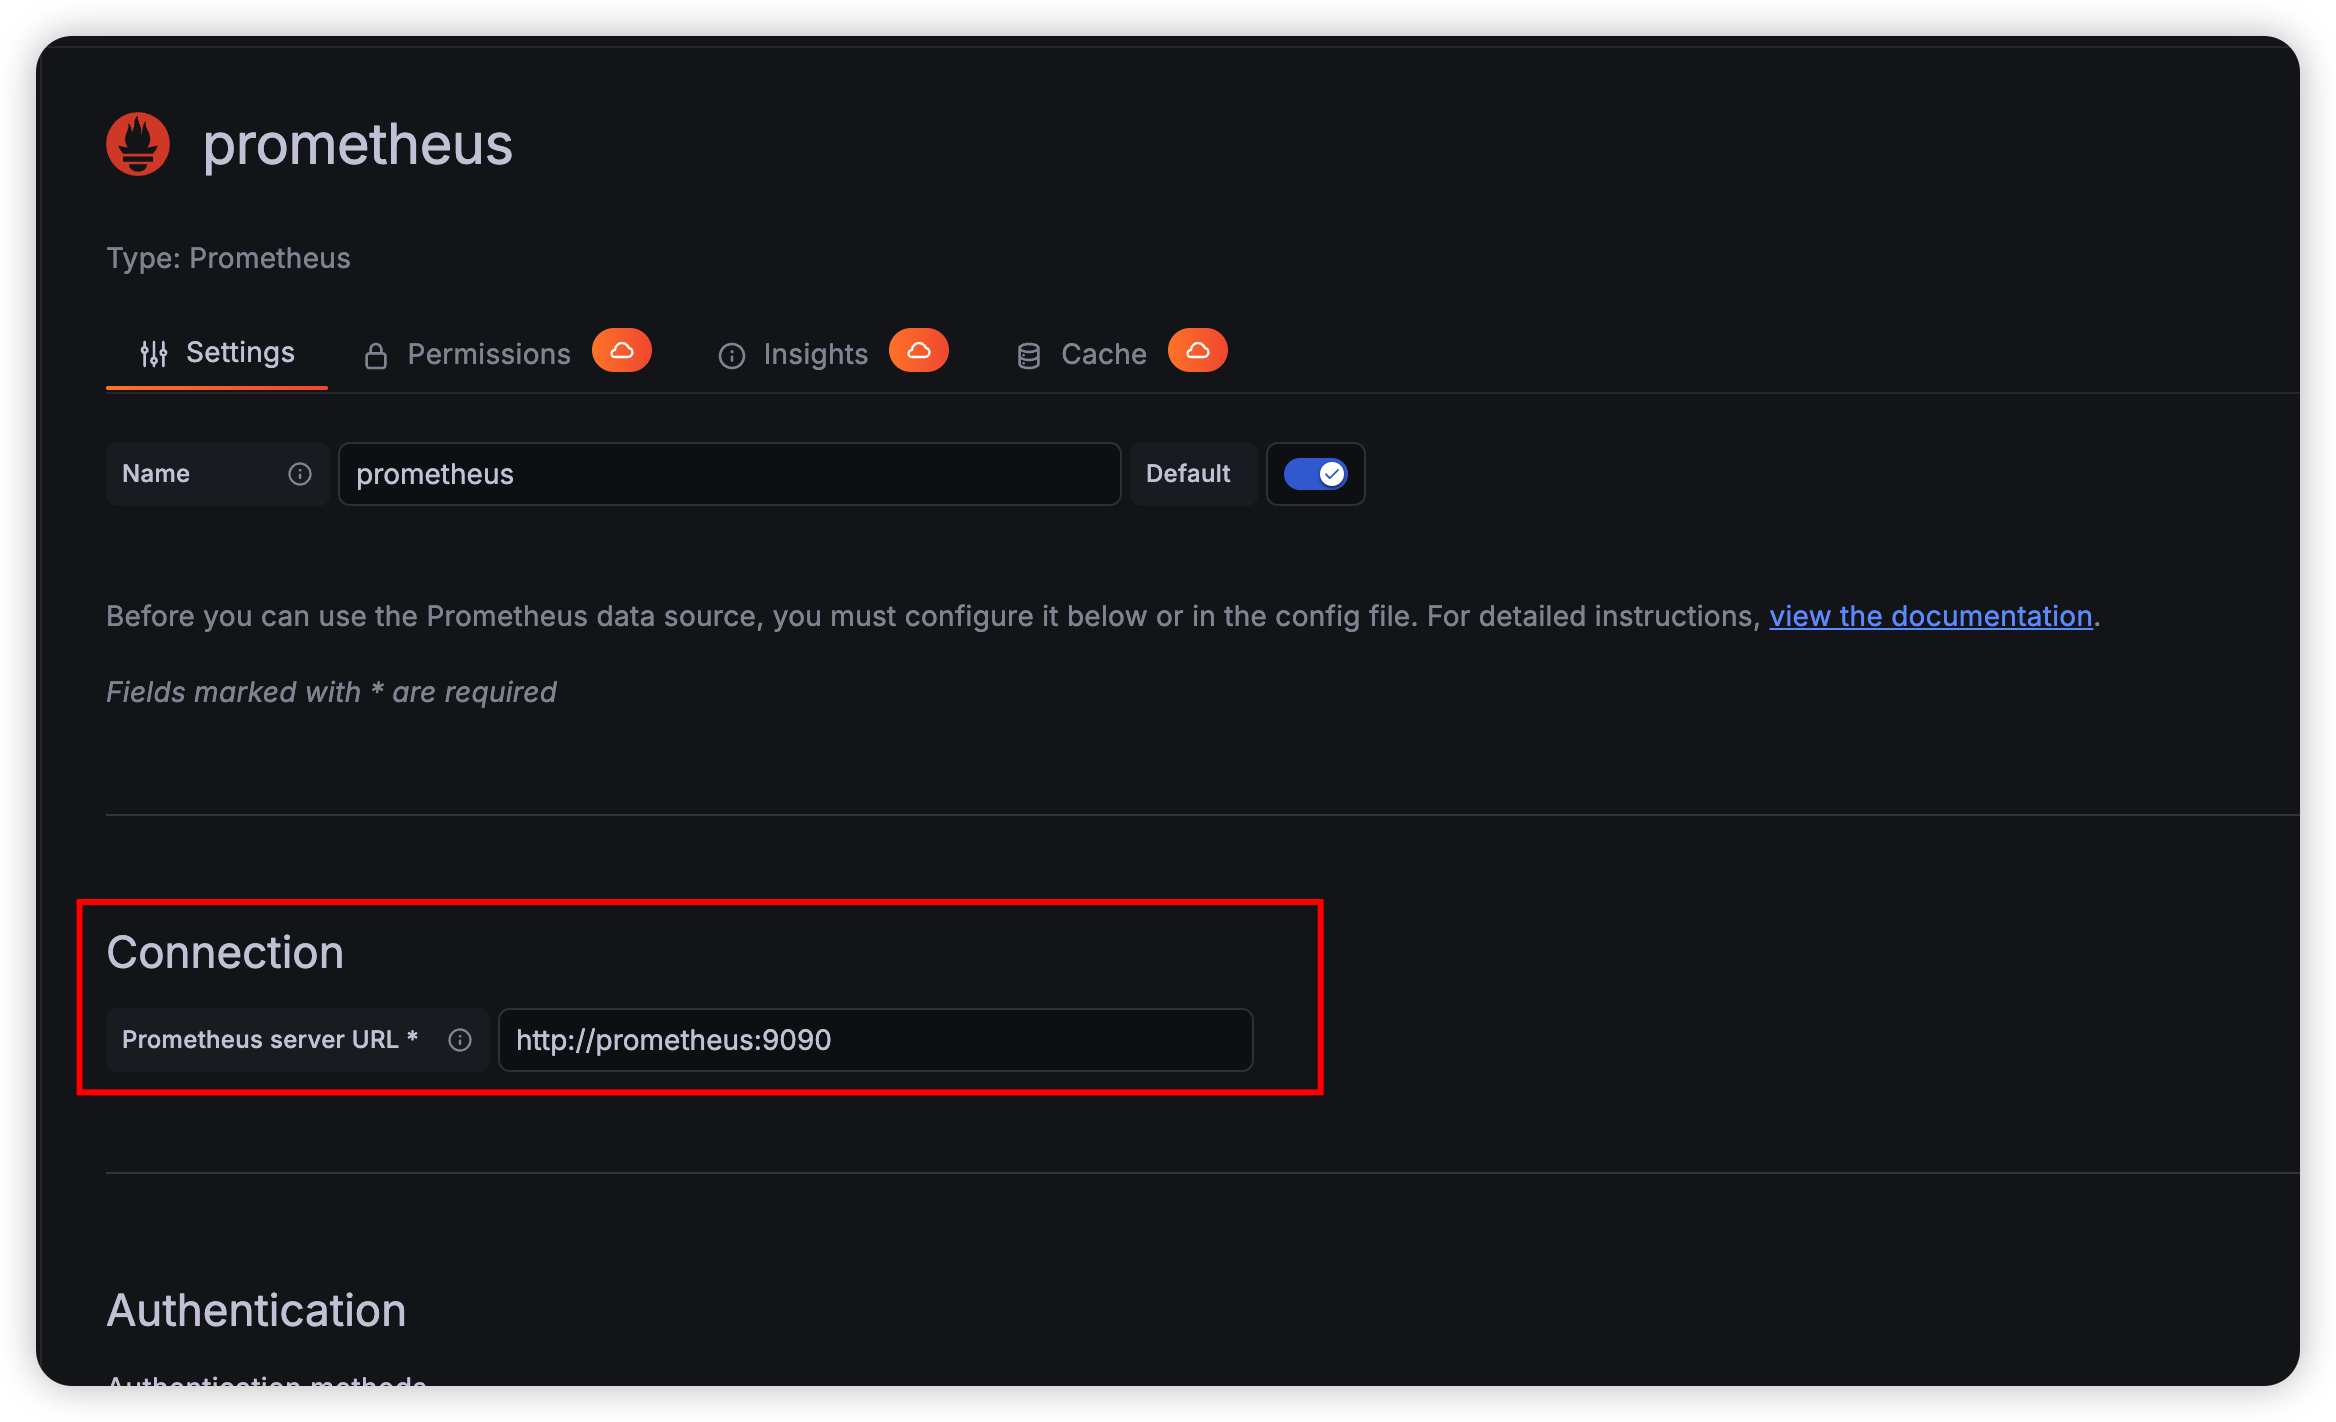
이름은 그냥 두고 위에 도커 컴포즈에서 설정한 프로메테우스 이름과 포트를 입력
이제 대시보드와 연결할 수 있습니다.
하지만 대시보드 매트릭은 너무 어렵고 다양하기 옵션이 다양하기 때문에
사람들이 만들어놓은 대시보드 템플릿을 import 하여 사용할 수 있습니다.
https://grafana.com/grafana/dashboards/?search=spring
spring을 검색하여 보면 빨간 박스 두 개가 많이 사용되는 대시보드 형식이라고 합니다.
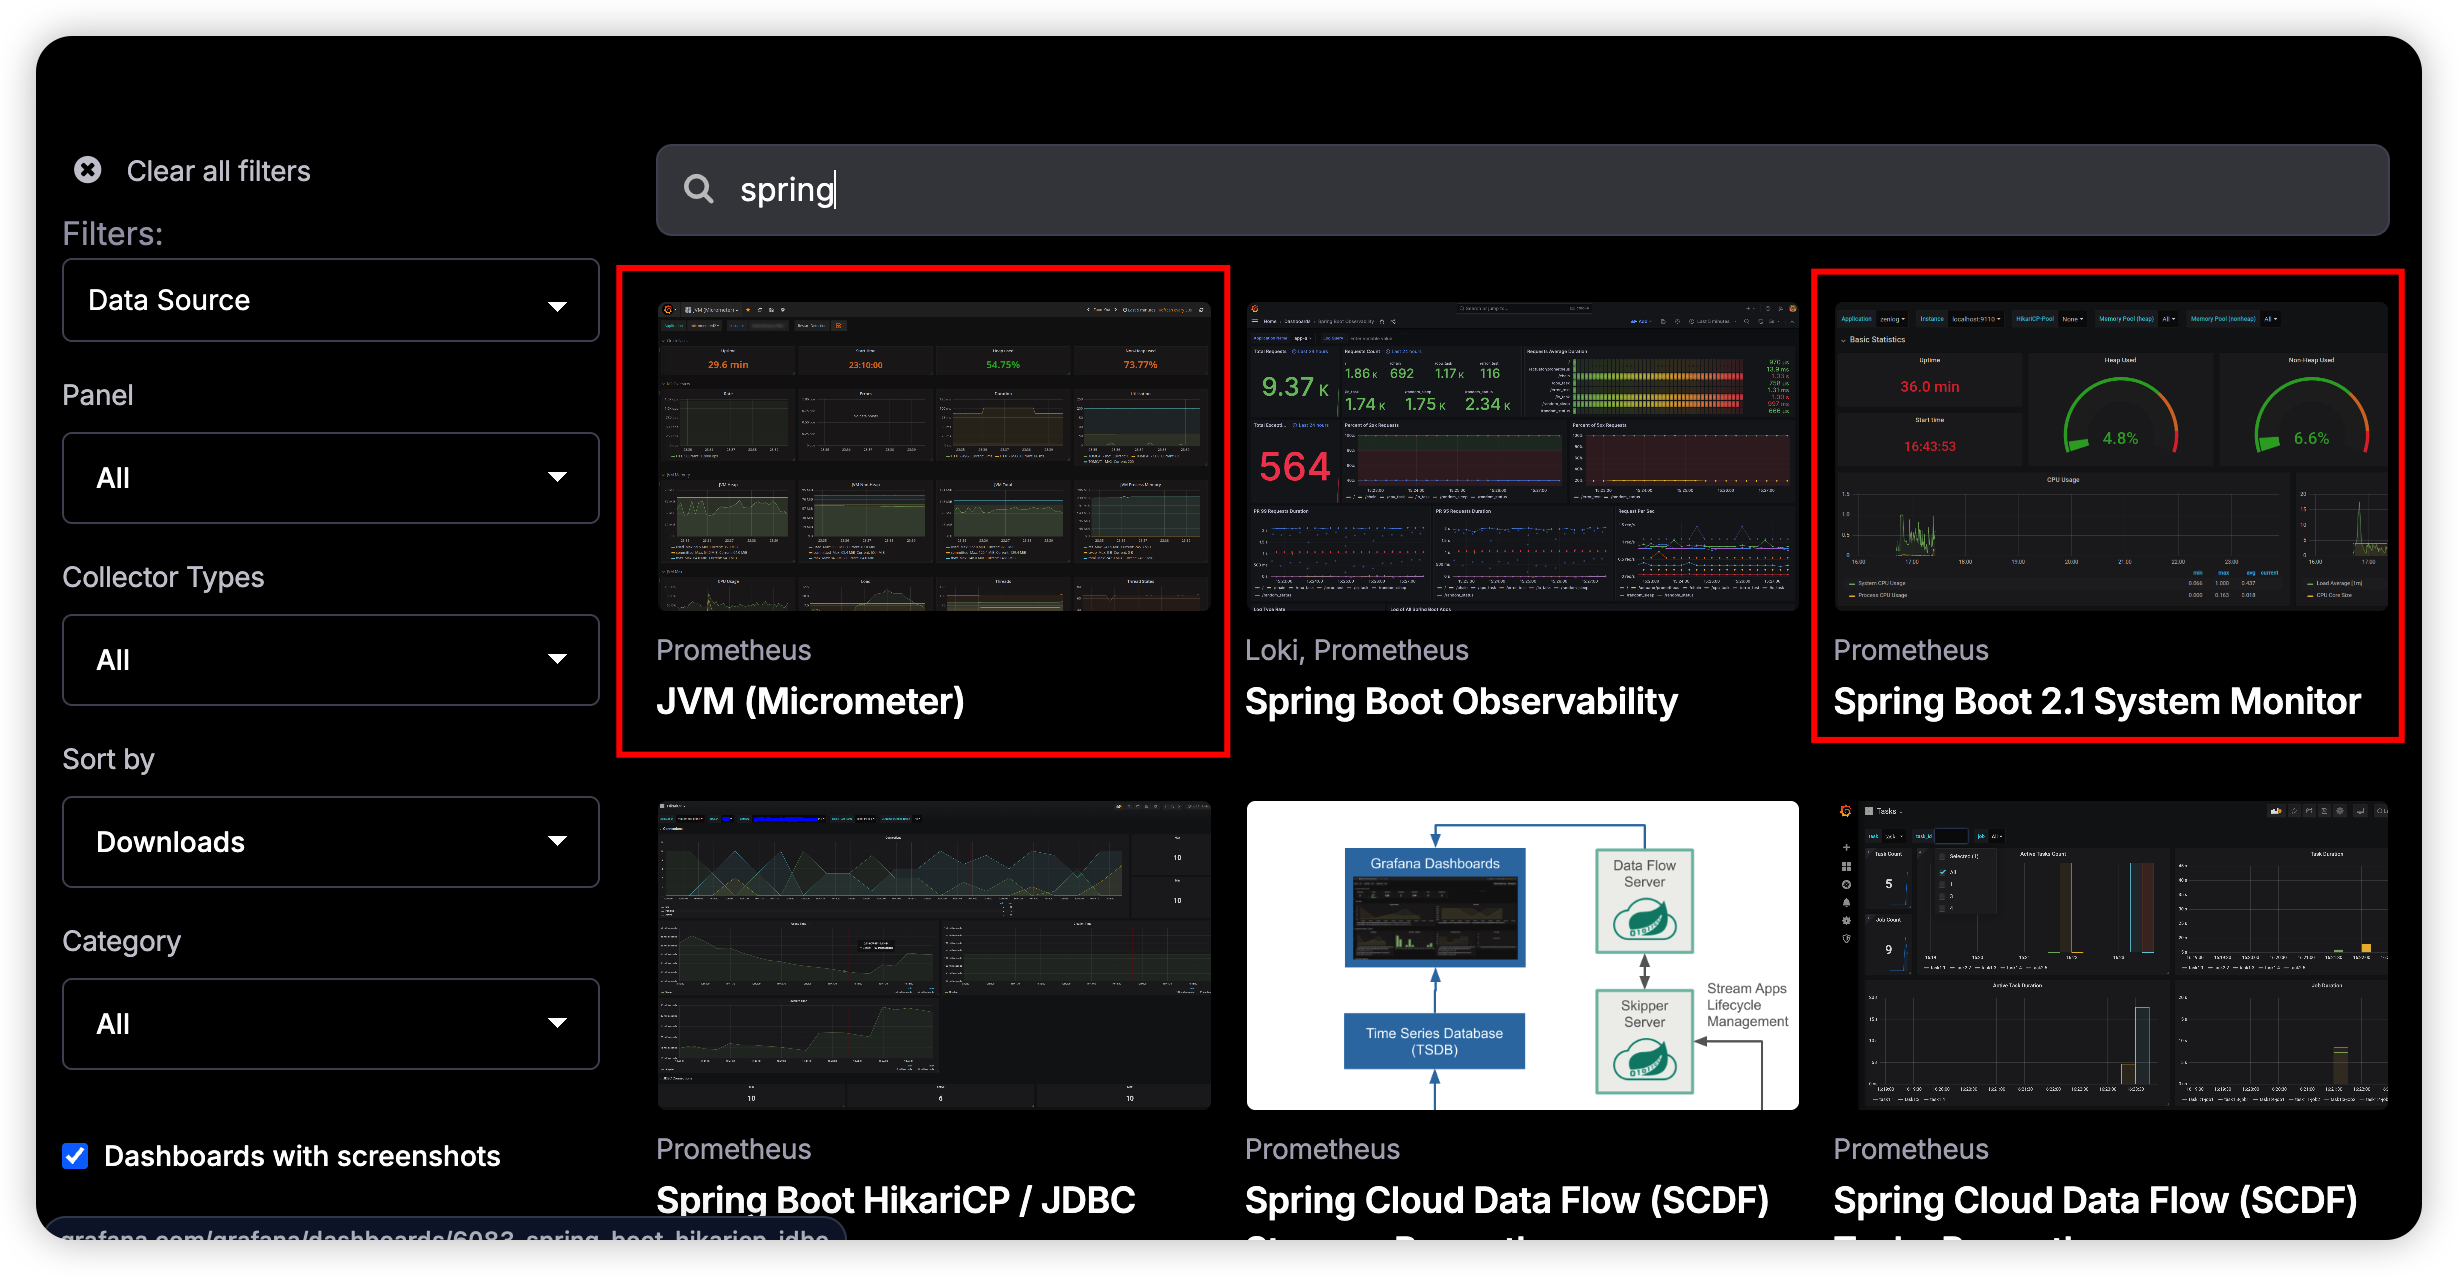
여러 대시보드가 나오는데 저는 19004 을 사용해보았습니다.
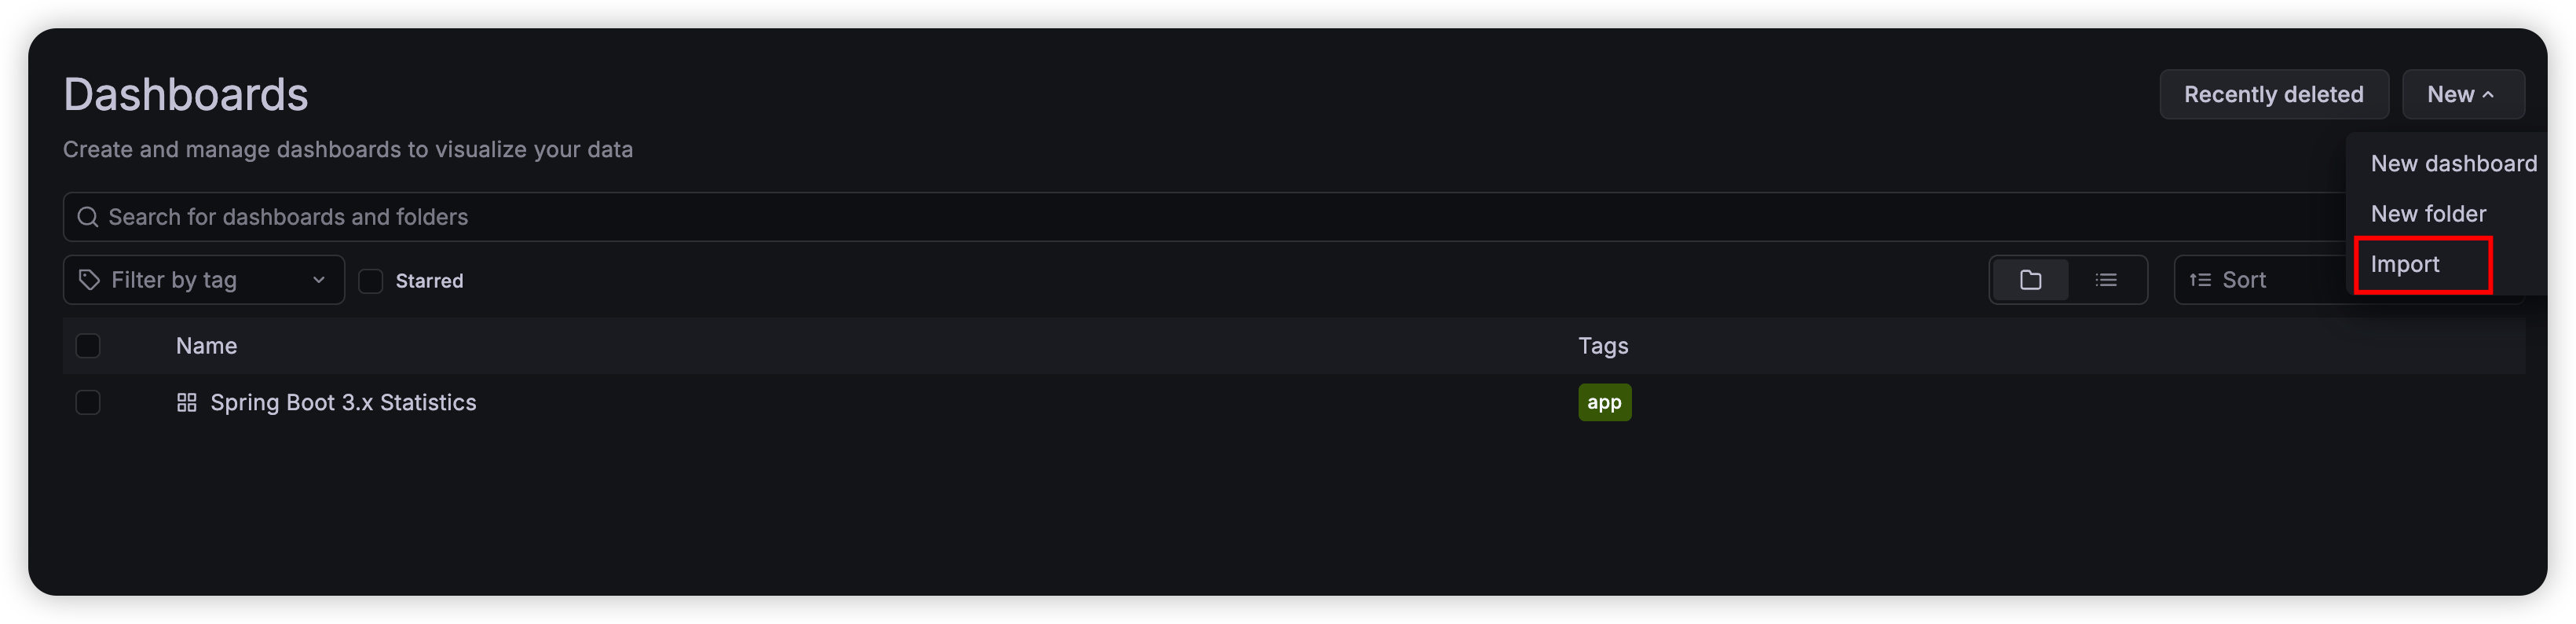
그라파나로 돌아와서 저 왼쪽에 new 버튼을 누르면 토글들이 나오는데
저기서 import를 누르면
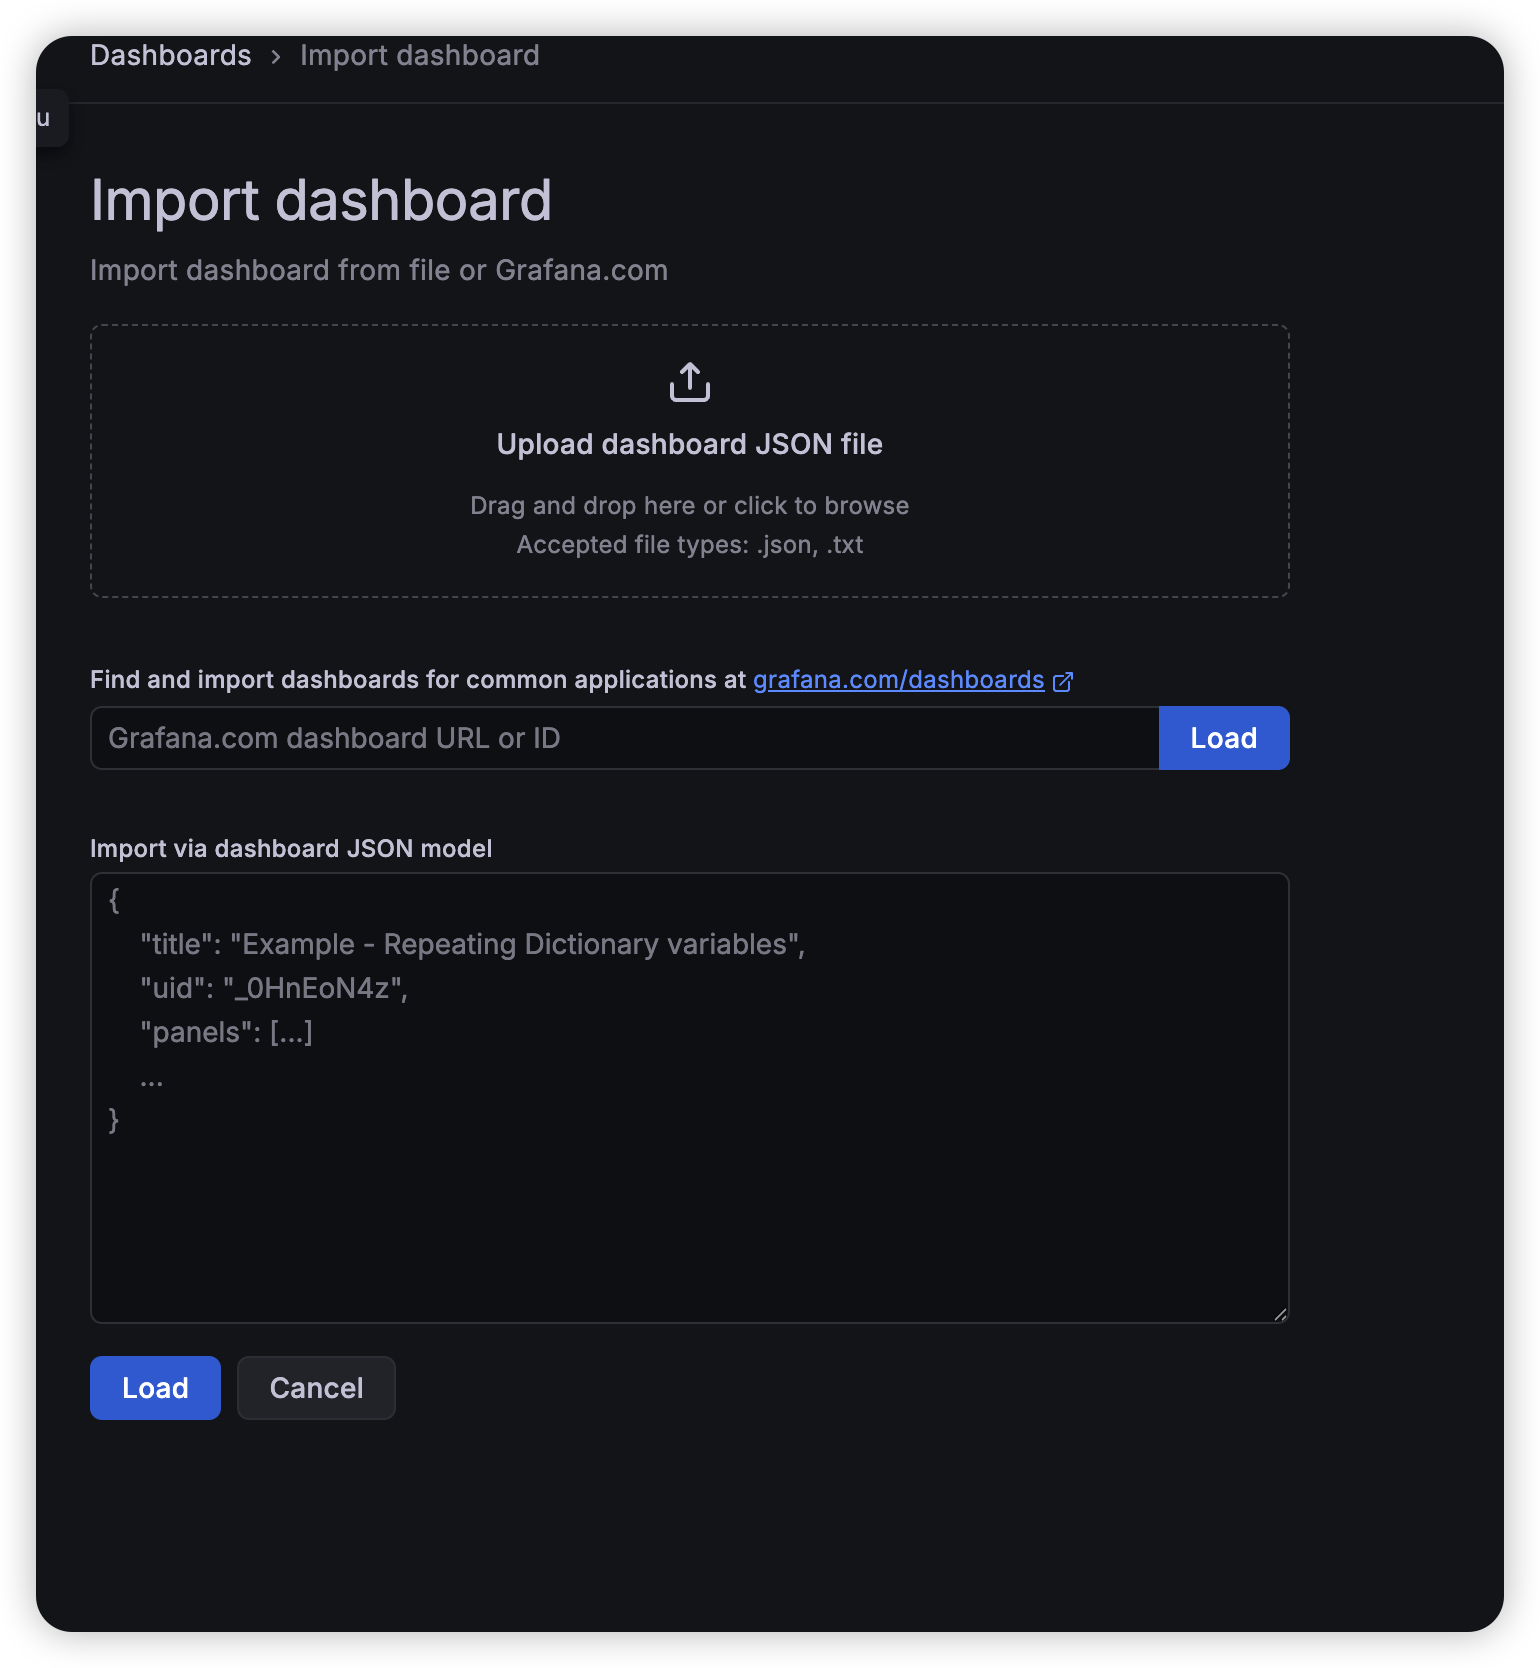
이렇게 import 할 수 있는 칸이 나오고
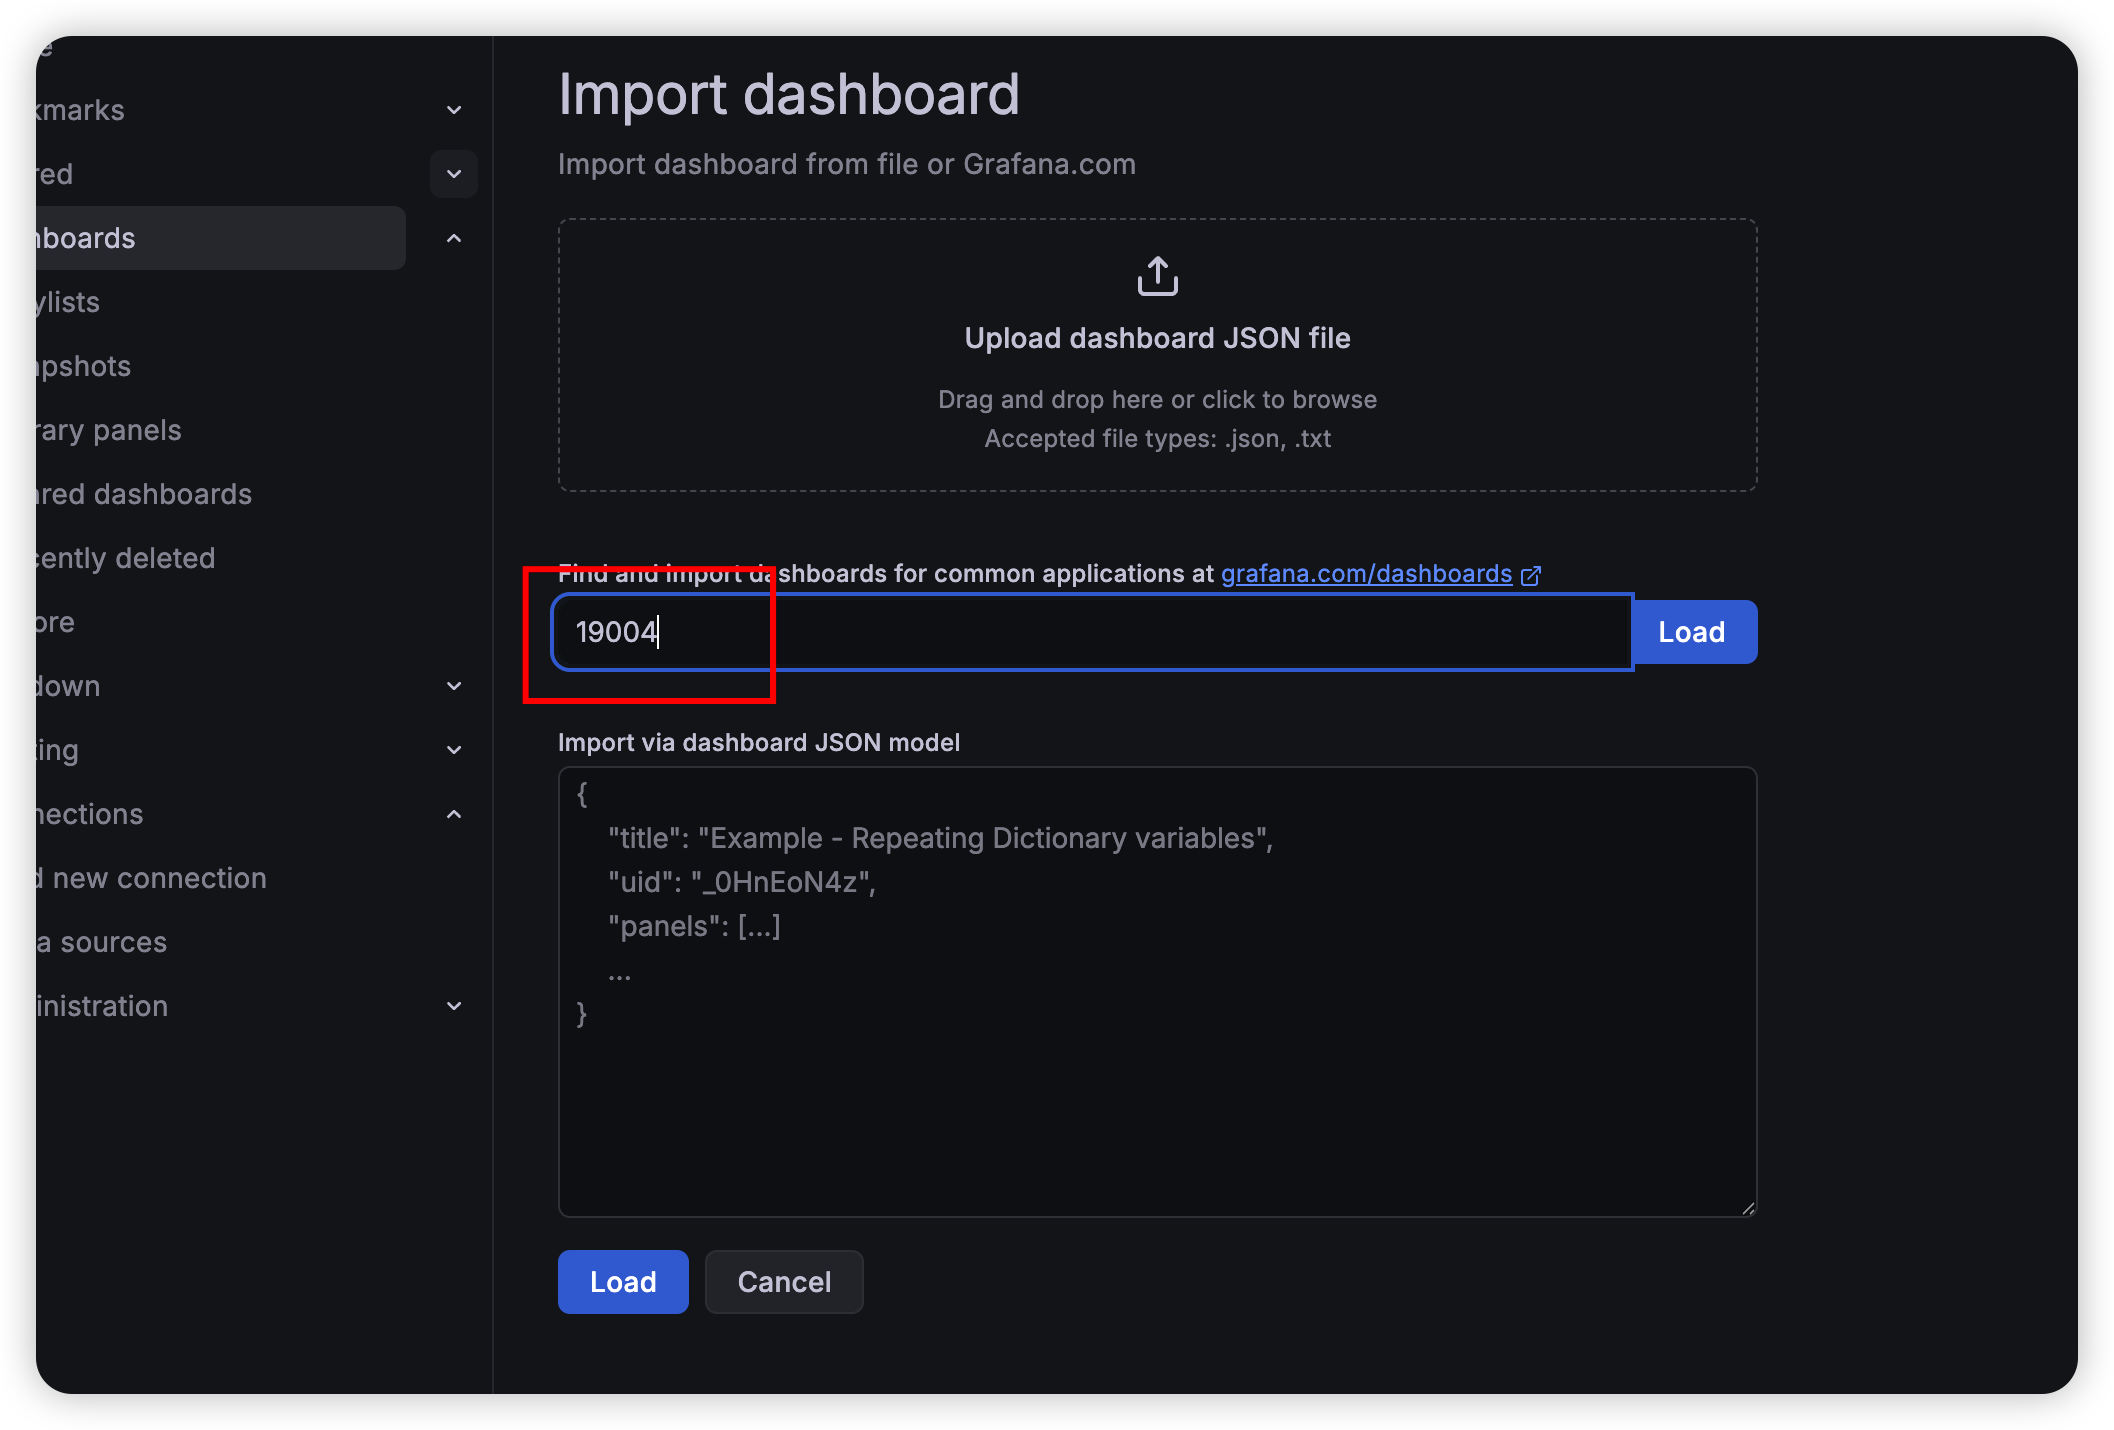
아까 복사한 ID 를 누르고 Load 한 후 import 를 완료합니다.
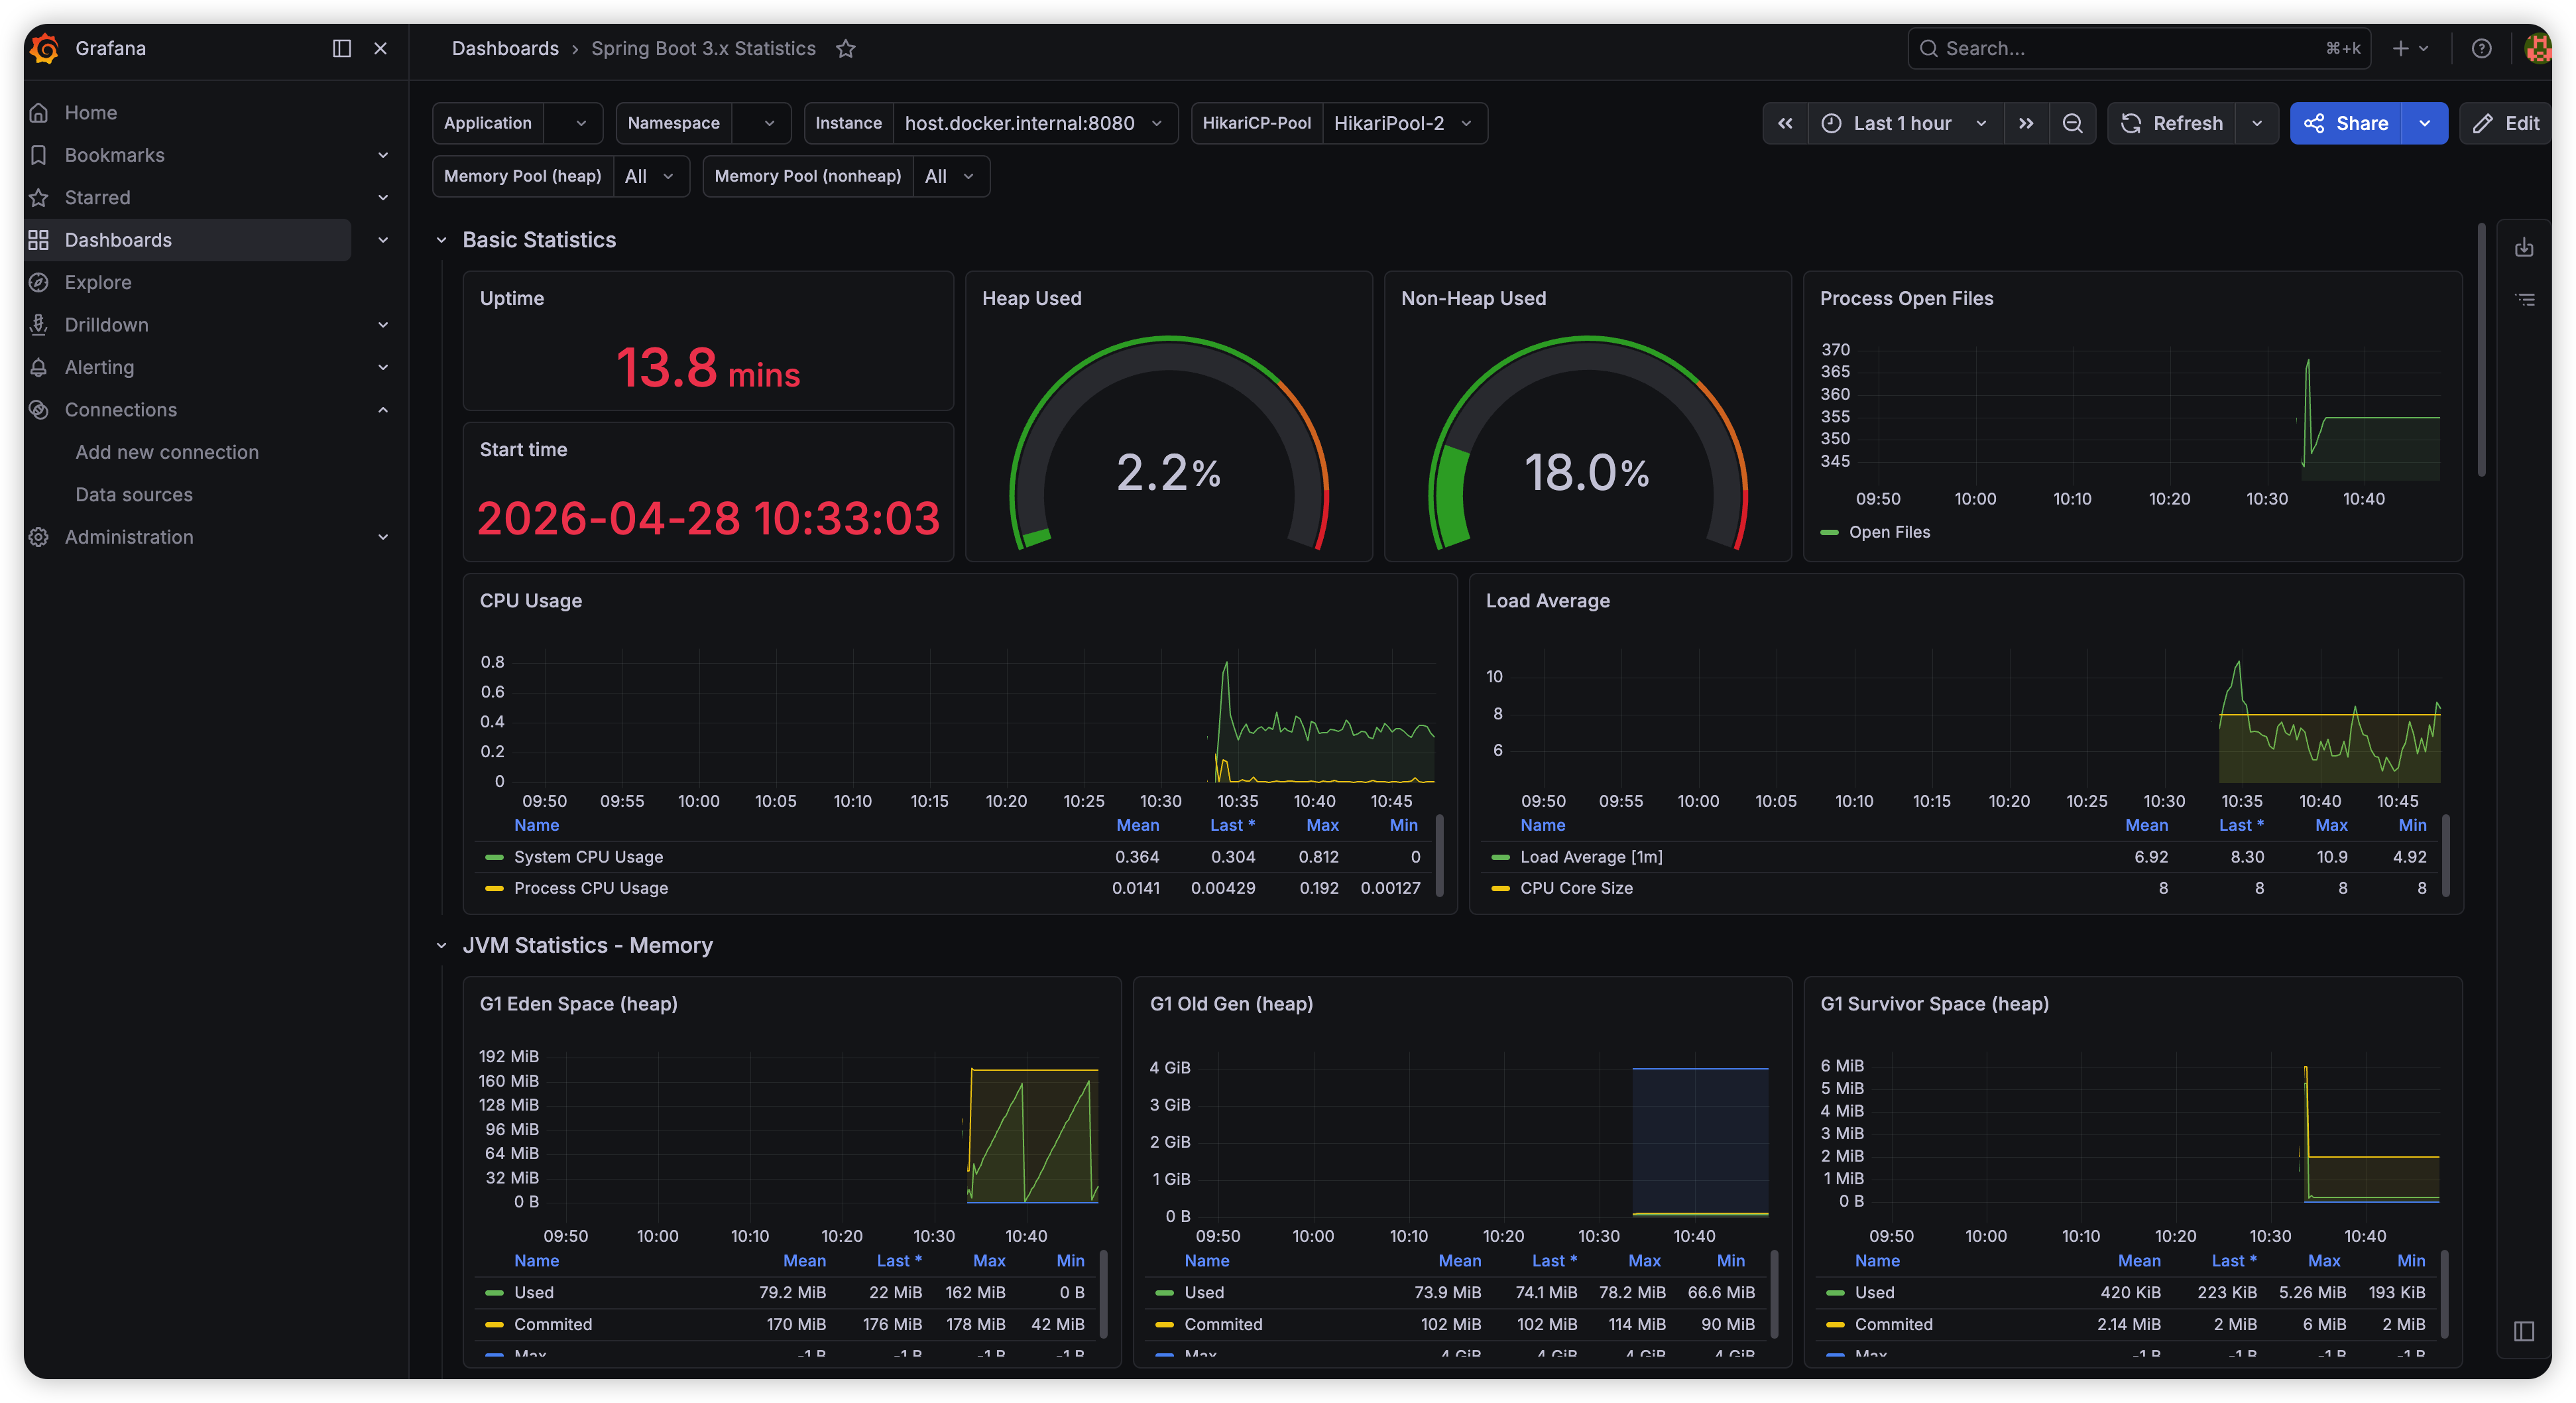
<완료된 대시보드>
유의할 점
그라파나와 프로메테우스가 기본적으로 yml 이 디폴트라 yaml 연결이 안되던 문제가 있었습니다.
yml으로 컨벤션이 맞춰진 프로젝트는 yaml 관련 설정들을 빼면 될 것 같습니다