24.01.28 최초 작성
1. Prometheus
- 모니터링 솔루션을 제공하는 오픈소스
- 다차원 데이터 모델 지원
- 강력한 쿼리 언어
- 여러 언어에 대한 라이브러리 및 수집 방법 지원
- 고가용성 및 연합기능 제공
2. Grafana
- 오픈소스의 시각화 및 분석 서비스 제공
- 데이터 소스 지원
- 대시보드를 통한 시각화 지원
- 데이터 변화에 따른 이메일 등으로 경고와 알림 지원
- 사용자 정의 가능
- 보안 관련 기능 지원
3. Node exporter
Prometheus가system metric을 수집하는걸 도와주는 도구
4. 실습
4.1 가상머신 생성 및 docker-compose.yml 파일 준비
Vagrantfile생성,vagrant up & vagrant ssh prometheus로 가상머신 접속
VAGRANTFILE_API_VERSION = "2"

Vagrant.configure(VAGRANTFILE_API_VERSION) do |config|
    config.vm.box = "ubuntu/focal64"
    config.vm.provider "virtualbox" do |vb|
      vb.memory = 1024
    end

    if Vagrant.has_plugin?("vagrant-vbguest")
      config.vbguest.auto_update = false
    end

    config.vm.synced_folder ".", "/vagrant", type: "rsync", rsync__exclude: [".git/"]

    config.vm.provision "shell", inline: <<-SHELL
      export DEBIAN_FRONTEND=noninteractive
      sudo apt -y update
      sudo apt install -y ca-certificates curl gnupg libnss-mdns
      sudo install -m 0755 -d /etc/apt/keyrings
      curl -fsSL https://download.docker.com/linux/ubuntu/gpg | \
      sudo gpg --dearmor -o /etc/apt/keyrings/docker.gpg
      sudo chmod a+r /etc/apt/keyrings/docker.gpg
      echo "deb [arch="$(dpkg --print-architecture)" signed-by=/etc/apt/keyrings/docker.gpg] \
      https://download.docker.com/linux/ubuntu \
      $(. /etc/os-release && echo "$VERSION_CODENAME") stable" | \
      sudo tee /etc/apt/sources.list.d/docker.list > /dev/null
      sudo apt -y update
      sudo apt install -y docker-ce docker-ce-cli containerd.io docker-compose-plugin
      sudo usermod -aG docker vagrant
    SHELL

    config.vm.define "prometheus", primary: true do |prometheus|
        prometheus.vm.hostname = "prometheus.local"
        prometheus.vm.network "private_network", ip: "192.168.56.200"
    end
endPrometheus,Node exporter,Grafana서비스를 실행하는docker-compose.yml파일 생성
(prometheus: 9090번 포트,Grafana: 3000번 포트 사용, 포트포워딩 필요)
version: '3.2'
services:
  prometheus:
    image: prom/prometheus:latest
    volumes:
      - ./prometheus.yml:/etc/prometheus/prometheus.yml
    command:
      - '--config.file=/etc/prometheus/prometheus.yml'
    ports:
      - 9090:9090
  nodeexporter:
    image: prom/node-exporter:latest
    										#해당 컨테이너에 해당 파일의 내용 읽을 권한 부여
    volumes:
      - /proc:/host/proc:ro
      - /sys:/host/sys:ro
      - /:/rootfs:ro
      - ./textfile_collector:/etc/node_exporter/textfile_collector
    command:
      - '--path.procfs=/host/proc'
      - '--path.sysfs=/host/sys'
      - '--collector.filesystem.ignored-mount-points="^/(sys|proc|dev|host|etc)($$|/)"'
      - '--collector.textfile.directory=/etc/node_exporter/textfile_collector'
  grafana:
    image: grafana/grafana:latest
    ports:
- 3000:3000- 같은 경로에
prometheus.yml파일 생성,docker compose up을 통해 실행
global:
  scrape_interval: 15s

scrape_configs:
  - job_name: 'prometheus'
    scrape_interval: 5s
    static_configs:
      - targets: ['localhost:9090']

  - job_name: 'nodeexporter'
    scrape_interval: 5s
    static_configs:
      - targets: ['nodeexporter:9100']
4.1.1 동작 확인
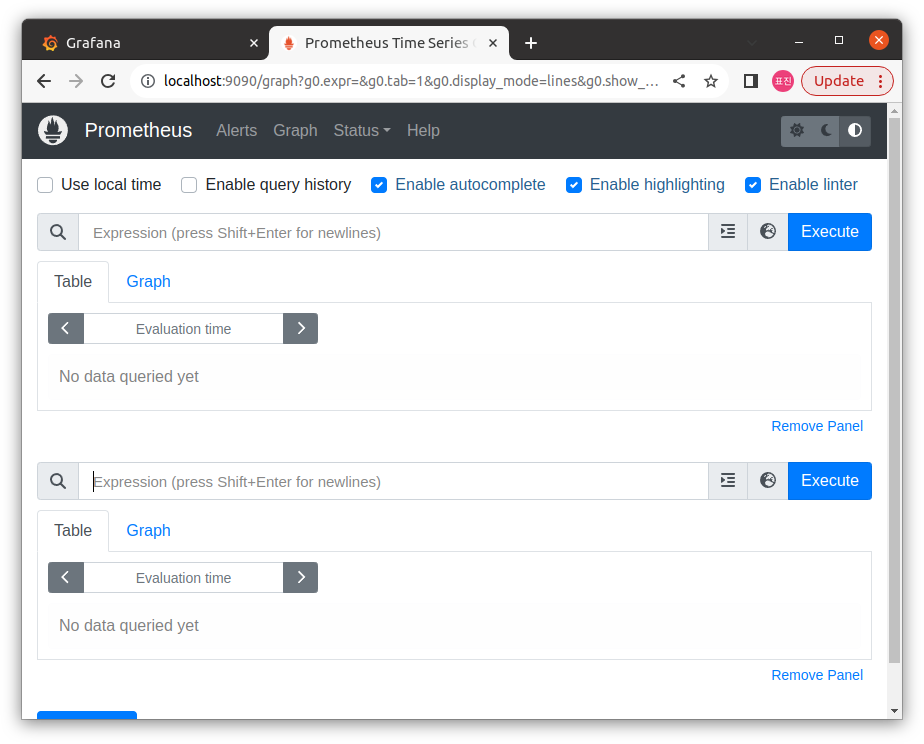
Prometheus접속 및 확인
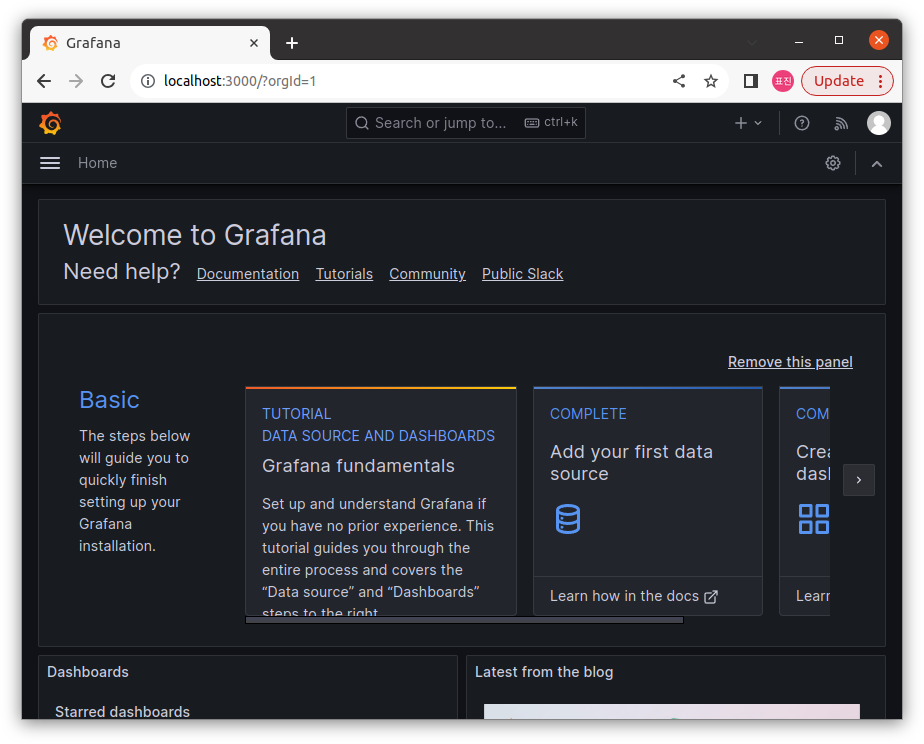
(Expression에100 * (1 - ((node_memory_MemFree_bytes + node_memory_Cached_bytes + node_memory_Buffers_bytes) / node_memory_MemTotal_bytes))입력해 동작 확인)Grafana접속 및 확인
(초기 ID/passwd :admin/admin)
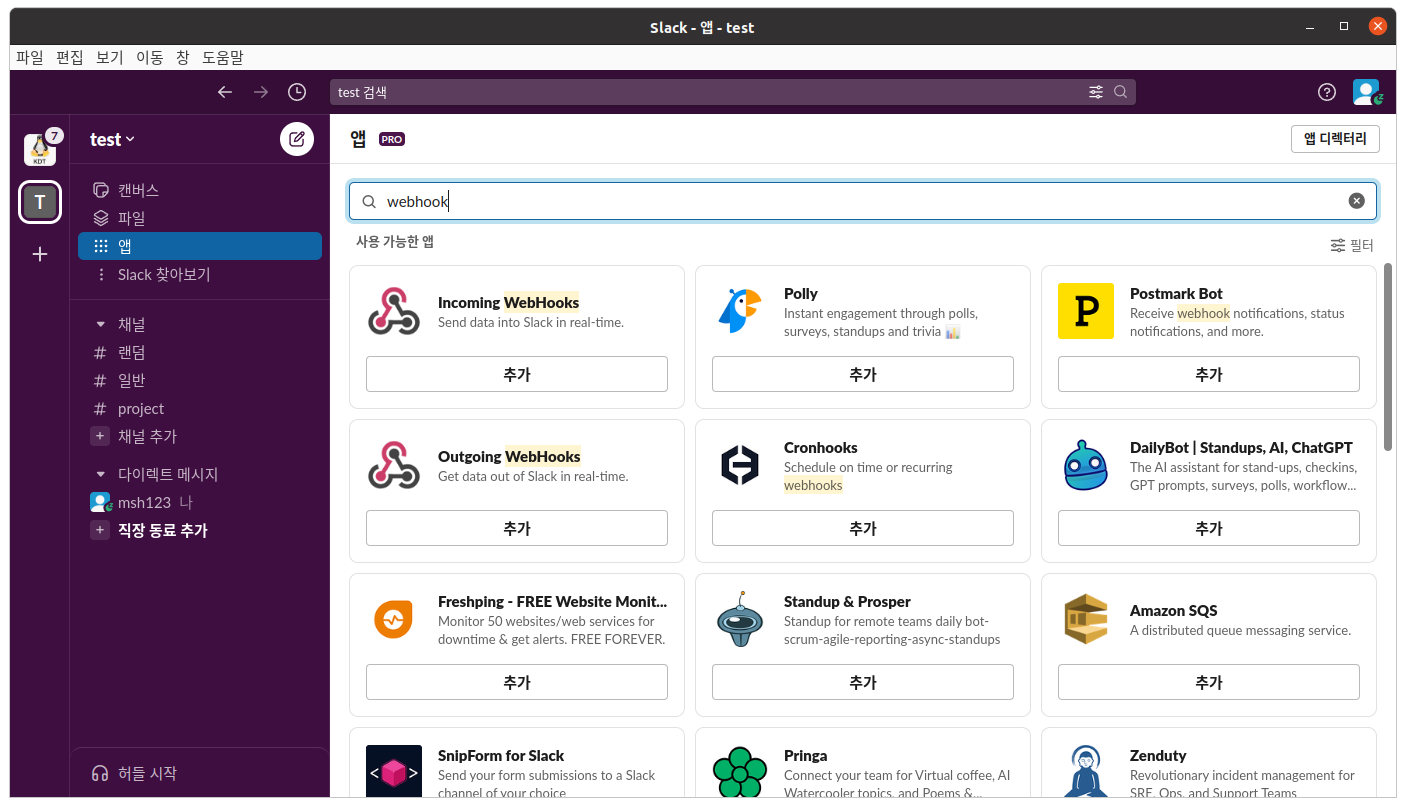
4.2 Slack과 연결
- 새 워크스페이스 생성 및 채널 생성
앱메뉴에webhook검색,Incomming Webhooks채널에 설치
prometheus.yml위치에alertmanager.yml,alert.rules.yml생성
route:
  receiver: 'slack-notifications'
  group_wait: 30s
  group_interval: 5m
  repeat_interval: 4h

receivers:
  - name: 'slack-notifications'
    slack_configs:
      - send_resolved: true
        username: 'msh123'					#표시될 사용자 이름
        channel: '#project'					#표시될 채널 지정
        									#Incomming hook의 url
        api_url: 'https://hooks.slack.com/services/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'
text: "{{ range .Alerts }}{{ .Annotations.summary }}\n{{end}}"groups:
- name: example
rules:
- alert: HighCPUUsage #경고 유형 이름
#cpu 상한선
expr: 100 - (avg by (instance) (irate(node_cpu_seconds_total{mode="idle"}[1m])) * 100) > 80
for: 1m
annotations:
summary: "High CPU usage" #메시지prometheus.yml수정
global:
  scrape_interval: 15s

scrape_configs:
  - job_name: 'prometheus'
    scrape_interval: 5s
    static_configs:
      - targets: ['localhost:9090']

  - job_name: 'nodeexporter'
    scrape_interval: 5s
    static_configs:
      - targets: ['nodeexporter:9100']

alerting:
  alertmanagers:
  - static_configs:
    - targets: ['alertmanager:9093']

rule_files:
- "alert.rules.yml"docker-compose.yml에 다음 내용 추가
...

	alertmanager:
    image: prom/alertmanager:latest
    ports:
      - "9093:9093"
    volumes:
      - ./alertmanager:/etc/alertmanager/alertmanager.yml
    command:
      --config.file=/etc/alertmanager/alertmanager.yml

...

volumes:
  alertmanager-data: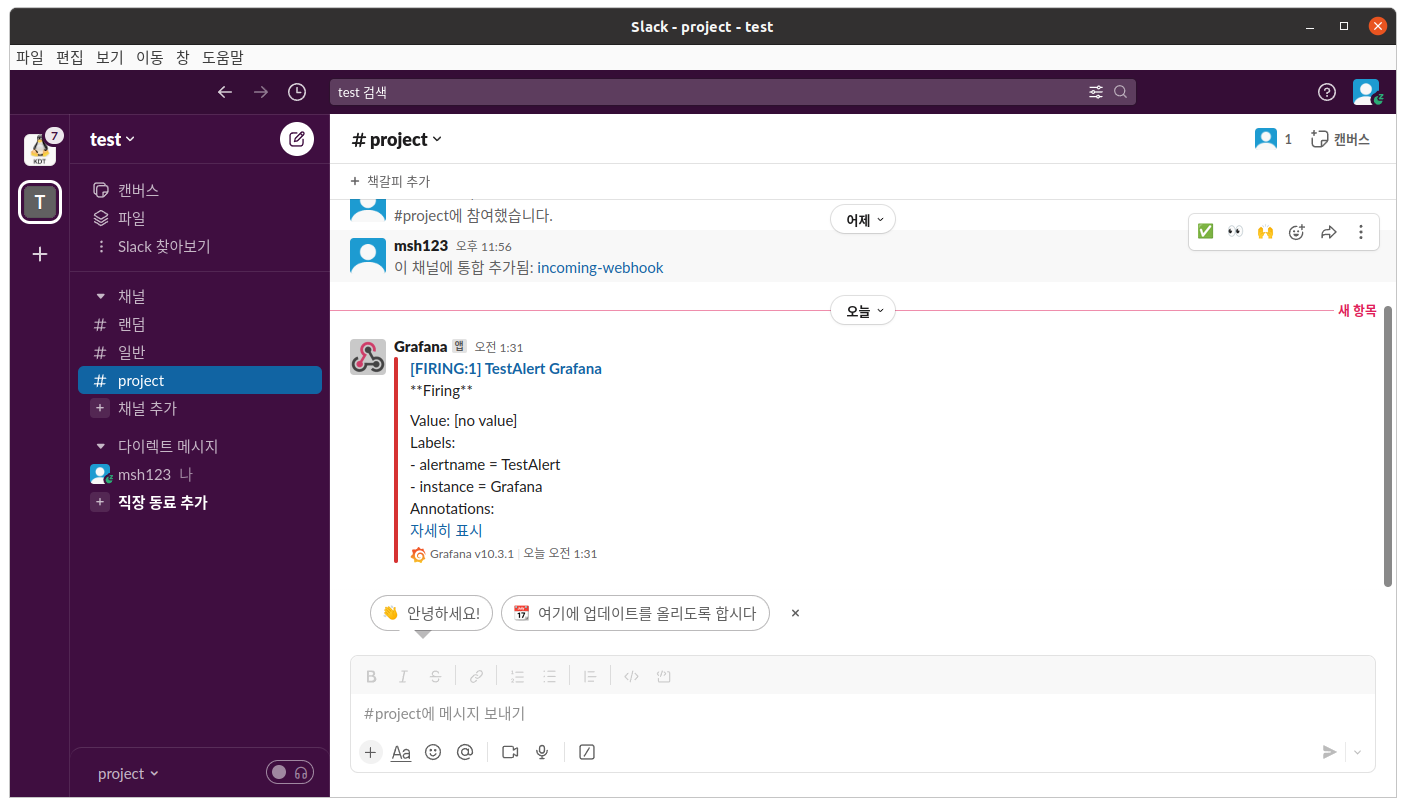
5. Grafana 대시보드 생성
5.1 Prometheus와 연결
-
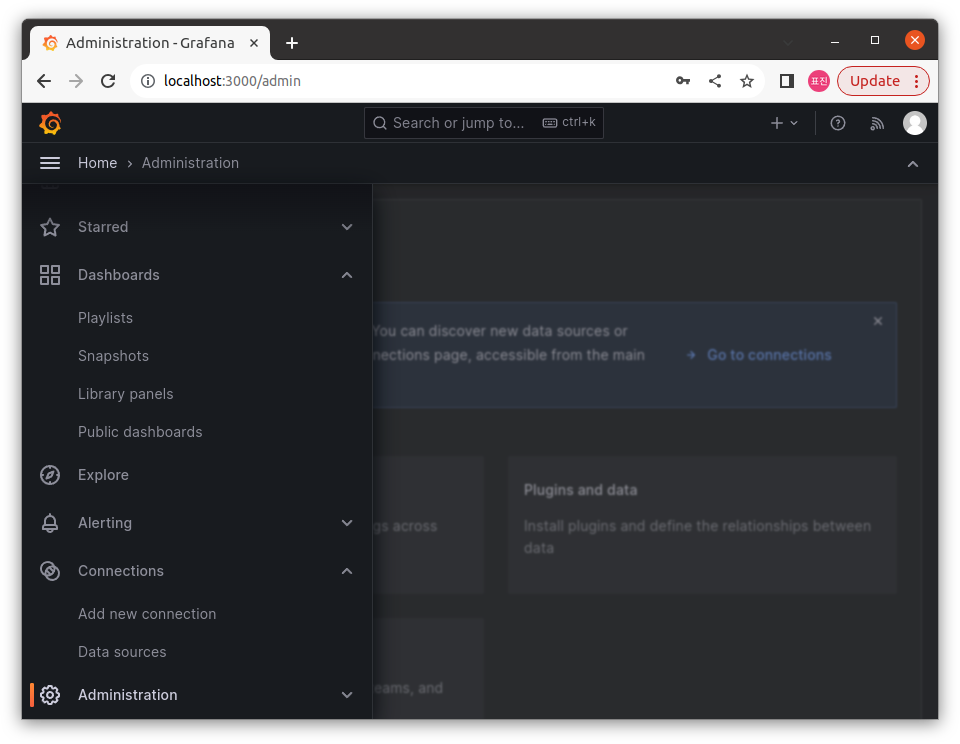
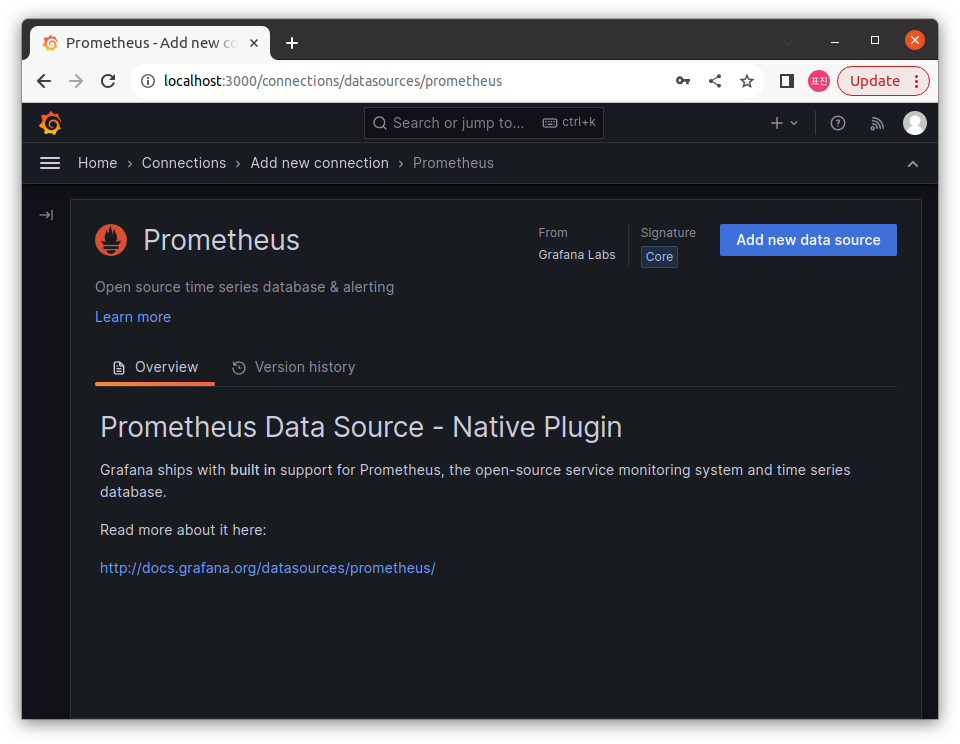
목록의
Connections>Add new connection선택,Prometheus검색 -
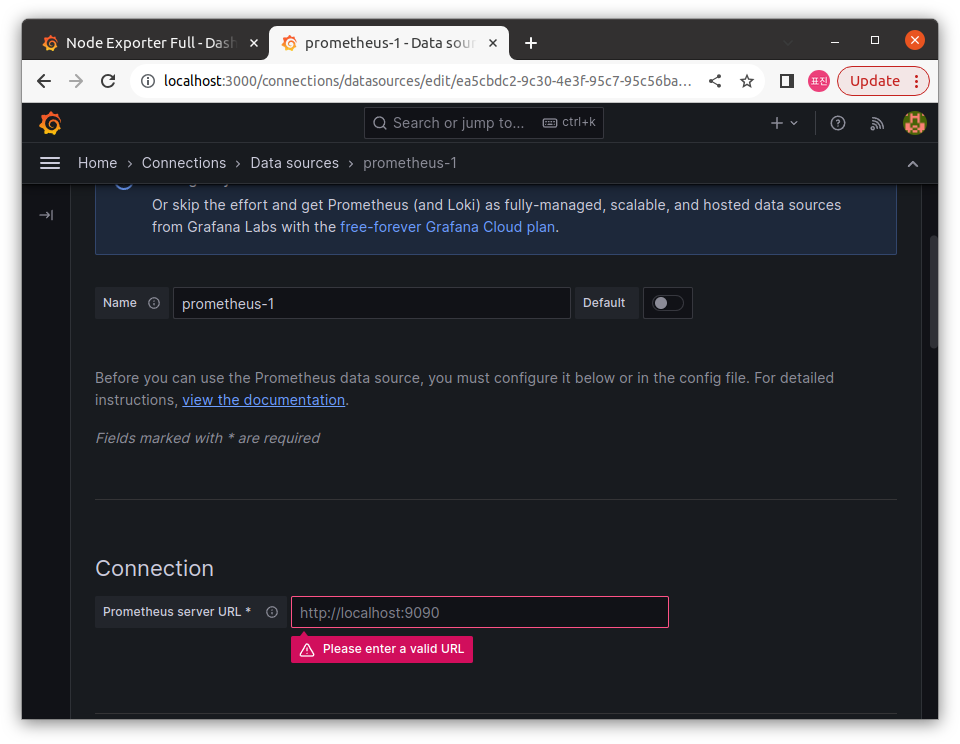
Add new data source에서Connection항목에Prometheus가 동작하고 있는 서버의 url 입력
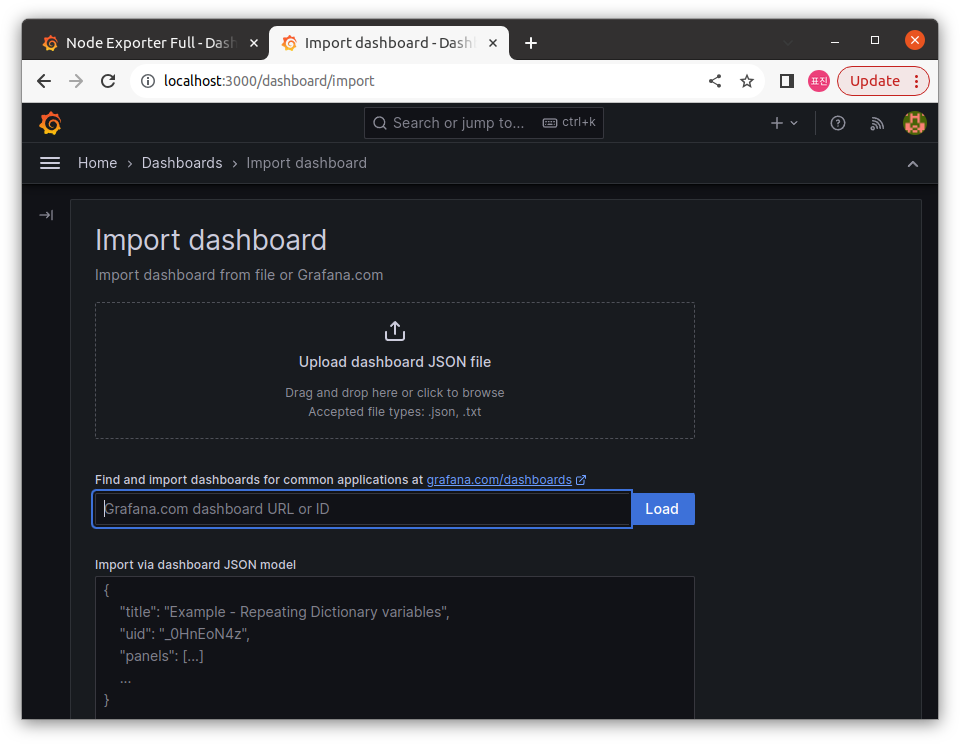
5.2 대시보드 생성
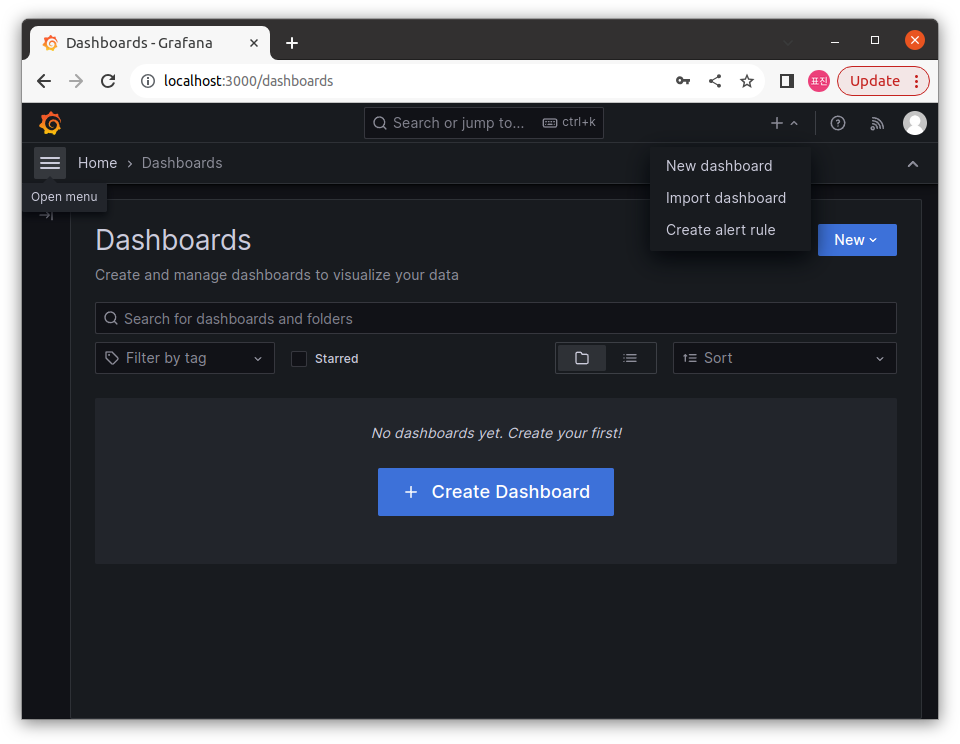
- 오른쪽 위
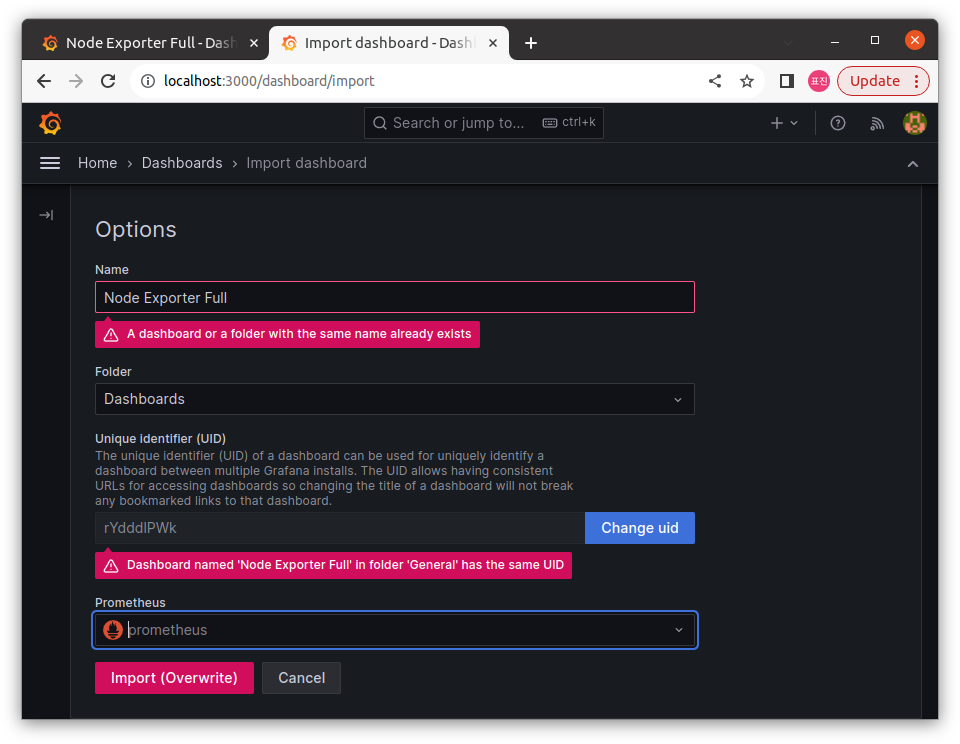
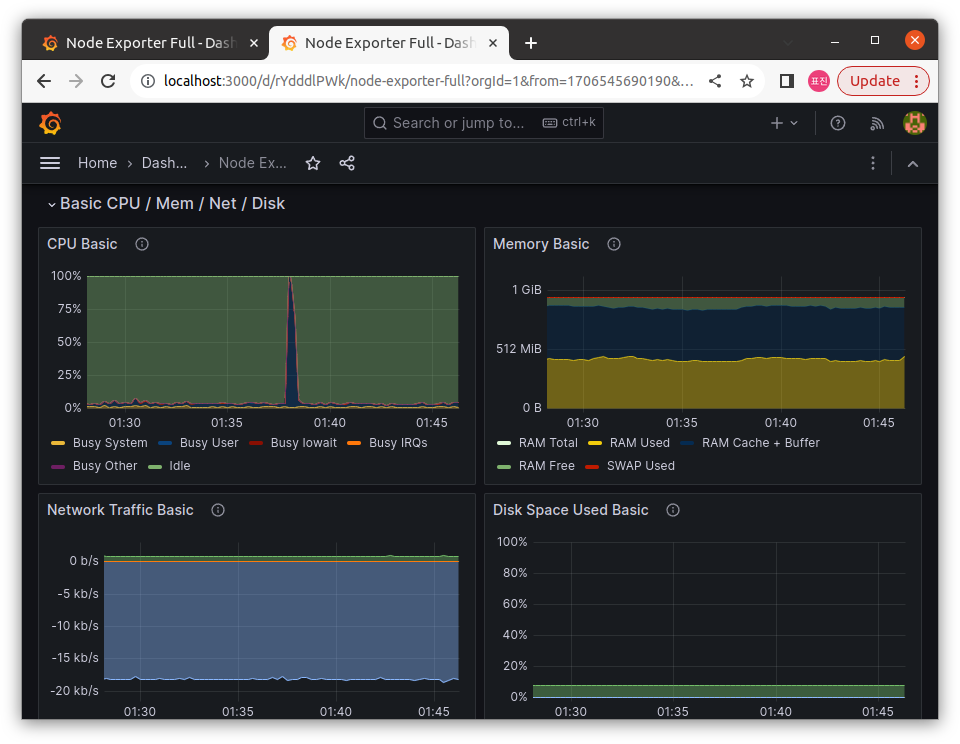
+>import dashboard선택 Find and import dashboards ~에서 원하는 템플릿 선택 (1860)- 앞서 연결한
Prometheus지정해 대시보드 생성
6. cAdvisor
- 컨테이너 모니터링 도구로 docker 컨테이너 별 정보 모니터링 가능
6.1 Vagrantfile 수정
- 다음과 같이 추가한 다음
vagrant up nodex & vagrant ssh nodex로 가상머신 생성, 접속
...
	config.vm.define "nodex", primary: true do |nodex|
        nodex.vm.hostname = "nodex.local"
        nodex.vm.network "private_network", ip: "192.168.56.201"
    end
end- 다음 명령어로 도커 실행
docker run -d --net="host" --pid="host" -v "/:/host:ro,rslave" prom/node-exporter6.2 prometheus.yml 수정
- 원래 환경의
prometheus.yml에 다음 내용 추가
...

    - job_name: 'remote-node-exporter'
      static_configs:
        - targets: ['192.168.56.201:9100']

...Prometheus재실행,Grafana대시보드의Job에서 확인
docker compose restart prometheus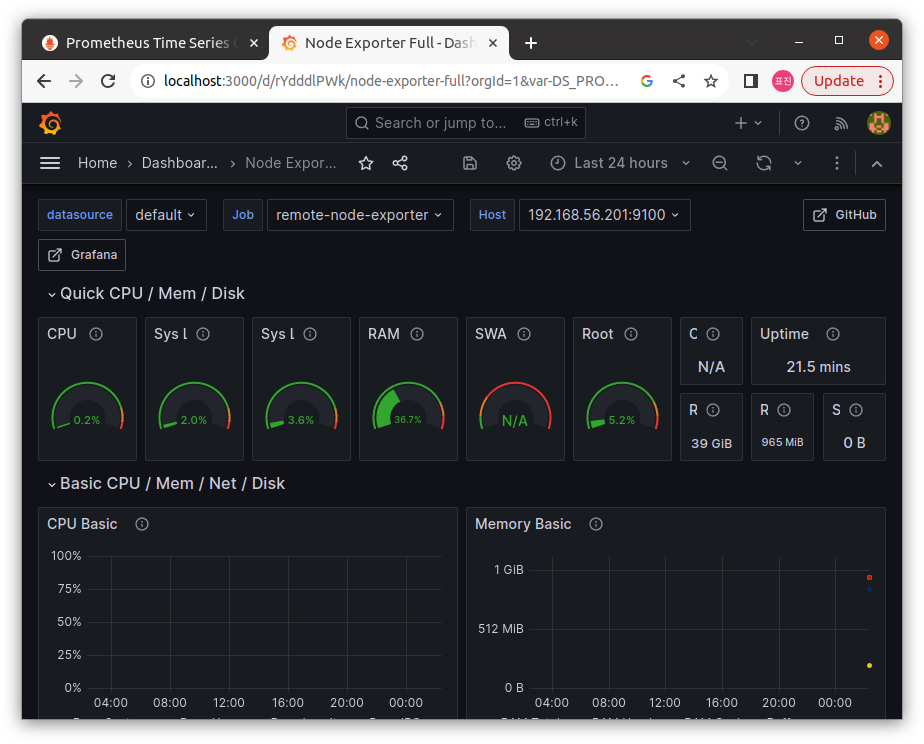
6.3 각 Node exporter에 cAdvisor 붙이기
docker-compose.yml에 다음 내용 추가docker compose up -d cadvisor로 실행
...
cadvisor:
image: zcube/cadvisor:latest
volumes:
- /:/rootfs:ro
- /var/run:/var/run:rw
- /sys:/sys:ro
- /var/lib/docker/:/var/lib/docker:ro
- /dev/disk/:/dev/disk:ro
ports:
- 8080:8080
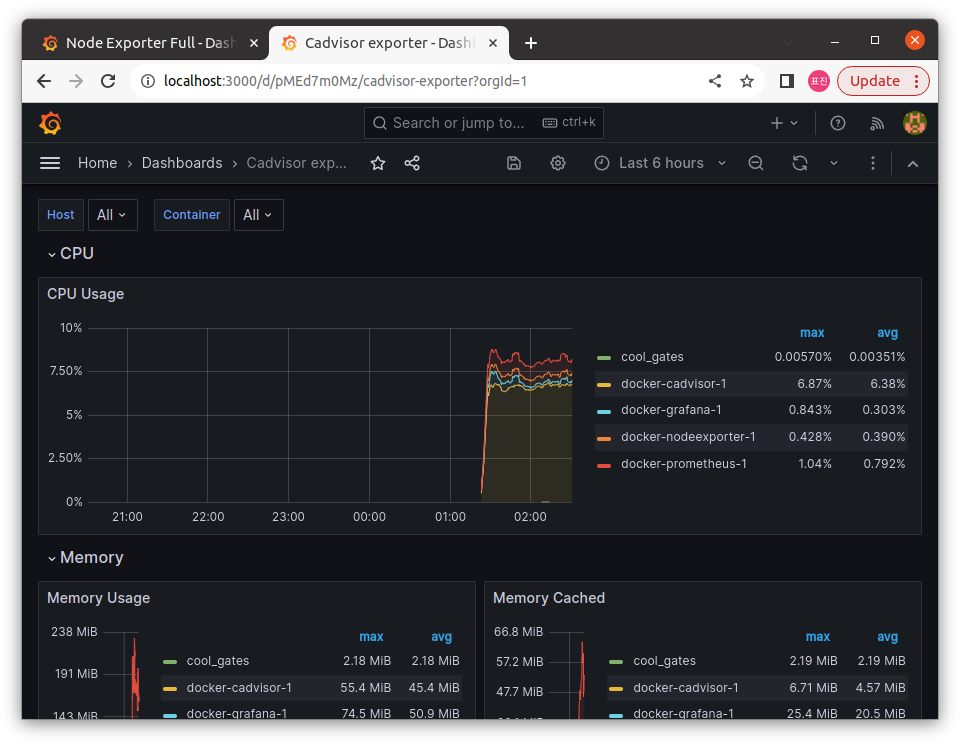
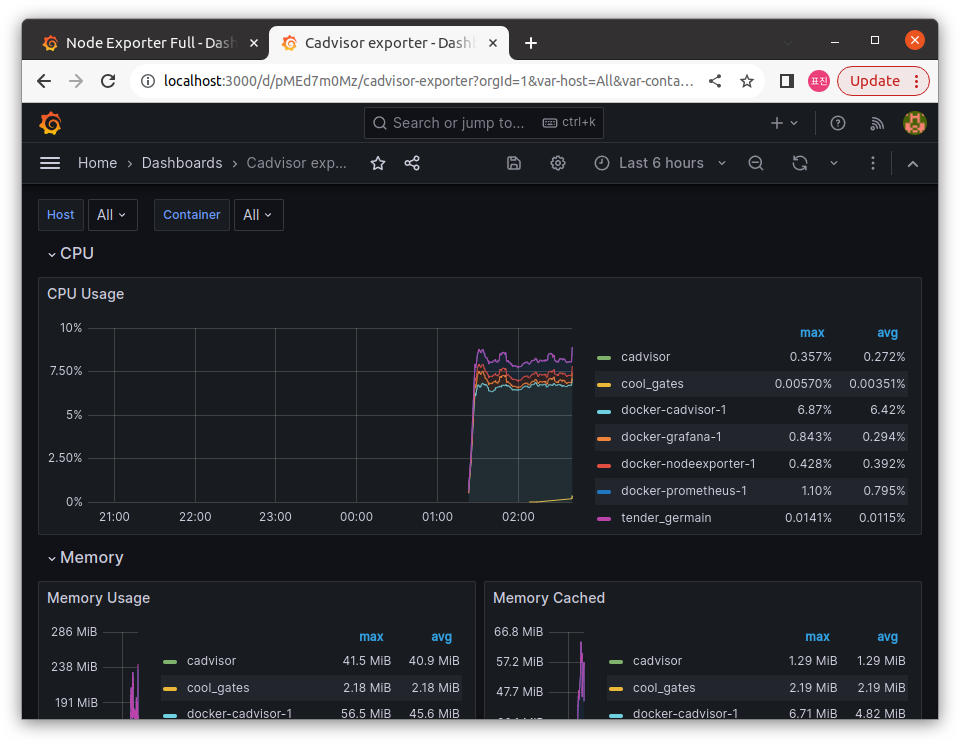
...6.4 cAdvisor를 위한 대시보드 생성
Prometheus대시보드를 생성할 때와 마찬가지로cAdvisor를 위한 대시보드 생성 (14282)
- 원격
Node Exporter를 실행한 가상머신에서 다음 명령 실행
docker run --volume=/:/rootfs:ro --volume=/var/run:/var/run:ro --volume=/sys:/sys:ro --volume=/var/lib/docker/:/var/lib/docker:ro --volume=/dev/disk/:/dev/disk:ro --publish=8080:8080 --detach=true --name=cadvisor google/cadvisor:latest- 원래 환경의
prometheus.yml에 다음 내용 추가,docker compose restart prometheus로 재실행
...

    - job_name: 'remote-cAdvisor'
      scrape_interval: 5s
      static_configs:
        - targets: ['192.168.56.201:8080']

...
7. 이미지 배포
app.py작성
from flask import Flask, request
from PIL import Image
from torchvision import transforms, models
import torch
import io

app = Flask(__name__)

model = models.mobilenet_v2(pretrained=True)
model.eval()

transform = transform.Compose([transforms.Resize((224, 224)),
								transforms.ToTensor(),
                                transforms.Normalize(mean=[0.485, 0.456, 0.406],
                                std=[0.229, 0.224, 0.225])])

@app.route('/predict', methods=['POST'])
def predict():
	if request.method == 'POST':
    	file = request.files['file']
        image_bytes = file.read()
        iamge = Image.open(io.BytesIO(image_bytes))
        image = transform(image).unsqueeze(0)
        outputs = model(image)
        _, predicted = torch.max(outputs.data, 1)
        return str(predicted.item())

if __name__ == '__main__':
app.run(host='0.0.0.0', port=5000)requirements.txt작성
flask
torch
torchvision
pillowDockerfile작성
FROM python:3.8-slim-buster

WORKDIR /app

COPY requirements.txt ./
RUN pip install --no-cache-dir -r requirements.txt

COPY app.py ./

CMD ["python", "./app.py"]-
docker build -t imageclassi ication:latest .를 통해 이미지 생성 -
docker swarm init을 실행,docker node ls를 통해 확인
docker service create --replicas 2 --name my_service --publish published=5000,target=5000 imageclassi ication:latest7. Workload generator 만들기
run.sh생성
#! /bin/bash

IMAGES=($(ls ./test_image/*.jpg))

RANDOM_IMAGE="${IMAGES[RANDOM % ${#IMAGES[@]}]}"

curl -X POST -F file=@${RANDOM_IMAGE} http://<아이피>:5000/predict