node_exporter
리눅스 노드의 리소스를 제공해주는 툴이다.
node_exporter : 9100포트를 통해 노출(기본 설정)
설치
wget https://github.com/prometheus/node_exporter/releases/download/v1.0.1/node_exporter-1.0.1.linux-amd64.tar.gz
tar xvfz node_exporter-1.0.1.linux-amd64.tar.gz
cd node_exporter-1.0.1.linux-amd64
mv node_exporter /usr/bin/
서비스 등록
vi /usr/lib/systemd/system/node_exporter.service

# -*- mode: conf -*-

[Unit]
Description=Prometheus exporter for machine metrics, written in Go with pluggable metric collectors.
Documentation=https://github.com/prometheus/node_exporter
After=network.target

[Service]
User=root
Group=root
Type=simple
ExecStart=/usr/bin/node_exporter
Restart=on-failure
RestartSec=5s
재 시작
systemctl daemon-reload
systemctl start node_exporter systemctl enable node_exporter
노드 익스포터 등록
sudo vi /etc/prometheus/prometheus.yml
- job_name: mynode
static_configs:
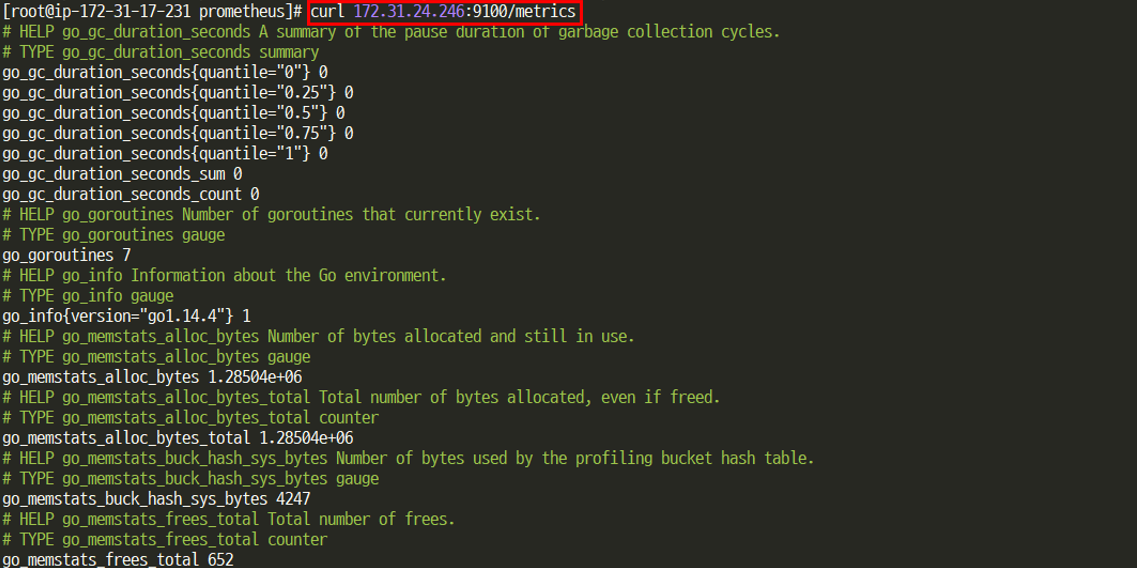
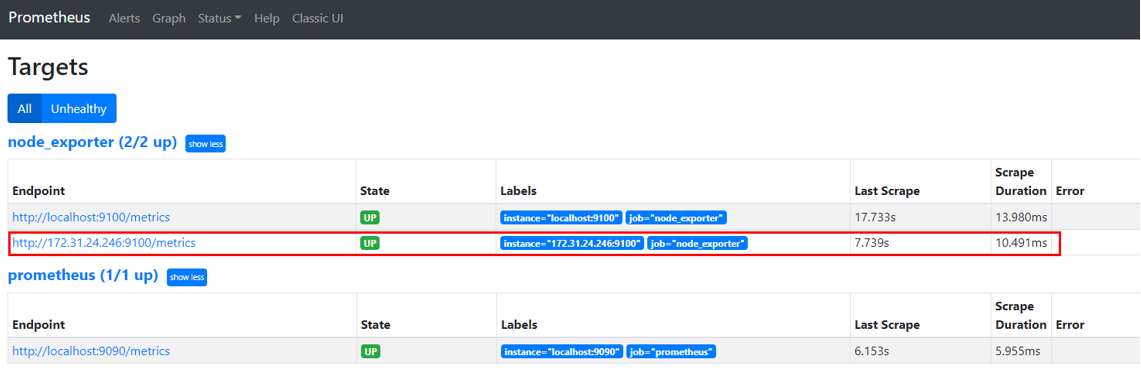
- targets: ['localhost:9100','<ip>:<9100>']아래 이미지와 같이 http endpoint(ip:9100/metrics)를 통해 메트릭 정보를 제공하는 모습을 확인할 수 있으며 프로메테우스 타겟에도 등록되어 메트릭정보를 수집하고 있는 것을 확인할 수 있다.